Master candle strategy MT5
- Indikatoren
-
Jan Flodin
 Hello, my name is Jan and I have been developing automated trading tools for the last 9 years. I am originally from Sweden but have lived in the Czech Republic since 2003.
PRODUCTS - Version: 1.1
- Aktualisiert: 26 Juli 2020
- Aktivierungen: 10
Dieser Indikator erkennt eine spezielle Art von Inside Bar-Formation, die durch eine große Master-Kerze, gefolgt von 4 kleineren Kerzen, gebildet wird (siehe die Strategieerklärung unten).
Merkmale
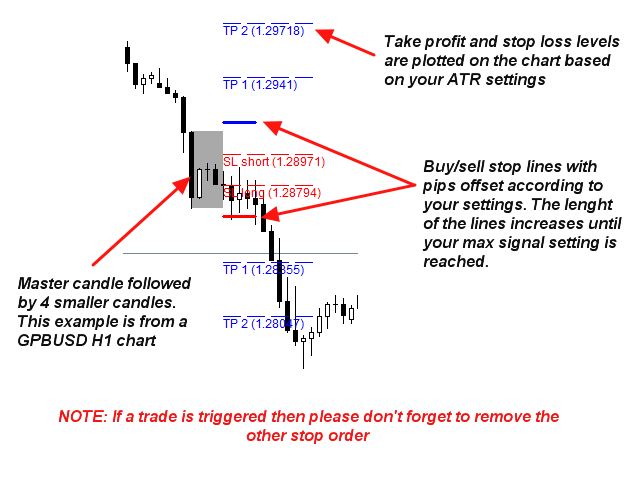
- Zeichnet Kauf-/Verkaufs-Stop-Linien auf dem Chart sowie Take-Profit- und Stop-Loss-Levels ein. Die TP/SL-Levels basieren auf dem Average True Range (ATR) Indikator.
- Die Objektfarben sind veränderbar.
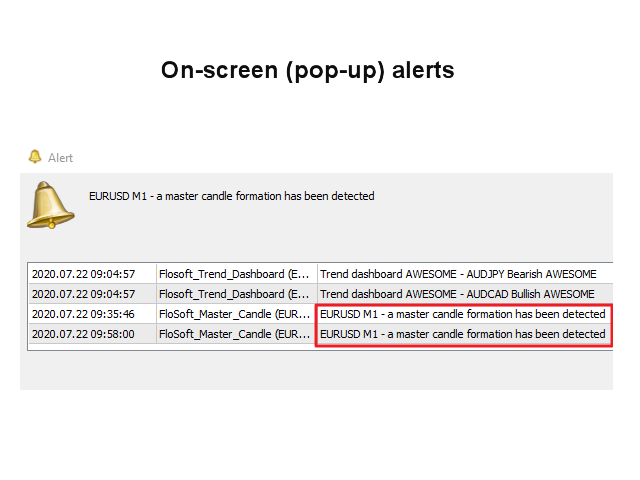
- Sendet Ihnen einen Echtzeit-Alarm, wenn eine Master-Kerzenformation identifiziert wird - Ton / Popup / E-Mail / Push-Benachrichtigung.
Sobald ein Vorschlag gemacht wird, können Sie ihn mit Ihrer eigenen Chartanalyse bestätigen. Im Allgemeinen werden die besten Setups gehandelt, wenn sie um wichtige Unterstützungen/Widerstände, runde Zahlen, Angebots- und Nachfragezonen usw. herum auftreten.
Eingabeparameter
- Anzahl der Innenkerzen: Für die beste Signalqualität wird empfohlen, den Wert auf 4 zu setzen (siehe Strategieerklärung unten).
- Maximale Kerzenanzahl für die das Signal gültig ist: Diese Einstellung steuert, wie lange sich die vorgeschlagenen Einstiegslinien ausdehnen werden.
- Abstand in Punkten für Kauf-/Verkaufsstopp: Der Offset/Puffer für die Einstiegslinien. Empfohlen wird ein Abstand von mindestens 5 Pips zum Hoch/Tief der Master-Kerze.
- Mindestgröße der Masterkerze in Punkten: Bitte beachten Sie die untenstehende Erklärung der Strategie.
- Maximale Masterkerzengröße in Punkten: Bitte beachten Sie die untenstehende Erklärung der Strategie.
- Warten auf Kerzenschluss: true/false. Standard ist True. Wenn auf False gesetzt, wird der Alarm bereits bei der Eröffnung der 4 . Kerze ausgelöst.
- Dochte auf inneren Balken ignorieren: Diese Funktion funktioniert nicht richtig. Bitte lassen Sie mich wissen, wenn Sie sie verwenden wollen, und ich werde Ihnen den Indikator als Anhang zu einer privaten Nachricht hier auf MQL5 schicken.
true/false. Die Voreinstellung ist False. Bei True sind Dochte oberhalb/unterhalb des Hochs/Tiefs der Master-Kerze erlaubt. - Dochte auf Master-Bar ignorieren: true/false.
- ATR Zeitraum: Zeitraum für den Average True Range Indikator. Voreinstellung ist 14.
- TP 1 ATR-Multiplikator: Wird für das erste Take-Profit-Level verwendet.
- TP 2 ATR-Multiplikator: Wird für das zweite Take-Profit-Niveau verwendet.
- SL ATR-Multiplikator: Wird für das Stop-Loss-Niveau verwendet.
- Objekte: In diesem Abschnitt können Sie die Farben des Rechtecks der Master-Formation und der Buy/Sell-Stop-Linien ändern. Sie können auch die Breite der Kauf-/Verkaufsstopp-Linien festlegen.
- Text unter den Linien anzeigen: wahr/falsch. Wenn Sie False einstellen, werden TP/SL + Preis nicht unter die Linien geschrieben.
- Max. Verlaufskerzen: Für wie viele Kerzen in der Zeit zurück wird die Formation auf dem Chart gezeichnet.
- Warnungen: Setzen Sie für jeden Alarmtyp, den Sie erhalten möchten, den Wert true. Alle Metatrader-eigenen Alarmtypen werden unterstützt.
Strategie
Master Candle (MC) ist eine Handelsstrategie, die auf einer Kerzenformation basiert, bei der auf die erste (Master-)Kerze 4 kleinere Kerzen folgen, die innerhalb der ersten Kerze liegen. Die gesamte Formation besteht aus 5 Kerzen, unabhängig davon, ob sie bärisch oder bullisch ist.
Zeitrahmen: H1- und H4-Charts. Auch wenn die MC-Strategie am besten auf H1 funktioniert, kann sie auf allen Zeitrahmen und Währungspaaren gehandelt werden. Hauptsächlich auf H4, H1 und M30 Charts.
Währungspaare: Lässt sich am besten mit volatilen Paaren wie GBPUSD und GBPJPY handeln.
Nach dem Bruch des MC-Hochs/Tiefs wird eine Position in der Richtung des Bruchs eingegangen. Es wird empfohlen, dass der MC eine Größe von 40 bis 100 Pips hat (dies hängt jedoch von der Volatilität des betreffenden Währungspaares ab). Es wird auch empfohlen, Stop-Orders z.B. 5 Pips über und unter dem MC-Hoch/Tief zu setzen.
Einige Händler verwenden auch die Regel, dass ein Durchbruch in eine beliebige Richtung innerhalb der nächsten 3 Kerzen nach der MC-Erstellung (5 . Kerze ) erfolgen sollte. In jedem Fall ist es sehr empfehlenswert, eine Stop-Order zu stornieren, wenn nach 24 Stunden kein Durchbruch erfolgt ist.
Um bessere Ergebnisse zu erzielen, empfiehlt es sich, in Trendrichtung zu handeln und den Handel an starken und wichtigen Kursniveaus - Widerständen und Unterstützungen - zu vermeiden. Es ist auch ratsam, nicht mit MC zu handeln, die innerhalb eines anderen MC erscheinen.