Multi oscillator divergence
- Indikatoren
-
Jan Flodin
 Hello, my name is Jan and I have been developing automated trading tools for the last 9 years. I am originally from Sweden but have lived in the Czech Republic since 2003.
PRODUCTS - Version: 3.3
- Aktualisiert: 15 Juni 2022
- Aktivierungen: 10
Ich empfehle Ihnen,den Blog des Produkts (Handbuch) von Anfang bis Endezu lesen, damit von Anfang an klar ist, was der Indikator bietet.
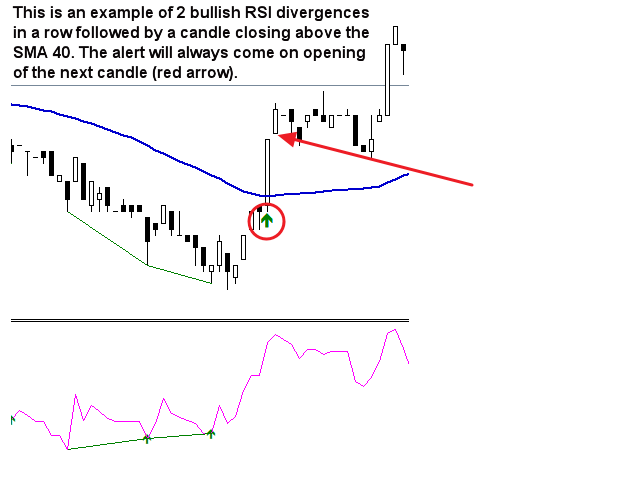
Dieser Indikator für Metatrader 4 erkennt, wenn eine Divergenz zwischen dem Preis und einem Oszillator/Indikator auftritt. Er identifiziert sowohl bullische als auch bearische Divergenzen. Er verfügt über eine RSI-Filteroption, die es ermöglicht, nur die stärksten Setups herauszufiltern. Der Indikator bietet auch die Möglichkeit, auf eine Engulfing-Formation, den Durchbruch eines Donchian-Kanals oder das Überschreiten eines gleitenden Durchschnitts zu warten (siehe Screenshot #3), um die Divergenz zu bestätigen, bevor die Handelsmöglichkeit signalisiert wird. In Kombination mit Ihren eigenen Regeln und Techniken können Sie mit diesem Indikator Ihr eigenes leistungsstarkes System erstellen (oder verbessern).
Funktionen
- Am Ende des Blogs können Sie den Quellcode eines Beispiel-Expert Advisors (EA) herunterladen, der die Funktion iCustom() verwendet, um Handelssignale vom Indikator abzurufen. Obwohl der EA voll funktionsfähig ist, besteht der Hauptzweck darin, den Code zu verwenden und ihn in Ihren eigenen entwickelten EA einzufügen.In Anbetracht meiner begrenzten Zeitkann ich jedoch keine Unterstützung bei der Programmierung bieten, ich bitte um Entschuldigung.
- Kann Divergenzen für die folgenden Oszillatoren/Indikatoren erkennen: MACD (Metatrader nativ), OsMA, Stochastik, RSI, CCI, RVI, Awesome, ADX, Composite Index, ATR, OBV, MFI, Momentum, Accumulation/Distribution und Accelerator. Es kann nur ein Oszillator/Indikator ausgewählt werden.
- Zeichnet durchgezogene Linien für reguläre/klassische (potenzielle Umkehr) Divergenzen und gestrichelte Linien für versteckte (Trendfortsetzung) Divergenzen. Die Linien werden sowohl auf dem Chart als auch im Indikatorfenster gezeichnet.
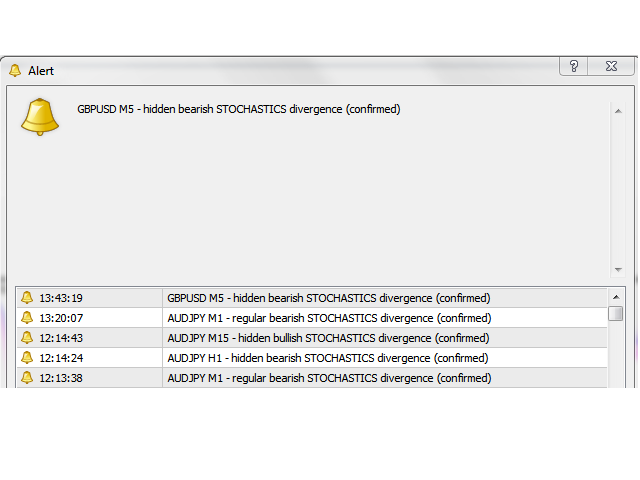
- Sendet eine Warnung, wenn eine Divergenz oder ein Ausbruch/Kreuzung erkannt wurde. Alle Metatrader-eigenen Alarmtypen werden unterstützt.
Eingabeparameter
Die Beschreibung und Erklärung der Eingabeparameter finden Sie hier.


Good signal when trader can combine with OB and OS in big TF.