Double divergence scanner
- Indikatoren
-
Jan Flodin
 Hello, my name is Jan and I have been developing automated trading tools for the last 9 years. I am originally from Sweden but have lived in the Czech Republic since 2003.
PRODUCTS - Version: 3.0
- Aktualisiert: 28 August 2023
- Aktivierungen: 10
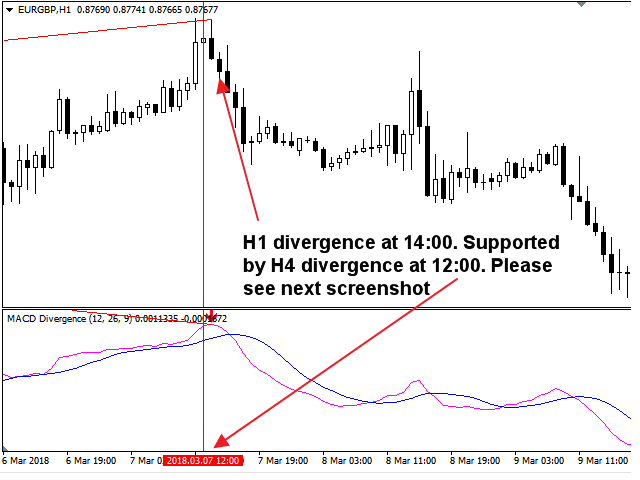
Dieser Multi-Indikator/Oszillator (im Folgenden Indikator), der mehrere Zeitrahmen und Symbole umfasst, erkennt, wenn eine Divergenz zwischen dem Preis und einem, zwei oder drei Indikatoren auftritt. Er identifiziert sowohl regelmäßige/klassische (Trendumkehr) als auch versteckte (Trendfortsetzung) Divergenzen. Er verfügt über RSI- und MA-Trendfilteroptionen, die es ermöglichen, nur die stärksten Setups herauszufiltern. In Kombination mit Ihren eigenen Regeln und Techniken können Sie mit diesem Indikator Ihr eigenes leistungsstarkes System erstellen (oder verbessern).
Er kann auf 3 Arten verwendet werden:
- Setzen Sie sowohl den Haupt- als auch den zweiten/dritten Indikator und belassen Sie den Standardwert "current" als zweiten Zeitrahmen. Auf diese Weise erhalten Sie nur dann Warnungen, wenn eine doppelte Divergenz auf jedem von Ihnen ausgewählten Zeitrahmen auftritt.
- Setzen Sie sowohl den Hauptindikator als auch den zweiten/dritten Indikator und setzen Sie den Zeitrahmen für die zweite/dritte Divergenz z.B. auf H4, oder setzen Sie "Ein Zeitrahmen höher" auf True. Auf diese Weise erhalten Sie nur Alarme, wenn eine zweite/dritte Divergenz auch auf dem Zeitrahmen H4 oder auf einem Zeitrahmen höher als die Hauptdivergenz auftritt.
- Nur Hauptindikator einstellen. Auf diese Weise erhalten Sie Alarme, wenn eine Divergenz beim ausgewählten Indikator auftritt.
Eigenschaften
- Kann Divergenzen für die folgenden Indikatoren erkennen: MACD, Stochastik, OsMA, RSI, CCI, Awesome (AO), ADX, ATR, OBV, MFI, Momentum und Composite Index.
- Sie können alle Symbole, die in Ihrem Market Watch-Fenster sichtbar sind, zur gleichen Zeit überwachen. Wenden Sie den Indikator nur auf einen Chart an und überwachen Sie sofort den gesamten Markt.
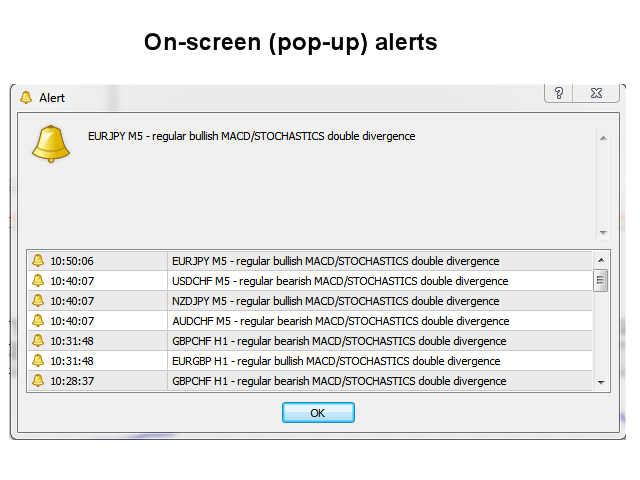
- Kann jeden Zeitrahmen überwachen, von M1 bis MN, und sendet Ihnen einen Echtzeit-Alarm, wenn eine Divergenz identifiziert wurde. Alle nativen Metatrader-Alarmtypen werden unterstützt.
- Kann auch im Single-Chart-Modus verwendet werden (scannt nur den aktuellen Chart).
- Der Indikator enthält ein interaktives Panel. Bitte beachten Sie den separaten Screenshot zur Erklärung.
- Der Indikator kann die Signale in globale Variablen oder eine Datei schreiben, die von einem Expert Advisor für den automatischen Handel verwendet werden kann.
Eingabeparameter
Die Beschreibung und Erklärung der Eingabeparameter finden Sie hier.
Wichtig
Bitte beachten Sie, dass dieser Indikator aufgrund der Multi-Time-Frame-Funktionalität keine Linien und Pfeile oder Verkaufs- und Kaufempfehlungen auf dem Chart, auf dem der Indikator installiert ist, zeichnen kann. Zu diesem Zweck müssen Sie eine Chartvorlage mit meinem kostenlosen Divergenzindikator erstellen. Es ist sehr ratsam, den Indikator auf einem sauberen (leeren) Chart zu installieren, auf dem keine anderen Indikatoren oder Expert Advisors vorhanden sind, die den Scanner stören könnten.


I'm testing for a while, but it looks very interesting, I'm a beginner, I must first understand. The support from Mr. Jan is excellent