• Übersicht
  • Bewertungen (6)
  • Diskussion (18)
  • Neue Funktionen

Candle patterns scanner with trend filter MT5

5

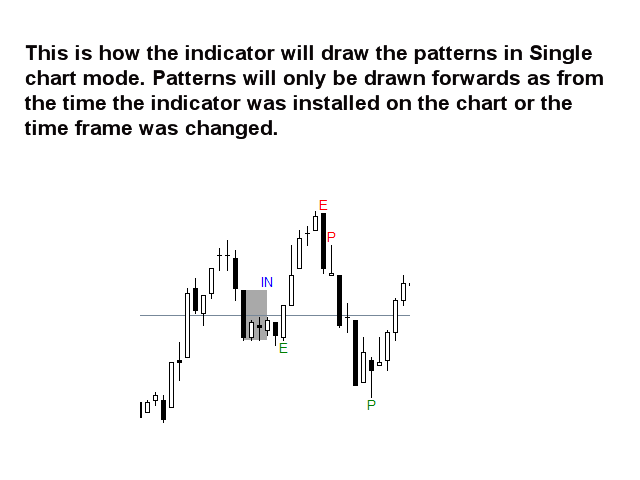
Dieser Multi-Timeframe- und Multi-Symbol-Indikator scannt nach Pin-Bars, Morgen-/Abendsternen, Engulfings, Tweezers, Three Line Strikes, Inside Bars und Wimpel und Dreiecken. Der Indikator kann auch im Single-Chart-Modus verwendet werden. Bitte lesen Sie mehr über diese Option in den Produktinformationen   bloggen .   In Kombination mit Ihren eigenen Regeln und Techniken ermöglicht Ihnen dieser Indikator, Ihr eigenes leistungsstarkes System zu erstellen (oder zu verbessern).

Merkmale

  • Kann alle in Ihrem Marktübersichtsfenster sichtbaren Symbole gleichzeitig überwachen. Wenden Sie den Indikator auf nur einen Chart an und überwachen Sie sofort den gesamten Markt.
  • Überwacht jeden Zeitrahmen von M1 bis MN und sendet Ihnen eine Echtzeit-Benachrichtigung (Pop-up, Push oder E-Mail), wenn ein Muster erkannt wird.
  • Kann RSI- und Bollinger-Bänder als Filter für Pin-Bar-, Morgen-/Abendstern- , Engulfing- und Tweezer-Formationen verwenden, um potenzielle Umkehrungen richtig zu identifizieren.
  • Kann den gleitenden Durchschnitt als Haupttrendfilter und ADX als Volalitätsfilter verwenden.
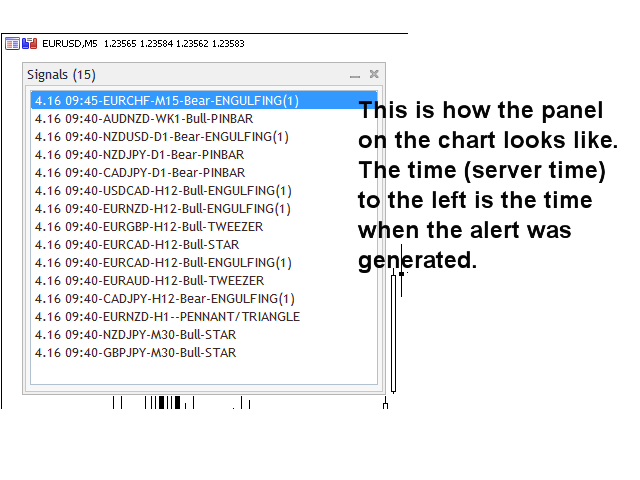
  • Der Indikator enthält ein interaktives Panel. Wenn Sie auf ein Element klicken, wird ein neuer Chart mit dem betreffenden Symbol und Zeitrahmen geöffnet.
  • Der Indikator kann die Signale in eine Datei schreiben, die von einem Expert Advisor für den automatischen Handel verwendet werden kann. Zum Beispiel dieses Produkt .

Das Scannen von Wimpel und Dreiecken identifiziert Ausbruchsmuster mit hoher Wahrscheinlichkeit. Dies geschieht durch die Identifizierung starker, symmetrischer Wimpel und Dreiecke. Dieses Muster erscheint NICHT sehr oft in höheren Zeitrahmen. Aber wenn es das tut, ist es ein Setup mit sehr hoher Wahrscheinlichkeit. Bitte sehen   Screenshots hier .

Eingabeparameter

Die Beschreibung und Erläuterung der Eingabeparameter finden Sie hier .

Wichtig

Bitte beachten Sie, dass aufgrund der Multifunktionalität weder Kauf- und Verkaufsempfehlungen noch Linien und Pfeile auf dem Chart gezeichnet werden, auf dem der Indikator installiert wurde. Linien, die auf die inneren Balken und Wimpel- und Dreiecksformationen sowie Pfeile für die anderen Kerzenmuster hinweisen, werden auf dem Diagramm gezeichnet, das sich öffnet, wenn Sie auf ein Signal im Diagrammfeld klicken.

Es wird dringend empfohlen, den Indikator auf ein sauberes (leeres) Diagramm ohne andere Indikatoren oder Expert Advisors zu setzen, die den Scanner stören könnten.


Bewertungen 6
tunck
1164
tunck 2023.04.08 02:44 
 

SL/TP for patterns?

Kayhan
62
Kayhan 2021.09.07 16:25 
 

I was looking forward to seeing this kind of indicator. Thank you very much.

smmfx
80
smmfx 2020.11.05 16:07 
 

An amazing indicator that gives me very accurate signals based on my strategy. I thank Jan for answering my challenging questions before I buy it. The coding and details that saw looks very professional.

Empfohlene Produkte
Bar Sequential
Maximiliano Frisione Figueroa
This indicator can help you clearly identify trend changes in both bullish and bearish markets. The indicator compares the closing price of the last candle with the closing price of the candle "X" periods ago (input parameter). In an uptrend, an initial number '1' is plotted if a candle closes higher than the closing of a candle "X" periods ago. In a downtrend, an initial number '1' is plotted if a candle closes below the closing of a candle "X" periods ago. Subsequent numbers are plotted when e
I recommend you to read the  product's blog  (manual) from start to end so that it is clear from the beginning what the EA offers. Signal monitoring can be found here . If you first download a demo version of the EA the news file 'newshistory.bin' must be placed in the Metratrader common folder. It depends on your user name and is usually located in  C:\Users\YOUR_USER_NAME\AppData\Roaming\MetaQuotes\Terminal\Common\Files\. You need to download the file 'newshistory.zip', located at the end of
I recommend you to read the   product's blog  (manual) from start to end so that it is clear from the beginning what the indicactor offers. This multi time frame and multi symbol divergence dashboard indicator sends an alert when one or two different divergences have been identified. It can be used with all time frames from M1 to MN. Maximum 9 time frames can be shown in the dashboard at the same time. It is possible to enable moving average, RSI or Bollinger bands trend filter to filter out on
I recommend you to read the   product's blog  (manual) from start to end so that it is clear from the beginning what the indicactor offers. This multi time frame and multi symbol trend indicator sends an alert when a strong trend or trend reversal has been identified. It can do so by selecting to build up the dashboard using Moving average (single or double (both MA:s aligned and price above/below both)), RSI, Bollinger bands, ADX, Composite index (Constance M. Brown), Awesome (Bill Williams), 
I recommend you to read the   product's blog  (manual) from start to end so that it is clear from the beginning what the indicactor offers. This multi time frame and multi symbol indicator identifies double or triple top/bottom formations or a following neckline breakout (confirmed top/bottom). It offers RSI, pin bar, engulfing, tweezer, morning/evening star filters as well divergence filter options which makes it possible to filter out only the strongest setups. The indicator can also be used
Utilities
Douglas Lucio De Araujo
Indicator with 3 features - Clock : Clock independent of the chart, counting continues even when the market is closed. - Template : After setting up a configuration in any graphic, be it color patterns, indicators, zoom ... The configuration will be copied to all active graphics. - TimeFrame : Set the TimeFrame on a chart, and with just one click all the active charts will be changed to the same TimeFrame.
Kill Zones MT5
Diego Arribas Lopez
MT4 Version Kill Zones Kill Zones allows you to insert up to 3 time zones in the chart. The visual representation of the Kill Zones in the chart together with an alert and notification system helps you to ignore fake trading setups occurring outside the Kill Zones or specific trading sessions. Using Kill Zones in your trading will help you filter higher probability trading setups. You should select time ranges where   the market   usually reacts with high volatility. Based on   EST time zone, f
KT DMA is a modified and advanced version of the classic Displaced Moving Averages with buy/sell crossover alerts and a Multi-Timeframe scanner that shows DMA's direction across each real-time time frame. A Displaced Moving Average is a simple moving average that moves ahead or backward in a time frame (either short-term or long-term). It also allows you to predict price movement more accurately. Features Depicts the trend direction using the alignment of three moving averages. Buy/Sell signa
My Point MT5
Claudia Ramona Angerer
Diagnosis of major and minor pivot Trend detection with many signals Can be used in all symbols Can be used in all time frames Settings: Back Show: The number of candles it displays If you need any adjustments, or have any questions or suggestions, message me How to trade: Blue: sell signal Red: buy signal Blue and red at the same time: no signal Exit signal: Opposite signal
Aussenstab Markttechnik
Alexander Josef Zeidler
Dieser Indikator zeigt Aussenstäbe (AS) im Chart in Kerzenform. Die Farben der Kerzen können individuell eingestellt werden. Auch unterschiedliche Farben für bärische und bullische Aussentäbe sind möglich. Zusätzlich ist auch die Farbe der Dochte bzw. Umrandung einstellbar. Aussenstäbe werden z.B. von Michael Voigt im Buch "Das große Buch der Markttechnik" erwähnt. Alle anderen Kerzen sind Innenstäbe.
Optimistic trader may enter the market when the price crosses the Aqua line. More reliable entry will be when the price crosses the Blue line. When the price comes back and crosses the Red line you can open a position in the course of price movements.
Fibonacci automatically draws Fibonacci retracement, Because Fibonacci automatically draws Fibonacci retracement, you can know at a glance the price to buy at a push or sell back. Therefore, you can trade in favorable conditions in a trending market. We are live-streaming the actual operation of the system. Please check for yourself if it is usable. Please check it out for yourself. https://www.youtube.com/@ganesha_forex We do not guarantee your investment results. Investments should be mad
CAD Sniper X MT5
Mr James Daniel Coe
5 (11)
AUFBAUEND AUF DEM ERFOLG MEINES BELIEBTEN KOSTENLOSEN EA 'CAD SNIPER'... ICH PRÄSENTIERE CAD SNIPER X! TAUSENDE WEITERE TRADES | KEINE BROKER-EINSCHRÄNKUNGEN | BESSERE STATISTIKEN | MEHRERE STRATEGIEN Senden Sie mir nach dem Kauf eine PRIVATE NACHRICHT für das Handbuch und einen kostenlosen Bonus ZWEI STRATEGIEN IN EINER FÜR AUDCAD, NZDCAD, GBPCAD und CADCHF Strategie 1 kann mit jedem Broker verwendet werden, handelt viel häufiger und ist die Standardstrategie für CAD Sniper X. E
Dieser auf künstlicher Intelligenz basierende Indikator identifiziert mögliche Marktumkehrpunkte durch Auslesen des Fußabdrucks und signalisiert im Voraus kleine Marktbewegungen, bevor sie auftreten. Im Gegensatz zu Preis- und Volumenindikatoren, die „späte“ Einträge generieren, d. h. wenn bei einer Richtungsänderung bereits eine Bestätigung des Preises oder Volumens erfolgt ist und die Bewegung daher oft bereits beendet ist, signalisiert dieser Indikator basierend auf dem, was er in der Tabell
SMARTMASS INDICATOR This indicator is different from all known volume indicators. It has a significant distinction; it is an algorithm that relates price movement to volume, attempting to find proportionality and efficient movement while filtering out noise and other movements that are more random and do not follow a trend or reversal. Ultimately, it reveals the true strength of the movement, indicating whether it has genuine support from bulls or bears or if it's merely a high-volume movemen
The 4 headed dragon is an indicator that has two functions. 1) Set the background trend. 2) Mark the predominant trend. By combining these two indicator signals, we will be able to trade for or against the trend, adapting the signals to your reading of the market. You can download the demo and test it yourself. 1) Set the background trend.    Define four possibilities of trend that are the four heads of the dragon, marked by colors on the indicator, marking a) Powerful buying trend. b)
Candle Good Setup
Kibalo Alain Kabissa
You ask yourself the question every time you open your charts: how to win in trading? Will using a lot of indicators work? well know that I also asked myself the same questions when I first started trading. After testing many indicators, I realized that winning trading is simple and accurate trading. after several months of thinking and optimizing I was able to find my solution: Candle Good Setup Candle Good setup is a trend and entry timing indicator analyzing the market in multi-frame to give
Dieser Indikator mit mehreren Zeitrahmen und mehreren Symbolen identifiziert doppelte Top/Boden-, Kopf- und Schulter-, Wimpel-/Dreiecks- und Flaggenmuster. Es ist auch möglich, Alarme nur dann einzurichten, wenn ein Nackenlinien-/Dreiecks-/Fahnenmast-Ausbruch aufgetreten ist (Nackenlinien-Ausbruch = bestätigtes Signal für Top/Bottoms und Head & Shoulders).       Der Indikator kann auch im Single-Chart-Modus verwendet werden. Bitte lesen Sie mehr über diese Option in den Produktinformationen    
Despite the apparent simplicity of the indicator, inside it has complex analytical algorithms with which the system determines the moments of inputs. The indicator gives accurate and timely signals to enter and exit the transaction that appear on the current candle. The main purpose of this indicator is to determine the moments of entry and exit from transactions, therefore, the Trend Revers indicator will display only the trend line and entry points, that is, displays the entry points to the
Zigzag X Fibo
Ian David Emmanuel Bello
The ZigZag indicator's main objective is to highlight significant price movements by filtering out minor price fluctuations. It enables the visualization of trends by eliminating market "noise," which can assist traders in making more informed decisions. Adding the Fibonacci indicator, which is a powerful tool for identifying potential support and resistance levels in financial markets.
I  recommend you to read the   product's blog  (manual) from start to end so that it is clear from the beginning what the indicator offers. This multi time frame and multi symbol indicator scans for engulfing and tweezer formations.  The indicator can also be used in single chart mode. Combined with your own rules and techniques, this indicator will allow you to create (or enhance) your own powerful system. Features Can monitor all symbols visible in your Market Watch window at the same time. A
High And Low MT5
Dmitriy Parfenovich
On the current chart, this indicator displays candlestick highs and lows of another time frame. Input Parameters: TimeFrame - chart time frame whose data will be displayed on the current price chart (by default, H12). Time Zone - shift of the indicator by time zone relative to the broker's time (by default, Broker-1). If the broker's time zone is UTC+1 and the Time Zone parameter is set to Broker-1, the bends of the indicator will be plotted in multiples of Greenwich Time. Indicator buffer value
Seasonal Pattern Trader
Dominik Patrick Doser
Disclaimer:   Bedenken Sie, dass saisonale Muster nicht immer zuverlässig sind. Deshalb ist ein durchdachtes Risikomanagement entscheidend, um Verluste zu minimieren. Saisonale Muster in der Finanzwelt sind wie ein gut gehütetes Geheimnis, das erfolgreiche Investoren für ihren Vorteil nutzen.  Diese Muster sind wiederkehrende Preisbewegungen, die in bestimmten Zeiträumen oder um besondere Ereignisse auftreten. Hier sind einige Beispiele und Hinweise zur optimalen Nutzung dieser Muster: Beispie
DM IND Exclusive
Sergio Vidal Prado
Indicador Para Opções Binarias. Indicator for Binary Options Usa dois gales. Instalar em mt5 Esse indicador é para ser usado no tempo de vela de 5 minutos e em M5. Este também funciona em M1, porém é mais eficiente em M5. Só descompactar e copiar os arquivos na pasta de dados do seu MT5. Arquivos indicator na pasta MQL5 - Indicator. Baixe também a Media Movel totalmente gratis: https://www.mql5.com/pt/market/product/50400 Esse Indicador é para a próxima vela. Apareceu a seta, só aguardar a pr
Snap Fire MT5
Adisak Vongkingsri
SIGNAL  :   https://www. myfxbook. com/members/FXRIndicator/vantage-snapfire/10735810 Price increase $50 for every 100% profit. MT4 :  https://www.mql5.com/en/market/product/113962 MT5 :  https://www.mql5.com/en/market/product/113961 ADVANTAGES One chart Setup . Great result in past and still going . No important settings . just chose risk level what you can afford . REQUIREMENT Best Brokers Recommended :  STD account on   ICmarkets  . ( you can use ENC account if you can afford commiss
"Battles between bulls and bears continue to influence price development long after the combat has ended, leaving behind a messy field that observant technicians can use to manage risk and find opportunities. Apply "trend mirror" analysis to examine these volatile areas, looking for past action to impact the current trend when price turns and crosses those boundaries." RSI Mirrors and Reflections is a robust technique using multiple RSI periods, mirrors and reflections based on RSI values to ind
Aliens dougkang de moviles
Cesar Juan Flores Navarro
Tomamos 5 medios móviles las unimos en una la cual suavizamos y volvemos a suavizar, resultando un mega suavizador de medios móviles suavizadas. Indicador de mql5 funciona en cualquier broker y para todos los tiempos, siendo el mas optimo el de 5, 15 a mas. Funciona mejor en grupo consigo misma osea poner uno de 14 y otro de 50 y 400,, así se observa mejor su desempeño.
Pick and Roll
Marta Gonzalez
Pick and Roll   it is a Secure Automated Software for trade 28 pairs ​​simultaneously. P ick and Roll It is optimized for 28 pairs of forex market Pick and Roll  system operation: 1: PREVIOUS   TREND 2: CONSOLIDATION 3:   RUPTURE D o not use this robot at the same time as others, it is a multi-value robot, therefore it manages 28 pairs simultaneously. The architecture is a Fully Automatic Autonomous Robot Expert capable of independently analyzing the market and making trading decisions   
Halley´s comet   it is a Secure Automated Software for trade Forex market and indices. The architecture is a Fully Automatic Autonomous Robot Expert capable of Independently analyzing the market and making trading decisions  Halley´s comet             It is an advanced trading system. This is a fully automatic Expert Advisor.     Halley´s comet   . It is a 100% automatic system,  The system is self-sufficient, performing all the work.     Is a revolution in the  customization of the tra
Indicator Name: Signal Generator Non Repaint. The arrow is non-repaint. Its a non-repaint arrow or money back guarantee. Arrow appeared after candle closed. Very accurate. Time Frame: Any Assets: Any This is MT5 version I use this to trade Gold, US30, Nasdaq and Dax at New York and London Opening. TF m5/m15 Parameters: Push Notifications = True ( You can set the alert send to your mobile phone) To Setup Sending Alert to your mobile phone 1. At Metatrader Options > Options > Notifications > Ena
Käufer dieses Produkts erwarben auch
Atomic Analyst MT5
Issam Kassas
4.22 (9)
Zunächst einmal ist es erwähnenswert, dass dieser Handelsindikator nicht neu malt, nicht neu zeichnet und keine Verzögerung aufweist, was ihn sowohl für manuellen als auch für Roboterhandel ideal macht. Der Atom-Analyst ist ein PA-Preisaktionsindikator, der die Stärke und das Momentum des Preises nutzt, um einen besseren Vorteil auf dem Markt zu finden. Ausgestattet mit fortschrittlichen Filtern, die helfen, Rauschen und falsche Signale zu entfernen, und das Handelspotenzial zu erhöhen. Durch
Zunächst einmal ist es wichtig zu betonen, dass dieses Handelssystem ein Nicht-Repainting-, Nicht-Redrawing- und Nicht-Verzögerungsindikator ist, was es sowohl für manuelles als auch für automatisches Trading ideal macht. Das "Smart Trend Trading System MT5" ist eine umfassende Handelslösung, die für neue und erfahrene Trader maßgeschneidert ist. Es kombiniert über 10 Premium-Indikatoren und bietet mehr als 7 robuste Handelsstrategien, was es zu einer vielseitigen Wahl für verschiedene Marktbe
Quantum Trend Sniper
Bogdan Ion Puscasu
5 (36)
Wir stellen vor       Quantum Trend Sniper Indicator   , der bahnbrechende MQL5-Indikator, der die Art und Weise, wie Sie Trendumkehrungen erkennen und handeln, verändert! Entwickelt von einem Team erfahrener Händler mit über 13 Jahren Handelserfahrung,       Quantum Trend Sniper-Indikator       wurde entwickelt, um Ihre Trading-Reise mit seiner innovativen Methode zur Identifizierung von Trendumkehrungen mit extrem hoher Genauigkeit auf ein neues Niveau zu heben. ***Kaufe Quantum Trend Snipe
Trend Screener Pro MT5
STE S.S.COMPANY
4.89 (61)
Nutzen Sie die Macht des Trendhandels mit Trend Screener Indicator: Ihrer ultimativen Trendhandelslösung, die auf Fuzzy-Logik und einem System mit mehreren Währungen basiert! Steigern Sie Ihren Trendhandel mit Trend Screener, dem revolutionären Trendindikator mit Fuzzy-Logik. Es handelt sich um einen leistungsstarken Trendfolgeindikator, der über 13 Premium-Tools und -Funktionen sowie 3 Handelsstrategien kombiniert und ihn zu einer vielseitigen Wahl macht, um Ihren Metatrader in einen Trendanaly
Advanced Supply Demand MT5
Bernhard Schweigert
4.53 (15)
Derzeit 33% Rabatt! Die beste Lösung für jeden Anfänger oder erfahrenen Händler! Dieser Indikator ist ein einzigartiges, qualitativ hochwertiges und erschwingliches Trading-Tool, da wir eine Reihe von proprietären Funktionen und eine neue Formel integriert haben. Mit diesem Update werden Sie in der Lage sein, doppelte Zeitrahmenzonen anzuzeigen. Sie können nicht nur einen höheren TF (Zeitrahmen) anzeigen, sondern sowohl den Chart-TF als auch den höheren TF: SHOWING NESTED ZONES. Alle Supply Dema
RelicusRoad Pro MT5
Relicus LLC
4.81 (21)
Jetzt 147 US -Dollar (nach ein paar Aktualisierungen auf 499 US -Dollar) - Unbegrenzte Konten (PCs oder MACs) RelicusRoad Benutzerhandbuch + Schulungsvideos + Zugang zur privaten Discord-Gruppe + VIP-Status EINE NEUE ART, DEN MARKT ZU BETRACHTEN RelicusRoad ist der weltweit leistungsstärkste Handelsindikator für Forex, Futures, Kryptowährungen, Aktien und Indizes und gibt Händlern alle Informationen und Tools, die sie benötigen, um profitabel zu bleiben. Wir bieten technische Analysen un
Zunächst einmal ist es wichtig zu betonen, dass dieses Handelstool ein Nicht-Repaint-, Nicht-Redraw- und Nicht-Verzögerungsindikator ist, was es ideal für professionelles Trading macht. Der Smart Price Action Concepts Indikator ist ein sehr leistungsstarkes Werkzeug sowohl für neue als auch erfahrene Händler. Er vereint mehr als 20 nützliche Indikatoren in einem und kombiniert fortgeschrittene Handelsideen wie die Analyse des Inner Circle Traders und Strategien des Smart Money Concepts. Diese
Wir stellen vor       Quantum Breakout PRO   , der bahnbrechende MQL5-Indikator, der die Art und Weise, wie Sie mit Breakout-Zonen handeln, verändert! Entwickelt von einem Team erfahrener Händler mit über 13 Jahren Handelserfahrung,       Quantum Breakout PRO       ist darauf ausgelegt, Ihre Handelsreise mit seiner innovativen und dynamischen Breakout-Zone-Strategie auf ein neues Niveau zu heben. Der Quantum Breakout Indicator zeigt Ihnen Signalpfeile auf Breakout-Zonen mit 5 Gewinnzielzone
FX Power MT5 NG
Daniel Stein
5 (4)
Erhalten Sie Ihr tägliches Marktupdate mit Details und Screenshots über unser Morning Briefing hier auf mql5 und auf Telegram ! FX Power MT5 NG ist die nächste Generation unseres langjährig sehr beliebten Währungsstärkemessers FX Power. Und was bietet dieser Stärkezähler der nächsten Generation? Alles, was Sie am ursprünglichen FX Power geliebt haben PLUS GOLD/XAU-Stärkeanalyse Noch präzisere Berechnungsergebnisse Individuell konfigurierbare Analysezeiträume Anpassbares Berechnungslimit für noc
AW Trend Predictor MT5
AW Trading Software Limited
4.76 (54)
Die Kombination von Trend- und Aufschlüsselungsebenen in einem System. Ein fortschrittlicher Indikatoralgorithmus filtert Marktrauschen, bestimmt den Trend, Einstiegspunkte sowie mögliche Ausstiegsniveaus. Indikatorsignale werden in einem Statistikmodul aufgezeichnet, das es Ihnen ermöglicht, die am besten geeigneten Tools auszuwählen, die die Wirksamkeit der Signalhistorie zeigen. Der Indikator berechnet Take-Profit- und Stop-Loss-Marken. Handbuch und Anleitung ->   HIER   / MT4-Version ->   H
FX Volume MT5
Daniel Stein
4.94 (17)
Erhalten Sie Ihr tägliches Marktupdate mit Details und Screenshots über unser Morning Briefing hier auf mql5 und auf Telegram ! FX Volume ist der ERSTE und EINZIGE Volumenindikator, der einen ECHTEN Einblick in die Marktstimmung aus Sicht eines Brokers bietet. Es bietet fantastische Einblicke in die Positionierung von institutionellen Marktteilnehmern, wie z.B. Brokern, auf dem Forex-Markt, viel schneller als COT-Berichte. Diese Informationen direkt auf Ihrem Chart zu sehen, ist der wahre Game
Dies ist ein Indikator für MT5, der genaue Signale für den Einstieg in einen Handel ohne Repainting (Neuzeichnen) liefert. Er kann auf alle Finanzwerte angewendet werden: Forex, Kryptowährungen, Metalle, Aktien, Indizes. Er liefert ziemlich genaue Schätzungen und sagt Ihnen, wann es am besten ist, eine Position zu eröffnen und zu schließen. Sehen Sie sich das Video (6:22) mit einem Beispiel für die Verarbeitung nur eines Signals an, das sich für den Indikator gelohnt hat! Die meisten Händler ver
TPSpro TRENDPRO  - is a trend indicator that automatically analyzes the market and provides information about the trend and each of its changes, as well as giving signals for entering trades without redrawing! The indicator uses each candle, analyzing them separately. referring to different impulses - up or down impulse. Exact entry points into transactions for currencies, crypto, metals, stocks, indices!  -  Version MT4                  DETAILED DESCRIPTION        /       TRADING SETUPS       
Bill Williams Advanced
Siarhei Vashchylka
5 (3)
Bill Williams Advanced is designed for automatic chart analysis using Bill Williams' "Profitunity" system. The indicator analyzes four timeframes at once. Manual (Be sure to read before purchasing) Advantages 1. Automatically analyzes the chart using the "Profitunity" system of Bill Williams. The found signals are placed in a table in the corner of the screen. 2. Equipped with a trend filter based on the Alligator indicator. Most of the system signals are recommended to be used only accordi
ICT, SMC, SMART MONEY CONCEPTS, SMART MONEY, Smart Money Concept, Support and Resistance, Trend Analysis, Price Action, Market Structure, Order Blocks, BOS/CHoCH,   Breaker Blocks ,  Momentum Shift,   Supply&Demand Zone/Order Blocks , Strong Imbalance,   HH/LL/HL/LH,    Fair Value Gap, FVG,  Premium  &   Discount   Zones, Fibonacci Retracement, OTE, Buy Side Liquidity, Sell Side Liquidity, BSL/SSL Taken, Equal Highs & Lows, MTF Dashboard, Multiple Time Frame, BigBar, HTF OB, HTF Market Structure
TrendMaestro5
Stefano Frisetti
note: this indicator is for METATRADER4, if you want the version for METATRADER5 this is the link:  https://www.mql5.com/it/market/product/108106 TRENDMAESTRO recognizes a new TREND in the bud, he never makes mistakes. The certainty of identifying a new TREND is priceless. DESCRIPTION TRENDMAESTRO identifies a new TREND in the bud, this indicator examines the volatility, volumes and momentum to identify the moment in which there is an explosion of one or more of these data and therefore the mome
Auto Order Block with break of structure based on ICT and Smart Money Concepts Futures Break of Structure ( BoS )             Order block ( OB )            Higher time frame Order block / Point of Interest ( POI )    shown on current chart           Fair value Gap ( FVG ) / Imbalance   ,  MTF      ( Multi Time Frame )    Volume Imbalance     ,  MTF          vIMB Gap’s Equal High / Low’s     ,  MTF             EQH / EQL Liquidity               Current Day High / Low           HOD /
TrendDecoder Premium MT5
Christophe, Pa Trouillas
5 (1)
Top bewertet auf anderem MarketPlace -  Jetzt verfügbar auf METATRADER Identifizieren Sie Bereiche und die nächsten wahrscheinlichen Bewegungen     |    Erhalten Sie früheste Signale und die Stärke von Trends     |    Klare Ausstiegssignale vor Umkehrung     |    Erkennen Sie die Fibo-Levels, die der Kurs testen wird    |  Indikator, der nicht zurückverfolgt, nicht verzögert - ideal für den manuellen und automatisierten Trading - geeignet für alle Vermögenswerte und Zeiteinheiten - 50% Rabatt  
XQ Indicator MetaTrader 5
Marzena Maria Szmit
5 (1)
Step into the realm of Forex trading with confidence and precision using XQ, a cutting-edge Forex indicator designed to elevate your trading game to unprecedented heights. Whether you're a seasoned trader or just stepping into the world of currency exchange, XQ Forex Indicator empowers you with the insights and signals needed to make informed trading decisions. The signal conditions are a combination of three indicators, and XQ Forex Indicator only display  medium and long-term trends . The ind
IX Power MT5
Daniel Stein
5 (1)
IX Power   bringt die unschlagbare Präzision von FX Power endlich auch zu Nicht-Forex-Symbolen. Es bestimmt präzise die Intensität von kurz-, mittel- und langfristigen Trends in Ihren Lieblingsindizes, Aktien, Rohstoffen, ETFs und sogar Kryptowährungen. Sie können   alles analysieren, was   Ihr Terminal zu bieten hat. Probieren Sie es aus und erleben Sie, wie   sich Ihr Timing   beim Handel   deutlich verbessert . IX Power Hauptmerkmale 100% präzise, nicht nachpinselnde Berechnungsergebni
The Volume by Price Indicator for MetaTrader 5 features Volume Profile and Market Profile TPO (Time Price Opportunity). Get valuable insights out of currencies, equities and commodities data. Gain an edge trading financial markets. Volume and TPO histogram bar and line charts. Volume Footprint charts. TPO letter and block marker charts including split structures. Versatile segmentation and compositing methods. Static, dynamic and flexible ranges with relative and/or absolute visualizations. Lay
Quantum Heiken Ashi PRO MT5
Bogdan Ion Puscasu
4.5 (8)
Wir stellen den   Quantum Heiken Ashi PRO   vor Die Heiken-Ashi-Kerzen wurden entwickelt, um klare Einblicke in Markttrends zu geben und sind bekannt für ihre Fähigkeit, Rauschen herauszufiltern und falsche Signale zu eliminieren. Verabschieden Sie sich von verwirrenden Preisschwankungen und begrüßen Sie eine glattere, zuverlässigere Diagrammdarstellung. Was den Quantum Heiken Ashi PRO wirklich einzigartig macht, ist seine innovative Formel, die traditionelle Candlestick-Daten in leicht lesbare
A key element in trading is zones or levels from which decisions to buy or sell a trading instrument are made. Despite attempts by major players to conceal their presence in the market, they inevitably leave traces. Our task was to learn how to identify these traces and interpret them correctly. Reversal First Impulse levels (RFI)   -  Version MT4                  INSTRUCTIONS                 RUS                 ENG                         R ecommended to use with an indicator   -  TREND PRO  
Was: $249  Now: $99   Market Profile defines a number of day types that can help the trader to determine market behaviour. A key feature is the Value Area, representing the range of price action where 70% of trading took place. Understanding the Value Area can give traders valuable insight into market direction and establish the higher odds trade. It is an excellent addition to any system you may be using. Inspired by Jim Dalton’s book “Mind Over Markets”, this indicator is designed to suit the
Golden Gate Algo MT5
James David Lane
4 (6)
40% RABATT ZU WEIHNACHTEN! PREISERHÖHUNG AUF $250 AM 1. JANUAR! Vorstellung von GoldenGate Entries: Eine hochmoderne Handelslösung! Entdecken Sie einen revolutionären Ansatz zum Handel mit GoldenGate Entries (GGE), einem fortschrittlichen Indikator, der entwickelt wurde, um Ihr Handelserlebnis zu verbessern. GGE bietet eine umfassende Palette von Funktionen, um Benutzer mit Präzision und Vertrauen in ihren Handelsentscheidungen auszustatten. Paare: Beliebig (FX - Rohstoffe - Aktien - Akti
Gartley Hunter Multi
Siarhei Vashchylka
5 (5)
Gartley Hunter Multi - An indicator for searching for harmonic patterns simultaneously on dozens of trading instruments and on all classic timeframes: (m1, m5, m15, m30, H1, H4, D1, Wk, Mn). Manual (Be sure to read before purchasing) | Version for MT4 Advantages 1. Patterns: Gartley, Butterfly, Shark, Crab. Bat, Alternate Bat, Deep Crab, Cypher 2. Simultaneous search for patterns on dozens of trading instruments and on all classic timeframes 3. Search for patterns of all possible sizes. Fr
PZ Swing Trading MT5
PZ TRADING SLU
5 (4)
Swing Trading ist der erste Indikator, der Schwankungen in Trendrichtung und mögliche Umkehrschwankungen erkennt. Es wird der in der Handelsliteratur weit verbreitete Baseline-Swing-Trading-Ansatz verwendet. Der Indikator untersucht mehrere Preis- und Zeitvektoren, um die aggregierte Trendrichtung zu verfolgen und erkennt Situationen, in denen der Markt überverkauft oder überkauft ist und zur Korrektur bereit ist. [ Installationsanleitung | Update-Anleitung | Fehlerbehebung | FAQ | Alle Produkte
Zunächst einmal ist es wichtig zu betonen, dass dieses Handelssystem ein Nicht-Repainting-, Nicht-Redrawing- und Nicht-Verzögerungsindikator ist, was es ideal für den professionellen Handel macht. Das "Smart Support and Resistance Trading System" ist ein fortschrittlicher Indikator, der für neue und erfahrene Trader entwickelt wurde. Es ermöglicht Tradern Präzision und Vertrauen auf dem Devisenmarkt. Dieses umfassende System kombiniert mehr als 7 Strategien, 10 Indikatoren und verschiedene Ha
Owl Smart Levels MT5
Sergey Ermolov
4.47 (36)
MT4-Version  |  FAQ Der Owl Smart Levels Indikator ist ein komplettes Handelssystem innerhalb eines Indikators, der so beliebte Marktanalysetools wie die fortschrittlichen Fraktale von Bill Williams , Valable ZigZag, das die richtige Wellenstruktur des Marktes aufbaut, und Fibonacci-Levels , die die genauen Einstiegslevels markieren, enthält in den Markt und Orte, um Gewinne mitzunehmen. Detaillierte Strategiebeschreibung Anleitung zur Verwendung des Indikators Berater-Assistent im Handel Owl H
Blahtech Supply Demand MT5
Blahtech Limited
4.57 (14)
Was: $299  Now: $99   Supply Demand uses previous price action to identify potential imbalances between buyers and sellers. The key is to identify the better odds zones, not just the untouched ones. Blahtech Supply Demand indicator delivers functionality previously unavailable on any trading platform. This 4-in-1 indicator not only highlights the higher probability zones using a multi-criteria strength engine, but also combines it with multi-timeframe trend analysis, previously confirmed swings
Weitere Produkte dieses Autors
The indicator identifies when a divergence occurs between price and an indicator or oscillator. It identifies both regular and hidden divergences. Combined with your own rules and techniques, this indicator will allow you to create (or enhance) your own powerful system. Features Can detect divergences for the following oscillators/indicators:   MACD, OsMA, Stochastics, RSI, CCI, RVI, Awesome, ADX, ATR, OBV, Composite index, MFI and Momentum. Only one oscillator/indicator can be selected. Draws
FREE
I recommend you to read the   product's blog  (manual) from start to end so that it is clear from the beginning what the indicactor offers. This multi time frame and multi symbol divergence dashboard indicator sends an alert when one or two different divergences have been identified. It can be used with all time frames from M1 to MN. Maximum 9 time frames can be shown in the dashboard at the same time. It is possible to enable moving average, RSI or Bollinger bands trend filter to filter out on
Dieser Indikator mit mehreren Zeitrahmen und mehreren Symbolen identifiziert doppelte Top/Boden-, Kopf- und Schulter-, Wimpel-/Dreiecks- und Flaggenmuster. Es ist auch möglich, Alarme nur dann einzurichten, wenn ein Nackenlinien-/Dreiecks-/Fahnenmast-Ausbruch aufgetreten ist (Nackenlinien-Ausbruch = bestätigtes Signal für Top/Bottoms und Head & Shoulders).       Der Indikator kann auch im Single-Chart-Modus verwendet werden. Bitte lesen Sie mehr über diese Option in den Produktinformationen    
Dieser Angebots- und Nachfragezonenindikator zeichnet die Zonen auf dem Chart und sendet Warnungen, wenn der Preis eine Zone erreicht oder durchbrochen hat. Es ist auch möglich, es zu verwenden, um über reguläre doppelte Tops/Bottoms anstelle von Zonen benachrichtigt zu werden. Es ist möglich, RSI-, Volumen- und Divergenzfilter zu verwenden, um nur die stärksten Setups herauszufiltern. In Kombination mit Ihren eigenen Regeln und Techniken ermöglicht Ihnen dieser Indikator, Ihr eigenes leistungss
I recommend you to read the   product's blog  (manual) from start to end so that it is clear from the beginning what the indicactor offers. This multi time frame and multi symbol trend indicator sends an alert when a strong trend or trend reversal has been identified. It can do so by selecting to build up the dashboard using Moving average (single or double (both MA:s aligned and price above/below both)), RSI, Bollinger bands, ADX, Composite index (Constance M. Brown), Awesome (Bill Williams), 
Dieser Multi-Time-Frame- und Multi-Symbol-Indikator kann die folgenden 5 Kreuze identifizieren: wenn ein sich schnell bewegender Durchschnitt eine Linie des langsamen gleitenden Durchschnitts kreuzt. wenn der Preis einen einzelnen gleitenden Durchschnitt erreicht hat (oben/unten geschlossen oder gerade abgesprungen). wenn eine Triple Moving Average Formation aufgetreten ist (alle 3 MA:s in aufeinanderfolgender Ausrichtung) wenn die MACD-Hauptlinie die Signallinie kreuzt. wenn die Signallinie die
I  recommend you to read the   product's blog  (manual) from start to end so that it is clear from the beginning what the indicator offers. This multi time frame and multi symbol indicator identifies double top/bottom, head & shoulders, pennant/triangle and flag patterns. It is also possible to setup alerts only when a neckline/triangle/flagpole breakout has occured (neckline breakout = confirmed signal for top/bottoms and head & shoulders).  The indicator can also be used in single chart mode.
I recommend you to read the   product's blog  (manual) from start to end so that it is clear from the beginning what the indicactor offers. This multi time frame and multi symbol supply and demand zone dashboard indicator sends alerts when the price has reached a supply/demand zone. It is also possible to use it to be alerted about regular double tops/bottoms instead of zones. It can be used with all time frames from M1 to MN. It is possible to use RSI, divergence (MACD, OsMA, RSI or Awesome) a
Please if possible consider the  paid version  which I will continue to develop (there will be no future updates for this free version). This Expert Advisor identifies when a divergence occurs between price and an oscillator/indicator. It identifies both regular/classical (trend reversal) and hidden (trend continuation) divergences. It has RSI, bollinger, stochastics, moving average and ADX filter options which makes it possible to filter out only the strongest setups. The default settings ar
FREE
Dieser Multisymbol- und Multi-Timeframe-Indikator kann nicht nur bullische und bärische Dreilinien-Strike-Formationen finden, sondern auch nach den folgenden Candlestick-Mustern suchen (siehe Screenshots zur Erklärung der Muster): Drei weiße Soldaten (Umkehrung>Fortsetzungsmuster) Drei schwarze Krähen (Umkehrung> Fortsetzungsmuster) Die Formationen erscheinen nicht sehr oft auf höheren Zeitrahmen, wenn die strikte Option in den Indikatoreinstellungen aktiviert ist. Aber wenn sie es tun, ist es e
This indicator can send alerts when a Heiken Ashi Smoothed color change occurs. Combined with your own rules and techniques, this indicator will allow you to create (or enhance) your own powerful system. Features Can send all types of alerts. Option to delay the alert one or more bars in order to confirm the color (trend) change. Input parameters Candle shift for alert: Default is 1. Setting it to 0 will alert you on color change on the current candle. This should be regarded as a pending (uncon
FREE
The indicator identifies when a divergence occurs between price and an indicator or oscillator. It identifies bullish and bearish hidden or regular (classical) divergences. Combined with your own rules and techniques, this indicator will allow you to create (or enhance) your own powerful system. Features Can detect divergences for the following indicators/oscillators: MACD, OsMA (Moving average of Oscillator), Stochastics, RSI, CCI, RVI, Awesome (AO), ADX, ATR, OBV, MFI, Momentum and   Composi
FREE
Averaging down EA
Jan Flodin
5 (1)
This cost averaging Expert advisor (EA) places additional trades in the same direction as the original (manually opened) order when the price goes against you. It can be used as a grid system or as pure martingale system (exponential increasing of lot size) or smoothed martingale (for instance linear increasing of the lot size). Due to the risk involved, this EA is more suitable for intermediate to advanced traders who are well aware of how to handle risk management and trading an already profit
Ich empfehle Ihnen, den   Blog (Handbuch) des Produkts   von Anfang bis Ende zu lesen, damit von Anfang an klar ist, was der EA bietet. Dieser Expert Advisor erkennt, wann eine Divergenz zwischen dem Preis und einem Oszillator/Indikator auftritt. Es identifiziert sowohl reguläre/klassische (Trendumkehr) als auch versteckte (Trendfortsetzung) Divergenzen. Es verfügt über Angebots-/Nachfragezone, RSI, Bollinger, Stochastik, gleitenden Durchschnitt (regulärer MA und Hull MA), ADX und Volumenfilter
Ich empfehle Ihnen, die zu lesen       Produkt-Blog   (Handbuch) von Anfang bis Ende damit       Es ist von Anfang an klar, was der EA bietet. Die Hauptstrategie dieses Expert Advisors (EA) besteht darin, Trades zu platzieren, wenn 3 gleitende Durchschnitte (MA) in aufeinanderfolgender Ausrichtung und in einem bestimmten Abstand voneinander sind (dies kann zum Beispiel für eine nicht sehr bekannte Strategie verwendet werden, die von einigen institutionellen Händlern verwendet wird , die die MAs
This indicator can send alerts when a Heiken Ashi Smoothed color change occurs. Combined with your own rules and techniques, this indicator will allow you to create (or enhance) your own powerful system. Features Can send all types of alerts. Option to delay the alert one bar in order to confirm the color (trend) change. Input parameters Wait for candle close: 'true' or 'false'. Setting it to 'true' will delay the alert to the opening of the bar following the bar where the color change occurred.
FREE
I recommend you to read the   product's blog  (manual) from start to end so that it is clear from the beginning what the indicactor offers. This multi time frame and multi symbol indicator identifies double or triple top/bottom formations or a following neckline breakout (confirmed top/bottom). It offers filters for RSI overbought/oversold, candle patterns (pin bar, engulfing, tweezer, morning/evening star, three line strike) and divergences (MACD, OsMA, Awesome (AO), RSI, CCI, Stochastic) whic
I recommend you to read the   product's blog  (manual) from start to end so that it is clear from the beginning what the indicactor offers. This multi time frame and multi symbol indicator identifies double or triple top/bottom formations or a following neckline breakout (confirmed top/bottom). It offers RSI, pin bar, engulfing, tweezer, morning/evening star filters as well divergence filter options which makes it possible to filter out only the strongest setups. The indicator can also be used
This indicator recognizes a special type of Inside Bar formation which is formed by a big Master candle followed by 4 smaller candles (please see the strategy explanation below). Features Plots buy/sell stop lines on the chart as well as well as take profit and stop loss levels. The TP/SL levels are based on the Average True Range (ATR) indicator. Object colors are changeable. Sends you a real-time alert when a Master candle formation is identified - sound / popup / email / push notification. On
I recommend you to read the   product's blog  (manual) from start to end so that it is clear from the beginning what the indicactor offers. This multi time frame and multi symbol divergence dashboard indicator sends an alert when one or two different divergences have been identified. It can be used with all time frames from M1 to MN. It is possible to enable moving average or RSI trend filter to filter out only the strongest setups. Combined with your own rules and techniques, this indicator wi
Features This is an indicator that recognizes a special type of Inside Bar formation which is formed by a Master candle followed by 4 smaller candles (please see the strategy explanation below). Plots buy/sell stop lines on the chart as well as well as take profit and stop loss levels. The TP/SL levels are based on the Average True Range (ATR) indicator. Object colors are changeable. Sends you a real-time alert when a Master candle formation is identified - sound / pop-up / email / push notifica
I recommend you to read the  product's blog  (manual) from start to end so that it is clear from the beginning what the indicator offers. This multi time frame and multi symbol supply and demand zone dashboard indicator sends alerts when the price has reached a supply/demand zone. It is also possible to use it to be alerted about regular double tops/bottoms instead of zones. It can be used with all time frames from M1 to MN. Maximum 9 time frames can be shown in the dashboard at the same time. 
Der Indikator identifiziert, wenn eine Divergenz zwischen dem Preis und einem Oszillator/Indikator auftritt. Es identifiziert sowohl reguläre als auch versteckte Abweichungen. Es verfügt über eine RSI-Filteroption, die es ermöglicht, nur die stärksten Setups herauszufiltern. Der Indikator bietet auch Optionen zum Warten auf eine Engulfing-Formation, den Ausbruch des Donchian-Kanals oder bis der Preis einen gleitenden Durchschnitt überschreitet   (siehe Screenshot Nr. 3).       um die Divergenz z
I recommend you to read the   product's blog  (manual) from start to end so that it is clear from the beginning what the indicactor offers. This multi time frame and multi symbol indicator can identify the following 5 crosses: when a fast moving average crosses a slow moving average line. when price has reached a single moving average (closed above/below or just bounced). when a triple moving average formation has appeared (all 3 MA:s in consecutive alignment). when the MACD main line crosses t
Bitte erwägen Sie nach Möglichkeit den Kauf       MT5-Version   , die ich weiter entwickeln werde (es wird keine zukünftigen Updates für diese MT4-Version geben). Ich empfehle Ihnen auch, die zu lesen       Produkt-Blog   (Handbuch) von Anfang bis Ende, damit von Anfang an klar ist, was EA bietet. Die Hauptstrategie dieses Expert Advisors (EA) besteht darin, Trades zu platzieren, wenn 3 gleitende Durchschnitte (MA) in aufeinanderfolgender Ausrichtung und in einem bestimmten Abstand voneinander
I recommend you to read the   product's blog  (manual) from start to end so that it is clear from the beginning what the indicactor offers. This indicator for Metatrader 4 identifies when a divergence occurs between price and an oscillator/indicator. It identifies both bullish and bearish divergences. It has a RSI filter option which makes it possible to filter out only the strongest setups. The indicator also offers options to wait for an Engulfing formation, Donchian channel breakout or for p
Dieser Multi-Time-Frame- und Multi-Symbol-Indikator scannt nach Pin-Bars, Morgen-/Abendsternen, Engulfings, Pinzetten, Drei-Linien-Strikes, Inside Bars und Wimpel und Dreiecken. Der Indikator kann auch im Single-Chart-Modus verwendet werden. Bitte lesen Sie mehr über diese Option im Produkt   Blogs   . In Kombination mit Ihren eigenen Regeln und Techniken ermöglicht Ihnen dieser Indikator, Ihr eigenes leistungsstarkes System zu erstellen (oder zu verbessern). Merkmale Kann alle in Ihrem Market
This multi time frame and multi symbol indicator identifies when the stochastics signal line (D) crosses the stochastics main line (K) as well as options  to scan for main line and signal line level crossovers.  As a bonus it can also scan for Bollinger bands and RSI overbought/oversold crosses. Combined with your own rules and techniques, this indicator will allow you to create (or enhance) your own powerful system. Features Can monitor all symbols visible in your Market Watch window at the sam
This multi indicator/oscillator (hereafter indicator), multi time frame and multi symbol indicator identifies when a divergence occurs between price and one, two or three indicators. It identifies both regular/classical (trend reversal) and hidden (trend continuation) divergences. It has RSI and MA trend filter options which makes it possible to filter out only the strongest setups. Combined with your own rules and techniques, this indicator will allow you to create (or enhance) your own powerfu
This multi time frame and multi symbol indicator identifies fractals patterns. As a bonus it can also scan for Parabolic SAR (pSAR) trend changes. Combined with your own rules and techniques, this indicator will allow you to create (or enhance) your own powerful system. Features Can monitor all symbols visible in your Market Watch window at the same time. Apply the indicator to just one chart and instantly monitor the entire market. Can monitor every time frame, from M1 to MN, and sends you a
Auswahl:
tunck
1164
tunck 2023.04.08 02:44 
 

SL/TP for patterns?

Jan Flodin
119087
Antwort vom Entwickler Jan Flodin 2023.04.08 13:45
Hello and many thanks for the review :-)
Engulfing, Tweezer and Three line strike:
The entry is typically at the high/low of the pattern. SL and risk level for trading can be placed at the swing high/low of the pattern. This makes it relatively easy for traders to target (TP) at least twice the distance of their stop loss, creating a 1:2 risk-to-reward ratio.
Pin bar:
Entry on break of pin bar high/low. SL at pin bar low/high. TP at previous swing point. For this purpose you can use Donchian channel (highest/lowest of last 20 bars). Please make sure that it will give at least R/R (risk/reward) of 1:2).
Inside bars and Pennants/triangles:
Will need to attach a document which is not possible here. I will send you a private message on MQL5 as soon as you have approved my Friends request (you have blocked sending private messages from non friends)
Kayhan
62
Kayhan 2021.09.07 16:25 
 

I was looking forward to seeing this kind of indicator. Thank you very much.

Delboyuk
81
Delboyuk 2020.12.29 18:22 
 

Der Benutzer hat keinen Kommentar hinterlassen

smmfx
80
smmfx 2020.11.05 16:07 
 

An amazing indicator that gives me very accurate signals based on my strategy. I thank Jan for answering my challenging questions before I buy it. The coding and details that saw looks very professional.

Thomas
85
Thomas 2019.07.10 11:22 
 

Perfect. Get really good Signals. Thx Jan again.

Devonish
2933
Devonish 2018.11.21 20:23 
 

I've just rented this for a month and initial impressions are good. Its quite likely I may go on to purchase as scanning all assets on all time frames is not practical. It will be used to support existing strategies. The only reason its not 5 star is having the candle/s highlighted on the chart would be nice, but I accept its not possible.

June 2019 Update: I purchased this product and have been using it for six months. It compliments my strategies very well. Upgraded to 5 stars.

Antwort auf eine Rezension
Version 2.1 2023.10.07
*** Please always make a backup of the existing indicator (the .ex5 file) before you make an update ***

Change log:
- bug fix for the panel which in some cases got minimized
- added an option to write the signals as global variables instead of to a file (to be used by an EA)
- added the possibility to set the colors in the panel
- added drawing of a rectangle to highlight Engulfings, Tweezers, Stars and Three line strikes
Version 2.0 2022.10.25
*** Please always make a backup of the existing indicator (the .ex5 file) before you make an update ***

- added an option to the engulfing scanning to set minimum amount of candles that must be engulfed. In this way it will be possible to scan for so called Outside bars.
Version 1.9 2021.12.15
- bug fix in the single chart function
Version 1.8 2021.12.08
*** Please always make a backup of the existing indicator (the .ex5 file) before you make an update ***

- added a possibility to use the indicator in single chart mode (checking only one symbol and time frame). It will then draw the patterns on the chart where the indicator is running. This option is in some ways limited though. More information in the product's blog.
- added the possibility to be alerted only when there has been a breakout from the Inside bars formation
- added the drawing of arrows for pin bar, engulfing, tweezer, star and three line strike patterns when the chart is opened from the panel
- added the possibility to add a custom text to the pop-up, push and mail alerts
- added the possibility to set a custom panel title
- added the engulfing option Size candle B engulfs body candle A
- added the possibility to use RSI trend filter in combinaton with Bollinger bands. Both must be on overbought/oversold area
Version 1.7 2019.11.20
- added the possibility to write the signals in the panel to a file. Could for instance be used by an Expert Advisor for automatical trading. For instance this product: https://www.mql5.com/en/market/product/43820
Version 1.6 2019.09.17
- added drawing of Tweezer and Three Line Strike formations in the strategy tester
- added moving average trend filter
- added ADX volality filter
Version 1.5 2019.08.13
- added scanning for Three Line Strike formations
Version 1.4 2019.07.15
- corrected bug fix for the change in version 1.3
Version 1.3 2019.07.15
- added the possibility to set a fixed time frame for the trend filter.
Version 1.2 2019.07.10
- added the possibility to ignore wicks on the inside bars candles
- added the possibility to set minimum and/or maximum candle size for the master (first) bar in a inside bars formation
- lines will now be drawn on Inside bars and Pennant/Triangles formations when opening a chart from the panel
- added a parameter for the line color of the line drawings mentioned above
Version 1.1 2019.06.20
- it is now possible to enable Tweezer separately without also having Engulfing enabled
- added the possibility to set the panel width
- added an option to use symbols from the Market Watch window
- added an additional average candle size filter for pin bars
- added an addiotinal midpoint filter for pin bars