Color Candle Volume Set
- Indikatoren
-
Ricardo Almeida Branco
 Ich habe 2018 begonnen, der brasilianischen Börse in einem Demo-Konto zu folgen, und fand die Anzahl der verwendeten Setups interessant. Ich nahm das Lernen und sogar die Demo ernst und verstand, dass ich mit der Programmierung beginnen sollte, um Setups zu validieren / zu verwerfen.
 - Version: 2.10
- Aktualisiert: 14 September 2022
- Aktivierungen: 5
Verwenden Sie das Volumen bei Ihrer Marktbeobachtung?
Sicherlich verwenden es viele Händler und können sich nicht vorstellen, ohne es zu arbeiten.
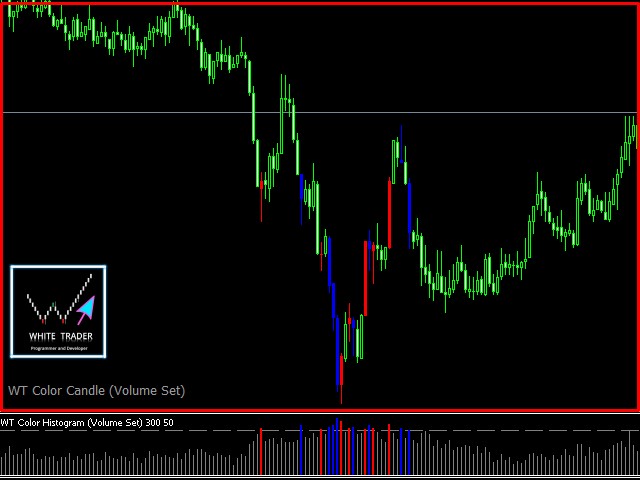
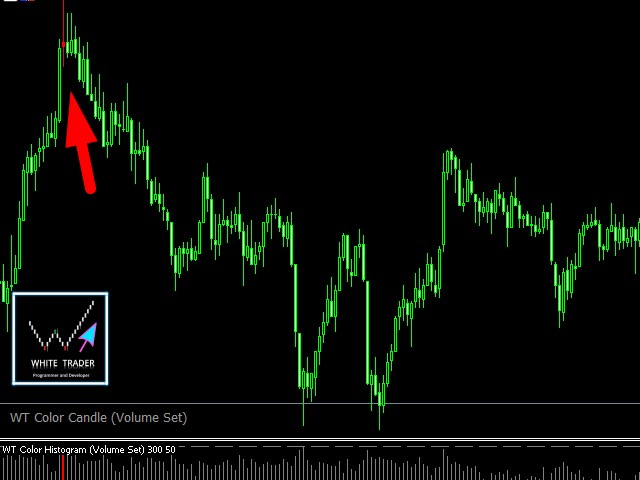
Der Indikator Color Candle Volume Set ermöglicht es dem Benutzer, den Wert zu wählen, den er für interessant hält, um ihn zu beobachten.
Wenn Sie diesen Wert überschreiten, haben Sie eine visuelle Bestätigung auf dem Preisdiagramm und, wenn Sie möchten, auch einen akustischen Alarm, der vom Indikator ausgegeben wird.
Natürlich gibt es auch andere Möglichkeiten, ein hohes Volumen zu finden, wie z.B. die Bewertung, ob das Volumen über dem Durchschnitt liegt, ob es das höchste Volumen der letzten x Kerzen ist (ich habe sogar Indikatoren wie diesen), unter anderem, aber der Vorschlag des Color Candles Volume Set Indikators ist es, dem Benutzer zu erlauben, durch seine Beobachtung und Erfahrung, die Werte zu definieren.
Darüber hinaus hat dieser Indikator eine kostenlose Kerzenfärbung Version, die in meinen Indikatoren auf dem Markt gefunden werden kann.
Es ist.
Erfolg und gute Geschäfte!
Sicherlich verwenden es viele Händler und können sich nicht vorstellen, ohne es zu arbeiten.
Der Indikator Color Candle Volume Set ermöglicht es dem Benutzer, den Wert zu wählen, den er für interessant hält, um ihn zu beobachten.
Wenn Sie diesen Wert überschreiten, haben Sie eine visuelle Bestätigung auf dem Preisdiagramm und, wenn Sie möchten, auch einen akustischen Alarm, der vom Indikator ausgegeben wird.
Natürlich gibt es auch andere Möglichkeiten, ein hohes Volumen zu finden, wie z.B. die Bewertung, ob das Volumen über dem Durchschnitt liegt, ob es das höchste Volumen der letzten x Kerzen ist (ich habe sogar Indikatoren wie diesen), unter anderem, aber der Vorschlag des Color Candles Volume Set Indikators ist es, dem Benutzer zu erlauben, durch seine Beobachtung und Erfahrung, die Werte zu definieren.
Darüber hinaus hat dieser Indikator eine kostenlose Kerzenfärbung Version, die in meinen Indikatoren auf dem Markt gefunden werden kann.
Es ist.
Erfolg und gute Geschäfte!
Der Benutzer hat keinen Kommentar hinterlassen