Color Candle Volume Set

  • インディケータ
  • Ricardo Almeida Branco
    Ricardo Almeida Branco
    2018年にデモ口座でブラジル証券取引所をフォローし始めましたが、使用されたセットアップの量が興味深いと感じました。 学習とデモさえ真剣に受け止めて、セットアップを検証/破棄するためにプログラミングを開始する必要があることを理解しました。
    私はトレーニングと職業の数学者であり、プログラミングの知識を持っていたので、mql5でコツをつかみました(もちろん、私はまだ学んでいます)。そして、トレーダーのグループの何人かの友人のために指標を開発または適応し始めました。最初のセットアップと独自のインジケーターを開発するまで、私は参加しました。
  • バージョン: 2.10
  • アップデート済み: 14 9月 2022
  • アクティベーション: 5
Do you use volume in your reading of the market?


Certainly many traders use it, and do not imagine operating without it.


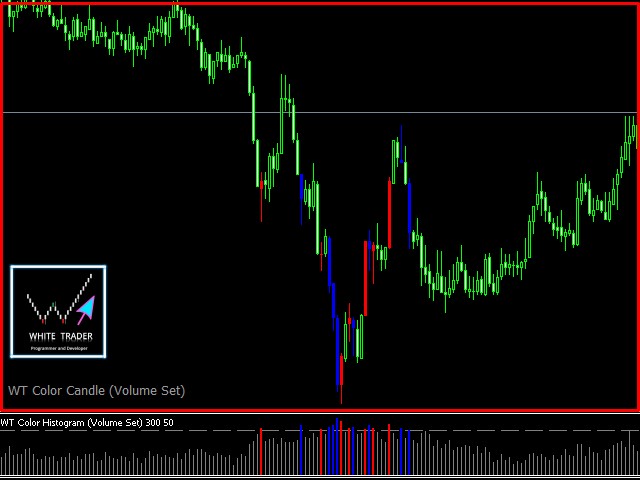
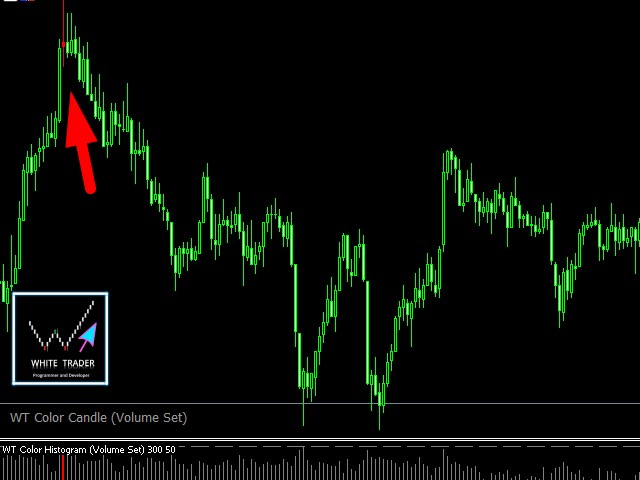
The Color Candle Volume Set indicator allows the user to choose the value that he considers interesting to monitor.

When you pass this you will have visual confirmation on the price chart and if you want you will also have the audible alert that is given by the indicator.


Of course, there are other ways to try to find a high volume, such as assessing whether the volume is above average, whether it is the highest volume of the last x candles (I even have indicators like that), among others, but the proposal of the Color Candles Volume Set indicator is to allow the user, through his observation and experience, to define the values.


In addition, this indicator has a free candle coloring version that can be found in my indicators available on the market.


It is.


Success and good trades!
おすすめのプロダクト
Price Magnet — Price Density and Attraction Levels Indicator Price Magnet is a professional analytical tool designed to identify key support and resistance levels based on statistical Price Density. The indicator analyzes a specified historical period and detects price levels where the market spent the most time. These zones act as “magnets,” attracting price action or forming a structural base for potential reversals. Unlike traditional Volume Profile tools, Price Magnet focuses on price-time d
Order Book, known also as Market Book, market depth, Level 2, - is a dynamically updated table with current volumes of orders to buy and to sell specific financial instument at price levels near Bid and Ask. MetaTrader 5 provides the means for receiving market book from your broker, but in real time only, without access to its history. The indicator OrderBook Cumulative Indicator accumulates market book data online and visualizes them on the chart. In addition, the indicator can show the market
This is Gekko's Cutomized Cutomized Average Directional Index (ADX), a customized version of the famous ADX indicator. Use the regular ADX and take advantage two entry signals calculations and different ways of being alerted whenever there is potential entry or exit point. Inputs Period: Period for the ADX calculation; PlotSignalType: How will the indicator calculate entry (swing) signals: 1- ShowSwingsOnTrendLevel : Show Signals for Trend Confirmation Swings; 2- ShowSwingsOnTrendLevelDirection
Best SAR MT5
Ashkan Hazegh Nikrou
4.33 (3)
説明 :  外国為替市場(PSAR)で専門的で人気のあるインジケーターの1つに基づいた新しい無料インジケーターをご紹介します。このインジケーターは元のパラボリックSARインジケーターの新しい変更です。プロSARインジケーターでは、ドットと価格チャートのクロスオーバーを見ることができます。クロスオーバーはシグナルではありませんが、動きの終わりの可能性について話します。新しい青いドットで購入を開始し、最初の青いドットの1 atr前にストップロスを配置し、最後にドットが価格チャートを横切るとすぐに終了できます。 売買シグナルを開く方法は? 最初の青い点によるオープンバイトレードと最初の赤いドットによるオープンセルトレード 正しいストップロスはどこにありますか? 安全なストップロスは最初のドットにある可能性があります(最初の青いドットの買いの場合と最初の赤い点の売りの場合) 正しいテイクプロフィットはどこにありますか? テイクプロフィットはストップロス距離とRRに基づいて調整できるので、私の提案は2 RRで、ストップロスの2倍です。 利益を上げているのにtpを達成できなかった場合
FREE
概要 このインジケーターは、クラシックな ドンチャンチャネル を強化したバージョンで、実践的なトレード機能を追加しています。 標準の3本線(上限、下限、中央線)に加え、 ブレイクアウト を検出し、チャート上に矢印で視覚的に表示します。また、チャートを見やすくするために、 現在のトレンド方向と逆側のラインのみを表示 します。 インジケーターの機能: 視覚的シグナル :ブレイクアウト時にカラフルな矢印を表示 自動通知 :ポップアップ、プッシュ通知、Eメール RSIフィルター :市場の相対的な強弱に基づいてシグナルを検証 カスタマイズ可能 :色、ラインの太さ、矢印コード、RSI閾値など 動作原理 ドンチャンチャネルは次のように計算します: 上限線 :直近N本のクローズ済みローソク足の最高値 下限線 :直近N本のクローズ済みローソク足の最安値 中央線 :最高値と最安値の平均値 上方ブレイクアウト は終値が上限線を超えたときに発生し、 下方ブレイクアウト は終値が下限線を下回ったときに発生します。 インジケーターは以下を行います: 3本のドンチャンラインを描画 方向転換後の最初のブレイクアウト
FREE
Donchian Channel DC is the indicator of Donchian Channels, that plots maximum and minimum values of a specific period, besides mean value line. It´s possible to configure simple period for analysis and the indicator will plot all three values. You can trade with this indicator as trend or reversal, according to each strategy. Do not let to test others indicators as soon as others expert advisors.
Caicai L&S Yield Histogram Important Notice: This indicator is an integral tool of the automated EA Caicai Long and Short Pair Trading . This indicator visually displays the percentage deviation (Yield %) of a pair's current spread relative to its own historical mean. It is an excellent tool for quickly visualizing the gross financial potential of a market distortion in Long & Short operations. Main Features: Percentage Visualization: Understand the size of the distortion in palpable percentage
平均方向性指数(ADX)マルチカレンシースキャナー MT5 は、複数の通貨ペアを同時に分析するために設計された高度なトレーディングインジケーターです。これは、平均方向性指数に基づくリアルタイムのシグナルを提供することで、意思決定プロセスを強化したいトレーダーに利益をもたらし、効率的な市場トレンド分析を可能にします。 このツールは、トレンドの強さと方向の動きを簡単に特定できるようにし、ADXに基づく戦略を採用するトレーダーにとって不可欠な資産となっています。リアルタイムのアラートとユーザーフレンドリーなダッシュボードを備え、トレーダーは市場の状況を迅速に評価し、情報に基づいた取引選択を行うことができます。 MQL製品のインストールガイド | MT4/MT5で購入したMQL製品の更新 | 一般的なトラブルシューティングガイド | インジケーター設定 / ガイド 主な機能 バッファ統合: インジケーターの値をアクセス可能なバッファとして公開し、Expert Advisorが自動取引のためにシグナルデータを利用できるようにします。 視覚的矢印シグナル: シグナルキャンドルのチャート上に明確なB
CosmiCLab SMC FIBO CosmiCLab SMC FIBO is a professional trading indicator designed for traders who use Smart Money Concepts (SMC), market structure analysis and Fibonacci retracement levels. The indicator automatically detects market swings and builds Fibonacci levels based on the latest impulse movement. It also identifies market structure changes such as BOS (Break of Structure) and CHOCH (Change of Character), helping traders understand the current market direction. CosmiCLab SMC FIBO also pr
High Low Open Close
Alexandre Borela
4.98 (44)
このプロジェクトが好きなら、5つ星レビューを残してください。 このインジケータは、指定されたためのオープン、ハイ、ロー、クローズ価格を描画します 特定のタイムゾーンの期間と調整が可能です。 これらは、多くの機関や専門家によって見られた重要なレベルです トレーダーは、彼らがより多くのかもしれない場所を知るために有用であり、 アクティブ。 利用可能な期間は次のとおりです。 前の日。 前週。 前の月。 前の四半期。 前年。 または: 現在の日。 現在の週。 現在の月。 現在の四半期。 現年。
FREE
RBreaker Gold Indicatorsは、金先物の短期日内取引戦略であり、トレンドフォローと日内反転の2つの取引手法を組み合わせたものです。トレンド相場での利益を捉えるだけでなく、相場が反転した際には迅速に利確し、その流れに沿ってポジションを反転させることができます。 この戦略は、アメリカの雑誌『Futures Truth』において、15年連続で最も収益性の高い取引戦略トップ10に選ばれた実績を持ち、非常に長いライフサイクルを誇り、現在も国内外で広く使用・研究されています。 本インディケーターは、2026年の金先物の値動きに対応し、14日間のATR指標に基づいて、ブレイクアウト係数A、観察係数B、リバーサル係数Rをより合理的な値で定義しています。非常に優れたインディケーターであり、安定的な年間収益を実現しています。ぜひおすすめします〜
FlatBreakout MT5 (Free Version) Flat Range Detector and Breakout Panel for MT5 — GBPUSD Only FlatBreakout MT5   is the free version of the professional FlatBreakoutPro MT5 indicator, specially designed for flat (range) detection and breakout signals on the   GBPUSD   pair only. Perfect for traders who want to experience the unique fractal logic of FlatBreakout MT5 and test breakout signals on a live market without limitations. Who Is This Product For? For traders who prefer to trade breakout of
FREE
Follow The Line MT5
Oliver Gideon Amofa Appiah
4.6 (35)
This indicator obeys the popular maxim that: "THE TREND IS YOUR FRIEND" It paints a GREEN line for BUY and also paints a RED line for SELL. (you can change the colors). It gives alarms and alerts of all kinds. IT DOES NOT REPAINT and can be used for all currency pairs and timeframes. Yes, as easy and simple as that. Even a newbie can use it to make great and reliable trades. NB: For best results, get my other premium indicators for more powerful and reliable signals. Get them here: https://www.m
FREE
Girassol Sunflower MT5 Indicator
Saullo De Oliveira Pacheco
3.86 (7)
This is the famous Sunflower indicator for Metatrader5. This indicator marks possible tops and bottoms on price charts. The indicator identifies tops and bottoms in the asset's price history, keep in mind that the current sunflower of the last candle repaints, as it is not possible to identify a top until the market reverses and it is also not possible to identify a bottom without the market stop falling and start rising. If you are looking for a professional programmer for Metatrader5, please
FREE
「調整可能なフラクタル」はフラクタル インジケーターの高度なバージョンで、非常に便利なトレーディング ツールです。 - ご存知のとおり、標準フラクタル MT5  インジケーターには設定がまったくありません。これはトレーダーにとって非常に不便です。 - 調整可能なフラクタルは、この問題を解決しました。必要な設定がすべて揃っています。 - インジケーターの調整可能な期間 (推奨値 - 7 以上)。 - 価格の高値/安値からの距離を調整可能。 - フラクタル矢印のデザインを調整可能。 - インジケーターにはモバイルおよび PC アラートが組み込まれています。 高品質のトレーディングロボットとインジケーターをご覧になるにはここをクリックしてください! これは、この MQL5 Web サイトでのみ提供されるオリジナル製品です。
This indicator can be considered as a trading system. It offers a different view to see the currency pair: full timeless indicator, can be used for manual trading or for automatized trading with some expert advisor. When the price reaches a threshold a new block is created according to the set mode. The indicator beside the Renko bars, shows also 3 moving averages. Features renko mode median renko custom median renko 3 moving averages wicks datetime indicator for each block custom notification
The Mirror Chart MT5 is a overlay indicator specifically designed to project a second financial instrument directly onto the main chart window. This tool is invaluable for traders who rely on correlation analysis, as it visualizes the price movements of two different instruments in real time. Unlike traditional overlays, this indicator utilizes intelligent, dynamic centering and scaling logic. It continuously analyzes the visible price range in the current window for both symbols and calculates
FREE
Value Chart Candlesticks
Flavio Javier Jarabeck
4.57 (14)
The idea of a Value Chart indicator was presented in the very good book I read back in 2020 , " Dynamic Trading Indicators: Winning with Value Charts and Price Action Profile ", from the authors Mark Helweg and David Stendahl. The idea is simple and the result is pure genius: Present candlestick Price analysis in a detrended way! HOW TO READ THIS INDICATOR Look for Overbought and Oversold levels. Of course, you will need to test the settings a lot to find the "correct" one for your approach. It
FREE
The Penta-O is a 6-point retracement harmonacci pattern which usually precedes big market movements. Penta-O patterns can expand and repaint quite a bit. To make things easier this indicator implements a twist: it waits for a donchian breakout in the right direction before signaling the trade. The end result is an otherwise repainting indicator with a very reliable trading signal. The donchian breakout period is entered as an input. [ Installation Guide | Update Guide | Troubleshooting | FAQ | A
FREE
The one minute chart has a bug, but the one-day chart can still be used after deleting the bug and reloading the indicators, This indicator can be used to determine how far the indicator goes up to place an order to buy, how far it goes down to place an order to sell, and not placing an order until it reaches this distance, which is considered oscillation, open an account gift index
FREE
Auto Optimized RSI   は、正確な売買シグナルを提供するために設計された、使いやすいスマートな矢印インジケーターです。過去のデータを使ったトレードシミュレーションに基づき、各通貨ペアや時間足に最適なRSIの買い/売りレベルを自動で見つけ出します。 このインジケーターは、独立したトレードシステムとしても、既存の戦略の一部としても使用できます。特に短期トレーダーにとって便利なツールです。 従来のRSI(70/30など)の固定レベルとは異なり、 Auto Optimized RSI   はリアルな価格の動きとバックテスト結果に基づき、ダイナミックにレベルを調整します。勝率、ドローダウン、平均利益/損失といった重要な統計をモニターし、現在の市場に適応して、本当に機能するシグナルを提供します。 RSIが最適化されたレベルをクロスすると、チャート上に買い・売りの矢印が表示され、成功率の高いエントリーポイントを見つけるのに役立ちます。 ご購入後にご連絡いただければ、追加のツールや特別なトレードのヒントを無料でお渡しいたします! 皆様のトレードが成功しますように!
True Day
Aurthur Musendame
5 (1)
True Days is a tool designed specifically for the trader who wants to catch intraday volatility in price charts.  True day makes it easier for the trader to avoid trading in the dead zone - a period in time where markets are considered dead or non volatile. The trader can concentrate on finding opportunities only during periods of profound market movements. By default the indicator gives you a true day starting at 02:00 to 19:00 hours GMT+2. You can adjust according to your Time Zone. By deafult
FREE
A machine translation from English product description was used. We apologies for possible imprecisions. 英語の製品説明からの機械翻訳が使用されました。   不正確な可能性があることをお詫び申し上げます。 お気に入りのろうそく足の価格アクションパターンの視覚化システム。 アタッチされると、インジケーターはチャート上の次のパターンを自動的にマークします。 ピノキオバー - 長い「鼻」を持つ小さなボディのバー、非常によく知られている逆のパターン。 内側のバー - 範囲が前のバーの範囲内にあるバー。   それは市場の不確実性を表しています。 外側のバー - 範囲が前のバーの範囲を超えるバー。   それは市場の不確実性を表しています。 レールパターン - ほぼ等しく、より大きなボディを持つ 2 つの結果として生じる反対側のバー。   逆のパターン。これは、より高い時間枠のピノキオバーパターンと実際に一致します。 マスターキャンドル パターン - キャンドルの 5 つ、後続の 4 つのキャンド
Candle Countdown — MT5用 正確なローソク足カウントダウン Candle Countdown は、 現在のローソク足が閉じるまでの残り時間 をチャート上に表示するシンプルで正確なツールです。 エントリーがローソク足のクローズに依存する場合、数秒の違いが重要になります。 このインジケーターは正確な時間を表示し、焦らずに判断できるようサポートします。 ローソク足のクローズ時間を正確に把握するためのインジケーターです。 表示内容: ローソク足が閉じるまでの残り時間 サーバー現在時刻 スプレッド ストップレベル(Stop Level) タイマーはティックに依存せず、プラットフォームの内部タイマーによって更新されるため、市場の動きが少ない場合でも安定した表示を維持します。 これにより、低ボラティリティの環境でも滑らかで安定したカウントダウンを実現します。 情報は背景付きのブロック内に表示されるため、どのチャートカラーでも見やすく、分析の妨げになりません。 ローソク足のクローズが近づくと、タイマーの色が変化し、視覚的に状況を把握しやすくなります。 MT4版はこちら: Cand
FREE
Tops & Bottoms Indicator FREE   Tops abd Bottoms:   An effective indicator for your trades The tops and bottoms indicator helps you to find  ascending and descending channel formations with indications of ascending and/or descending tops and bottoms. In addition, it  show possibles  opportunities with a small yellow circle when the indicator encounters an impulse formation. This indicator provide to you  more security and speed in making entry decisions. Also test our FREE advisor indicator:  
FREE
Long&Short Cointegration Analyzer An advanced tool for traders looking to profit from cointegration. Analyzes any asset pair for Long&Short strategies. What does the Long&Short Cointegration Analyzer do? Identifies cointegrated pairs that revert to the mean, ideal for profitable trades. Provides a detailed panel with statistical data for confident decisions. Works with any currency pair, on any timeframe. Find buying and selling opportunities based on cointegration. Minimize risks with a relia
This indicator uses the metaquotes ZigZag indicator as base to plot fibonacci extension and fibonacci retracement based in the Elliot waves. A fibonacci retracement will be plotted on every wave draw by the ZigZag. A fibonacci extension will be plotted only after the 2nd wave. Both fibonacci will be updated over the same wave tendency. Supporting until 9 consecutive elliot waves. Parameters: Depth: How much the algorithm will iterate to find the lowest and highest candles Deviation: Amount of
インディケータは現在のクオートを作成し、これを過去のものと比較して、これに基づいて価格変動予測を行います。インジケータには、目的の日付にすばやく移動するためのテキスト フィールドがあります。 オプション: シンボル - インジケーターが表示するシンボルの選択; SymbolPeriod - 指標がデータを取る期間の選択; IndicatorColor - インジケータの色; HorisontalShift - 指定されたバー数だけインディケータによって描画されたクオートのシフト; Inverse - true は引用符を逆にします。false - 元のビュー。 ChartVerticalShiftStep - チャートを垂直方向にシフトします (キーボードの上下矢印)。 次は日付を入力できるテキストフィールドの設定で、「Enter」を押すとすぐにジャンプできます。
About the indicator: DALA Forecast is a universal tool for predicting the dynamics of time series of any nature. For prediction, modified methods of nonlinear dynamics analysis are used, on the basis of which a predictive model is built using machine learning methods.  To get the trial version of the indicator, you can contact me in private messages. How to use the indicator: Apply the indicator to your chosen financial instrument or indicator with the settings you need. The prediction will be
FREE
このプロダクトを購入した人は以下も購入しています
Neuro Poseidon is a new indicator by Daria Rezueva. It combines precise trading signals with adaptive TP/SL levels - creating best possible trades as a result! Message me and get  Neuro Poseidon Assistant  as a gift to automize your trading process! What makes it stand out? 1. Proven profitability on all assets and timeframes 2. Only confirmed BUY and SELL signals present on the chart 3. Adaptive TP & SL levels generated by the software for each trade 4. Easy to understand - suitable for al
SuperScalp Pro
Van Minh Nguyen
4.65 (26)
SuperScalp Pro – 高度なマルチフィルタースキャルピングインジケーターシステム SuperScalp Pro は、クラシックな Supertrend と複数のインテリジェント確認フィルターを組み合わせた高度なスキャルピングインジケーターです。M1 から H4 まで複数の時間足で効率的に動作し、XAUUSD、BTCUSD、主要 Forex 通貨ペア向けに最適化されています。 このインジケーターは明確な Buy / Sell シグナルを提供し、ATR に基づいてエントリー価格、Stop Loss、Take Profit を自動計算します。Fibonacci Take Profit 機能により、重要な価格帯で早期決済し、到達時に通知を送信します。 初期設定では Fibonacci Take Profit が有効化されており、より安定した取引体験を重視しています。チャートに適用するだけですぐ利用可能です。上級者向けに、すべてのパラメータは自由にカスタマイズできます。 完全なドキュメントは製品ブログにあります: [User Guide] SuperScalp Pro Auto T
まず正直に言いましょう。 どんなインジケーターも、それ単体であなたを利益化させることはできません。もしそう言う人がいるなら、それは夢を売っているだけです。完璧な売買シグナル(矢印)を表示するインジケーターは、いくらでも“完璧に見せる”ことができます。正しい過去の区間を拡大して、勝ちトレードだけを切り取ればいいだけです。私たちはそれをしません。 SMC Intraday Formula はツールです。 市場構造を読み取り、最も高い確率の価格ゾーンを特定し、今この瞬間のスマートマネーの痕跡をシンプルな言葉で正確に示します。最終判断はあなたが行います。トレードを実行するのもあなたです。しかし今は「希望」ではなく「精度」でエントリーできます。 私たちはこのインジケーターを、ゴールド(XAUUSD)および主要FX通貨ペアで約3年間、日々のスキャルピングに使用してきました。M1、M5、M15、M30の主要ツールです。これは未来を予測しようとするのではなく、今まさに形成されている高確率セットアップを示し、その理由を説明します。 他のすべてのインジケーターと何が違うのか? ほとんどのトレーディングイ
Entry In The Zone and SMC Multi Timeframe is a real-time 2-in-1 market analysis tool that combines market structure analysis and a No Repaint BUY / SELL signal system into a single indicator, built on Smart Money Concepts (SMC) — a widely adopted framework used by professional traders to understand market structure. This indicator helps you see the market more clearly, make decisions based on structure rather than guesswork, and focus on high-probability zones where price is more likely to react
このインジケーターを購入された方には、以下の特典を 無料 で提供しています: 各トレードを自動で管理し、ストップロスとテイクプロフィットを設定し、戦略ルールに基づいてポジションを決済する補助ツール 「Bomber Utility」 様々な銘柄に合わせたインジケーターの設定ファイル(セットファイル) 「最小リスク」、「バランスリスク」、「待機戦略」 の3つのモードで使用できる Bomber Utility 用の設定ファイル このトレーディング戦略をすぐに導入・設定・開始できる ステップバイステップのビデオマニュアル ご注意: 上記の特典を受け取るには、MQL5のプライベートメッセージシステムを通じて販売者にご連絡ください。 オリジナルのカスタムインジケーター 「Divergence Bomber(ダイバージェンス・ボンバー)」 をご紹介します。これは、MACDのダイバージェンス(乖離)戦略に基づいた 「オールインワン」型のトレーディングシステム です。 このテクニカルインジケーターの主な目的は、価格とMACDインジケーターの間に発生するダイバージェンスを検出 し、将来の価格の動きを示す
Quantum TrendPulse を ご紹介します。これは、   SuperTrend   、   RSI   、および Stochastic のパワーを 1 つの包括的なインジケーターに組み合わせて、取引の可能性を最大限に引き出す究極の取引ツールです。精度と効率を求めるトレーダー向けに設計されたこのインジケーターは、市場のトレンド、勢いの変化、最適なエントリー ポイントとエグジット ポイントを自信を持って特定するのに役立ちます。 主な特徴: SuperTrend 統合: 現在の市場動向に簡単に追従し、収益性の波に乗ることができます。 RSI精度: 買われすぎと売られすぎのレベルを検出し、市場の反転のタイミングに最適で、SuperTrendのフィルターとして使用されます。 確率的精度: 確率的振動を活用して、変動の激しい市場で隠れたチャンスを見つけます。SuperTrend のフィルターとして使用されます。 マルチタイムフレーム分析:   M5 から H1 または H4 まで、さまざまなタイムフレームで市場を常に把握します。 カスタマイズ可能なアラート: カスタム取引条件が満たされ
この製品は 2026 年の市場向けに更新され、最新の MT5 ビルドに最適化されています。 価格更新のお知らせ: Smart Trend Trading System は現在 $99 で提供されています。 次の 30 件の購入 後、価格は $199 に上がります。 特別オファー: Smart Trend Trading System を購入後、私にプライベートメッセージを送ることで、 Smart Universal EA を無料 で受け取り、Smart Trend のシグナルを自動売買に変えることができます。 Smart Trend Trading System は、リペイントなし、再描画なし、遅延なしの完全なトレーディングシステムです。よりクリーンなシグナル、より明確なトレンド方向、そしてより整理された取引方法を求めるトレーダー向けに作られています。 Online course , manual and download presets . このシステムは、トレンド検出、反転ゾーン、Smart Cloud、トレーリングストップロジック、サポートとレジスタンス、ローソク足の色分け、ア
SignalTech is an unique fully rule based trading system delivers an Institutional approach for both Independent Traders and Prop Firm Challengers. Never Repaint. Push Notification available. No over-optimization. All the winning trades with chart setups are published on the comments page. 2026-05 4107 Pips (Until 05-29 NY Closed) 2026-04 2243 Pips 2026-03 2165 Pips 2026-02 2937 Pips 2026-01 2624 Pips 2025-12 1174 Pips It can generate signals with Buy/Sell Arrows, Push Notification (To Mobile) an
Power Candles V3 - 自己最適化型強弱インジケーター Power Candles V3は 、通貨や銘柄の強さを、適用されたすべてのチャート上で実行可能なトレードプランに変換します。単にローソク足を色分けするだけでなく、バックグラウンドでリアルタイムの自動最適化を実行し、目の前の銘柄に対して最適なストップロス、テイクプロフィット、およびシグナルの閾値を提示します。ワンクリックで実取引に適用でき、エントリーポイント、ストップロス、テイクプロフィットのラインが正確な価格位置にチャート上に表示され、方向性を示すアラートがリアルタイムで発動します。 このツールは、Stein Investmentsのエコシステムの一部です。  18種類以上のツールをすべて閲覧し、AIを活用したセットアップの推奨事項を入手し、  https://stein.investments でコミュニティに参加しましょう クローズしたバーごとに3,000回以上のトレードシミュレーション。9つの強さの状態。2つの戦略を並行してテスト。勝率の高い設定をワンクリックで適用。 なぜこれが必要なのか ほとんどの強
PrimeScalping is a powerful trading companion designed to generate high-probability entry signals with dynamic TP/SL/DP levels based on volatility. Built-in performance tracking shows win/loss stats, PP1/PP2 hits, and success rates — all updated live. Key Features: Buy/Sell signals with adaptive volatility bands Real-time TP/SL/DP levels based on ATR Built-in MA Filter with optional ATR/StdDev volatility Performance stats panel (Success, Profit/Loss, PP1/PP2) Alerts via popup, sound, push, or e
M1 Quantum は、M1専用のプロフェッショナルトレーディングシステムであり、ストップロス、テイクプロフィット、スマートな資金管理を内蔵した、迅速かつ正確な取引シグナルを提供します。 M1 Quantum は、 連続勝利 に重点を置いて口座を素早く成長させるために設計されたプロフェッショナルな資金管理を備えています。 M1 Quantum インジケーター の主な特徴 M1時間足 およびすべての 主要通貨ペア 向けに設計 すべての取引にストップロスとテイクプロフィットを設定 資金管理 を実装し、トレーダーが簡単に取引できるようサポート 高い勝率と高い 連続勝利 リペイントなし、遅延なし あらゆるトレーダーにとって理解しやすい M1 Quantum を使用するには、 M1 Quantum Assistant が必要です。この強力なツールは、M1 Quantum をご購入いただいたすべてのお客様に 無料 で提供されています。 M1 Quantum Assistant をダウンロード 私のMQL5 チャンネルに参加して、最新のアップデートや新製品のリリース情報を入手してください。 価格は
トレンドキャッチャーインジケーター トレンドキャッチャーインジケーターは、開発者独自の適応型トレンド分析指標を組み合わせることで、市場価格の動きを分析します。短期的なノイズを除去し、根底にあるモメンタムの強さ、ボラティリティの拡大、価格構造の挙動に焦点を当てることで、真の市場方向性を特定します。また、移動平均線、RSI、ボラティリティフィルターなどの平滑化およびトレンドフィルタリング機能を備えたカスタマイズ指標も使用します。 実際の運用状況のモニタリングやその他の製品については、こちらをご覧ください: https://www.mql5.com/en/users/mechanic/seller ご注意ください。私はTelegramでEAや設定を販売していません。詐欺です。すべての設定はブログで無料で公開しています。 重要!ご購入後すぐにご連絡ください。手順とボーナスをお送りします!
FX Trend NG:次世代マルチマーケット・トレンドインテリジェンス 概要 FX Trend NG は、複数の時間足に対応したプロフェッショナル向けトレンド分析およびマーケット監視ツールです。 市場全体の構造を数秒で把握することができます。 複数のチャートを切り替える必要はありません。どの銘柄がトレンド中なのか、どこでモメンタムが弱まっているのか、そしてどの時間足で強い整合性があるのかを瞬時に確認できます。 ローンチ特別オファー – FX Trend NG を $30(6ヶ月) または $80 永久ライセンス でご利用いただけます。 すでに Stein Investments のユーザーですか? -> メッセージを送信 して、プライベートグループへアクセスしてください。 セットアップや詳細情報が必要ですか? -> Stein Investments 公式ページ をご覧ください。 1. FX Trend NG が他と異なる理由 3ステート・トレンドロジック ― Buy と Sell だけではない • 多くのインジケーターは Buy または Sell の2状態のみを表示します。
GoldenX Entryは、MT5向けのインジケーターであり、適応型Smart Entry Trendアルゴリズム、シグナルスコアリングシステム、マーケットレジーム検出機能、およびボラティリティフィルターを備えています。各シグナルには、計算されたエントリーレベル、3つのテイクプロフィット(TP1、TP2、TP3)、およびストップロスレベルが含まれます。本インジケーターは、異なる市場環境に適応するために設計された複数の分析レイヤー上に構築されており、マルチレイヤー分析システムと内蔵オプティマイザーおよび統計トラッキングシステムを組み合わせています。リスク・リワード(RR)指標および過去のトレード履歴に基づく定量分析を提供します。 使い始めは簡単です — 選択した時間足でオプティマイザーを実行し、そのままチャート上でインジケーターを使用します。 コア機能 GoldenX Entryは、シグナルエンジンとトレード管理機能、そして過去統計トラッキングを1つのチャートに統合しています: - 内蔵オプティマイザー: オプティマイザーはチャート上でワンクリックで実行できます。200通りのパラメー
Gann Made Easy   は、ミスター・ギャンの理論を使用した取引の最良の原則に基づいた、プロフェッショナルで使いやすい外国為替取引システムです。 W・D・ガン。このインジケーターは、ストップロスとテイクプロフィットレベルを含む正確な買いと売りのシグナルを提供します。 PUSH通知を利用して外出先でも取引可能です。 ご購入後、取引方法の説明と優れた追加インジケーターを無料で入手するには、私にご連絡ください! おそらく、ギャンの取引手法についてはすでに何度も聞いたことがあるでしょう。通常、ギャンの理論は初心者のトレーダーだけでなく、すでにある程度の取引経験がある人にとっても非常に複雑なものです。なぜなら、ギャンの取引手法は理論的にはそれほど簡単に適用できるものではないからです。私はその知識を磨き、最良の原則を私の外国為替インジケーターに組み込むために数年を費やしました。 このインジケーターは非常に簡単に適用できます。必要なのは、それをチャートに添付し、簡単な取引推奨事項に従うだけです。このインジケーターは常に市場分析の仕事を行い、取引の機会を探します。適切なエントリーポイントを検
Meridian Pro
Ottaviano De Cicco
5 (2)
Meridian Pro 2.00:MT5向けプロ仕様マルチタイムフレーム・トレンドマトリクス Meridian Pro 2.00 は、MetaTrader 5 向けのプロ仕様の適応型トレンドマトリクスです。オリジナルの Meridian トレンドエンジン、クリーンなチャート ribbon、確定足ベースのシグナル矢印、8時間足 dashboard、Fuel momentum、weighted consensus、synthetic HTF processing、そしてチャート上に直接表示される上位足コンテキストラインを統合します。 目的はシンプルです。現在のトレンド、マルチタイムフレーム構造、強度、momentum、EA-ready 状態を、複数チャートに無関係なインジケータを重ねるのではなく、1つの整理された workflow で読むことです。 Meridian Pro の違い 1つの適応型エンジン - 同じ volatility-aware Meridian ロジックを M1 から W1 まで適用します。 Synthetic HTF architecture - 上位足行は下位足デ
UZFX {SSS} スキャルピング・スマートシグナル MT5は、変動の激しい市場において正確かつリアルタイムのシグナルを求めるスキャルパー、デイトレーダー、スイングトレーダー向けに設計された、リペイントしない高性能な取引インジケーターです。(UZFX-LABS)によって開発されたこのインジケーターは、価格行動分析、トレンド確認、スマートフィルタリングを組み合わせることで、すべての通貨ペアおよび時間軸において、高確率の売買シグナルを生成します。 推奨* 最適な時間足:15分足以上。 {1時間足}が私のお気に入りです。そして、その成果は驚くべきものです...! 注:{ LTL 164343 }インジケーターと組み合わせることで、シグナルの勝率を高めることができます。 LTLシグナルでトレンドを判断し、SSSシグナルをエントリーシグナルとして活用してください。 このアプローチにより勝率が最大化され、誤ったシグナルの発生を防ぐことができます。 主な機能 スマートシグナル検出 – 強力なトレンド反転や継続パターンを正確に特定します。 マルチタイムフレーム・スキャルピング – すべての時間
SmartScalping is a powerful trading companion designed to generate high-probability entry signals with dynamic TP/SL/DP levels based on volatility. Built-in performance tracking shows win/loss stats, PP1/PP2 hits, and success rates — all updated live. Key Features: Buy/Sell signals with adaptive volatility bands Real-time TP/SL/DP levels based on ATR Built-in MA Filter with optional ATR/StdDev volatility Performance stats panel (Success, Profit/Loss, PP1/PP2) Alerts via popup, sound, push, or e
ARIPoint
Temirlan Kdyrkhan
1 (1)
ARIPoint is a powerful trading companion designed to generate high-probability entry signals with dynamic TP/SL/DP levels based on volatility. Built-in performance tracking shows win/loss stats, PP1/PP2 hits, and success rates all updated live. Key Features: Buy/Sell signals with adaptive volatility bands Real-time TP/SL/DP levels based on ATR Built-in MA Filter with optional ATR/StdDev volatility Performance stats panel (Success, Profit/Loss, PP1/PP2) Alerts via popup, sound, push, or email Cu
MasterTrend Indicator for MT5 A powerful trend-following and signal-evaluation tool MasterTrend   is a custom MT5 indicator that combines Moving Averages and ATR-based risk/reward logic to generate clear buy/sell signals. It visualizes dynamic SL/TP levels, evaluates past trade outcomes, and displays win/loss statistics in a clean on-chart panel. Key features include: Buy/Sell signals based on MA crossovers ATR-based SL/TP1/TP2/TP3 levels with visual lines and labels Signal outcome tracking wit
Reversion King Indicator
Eugen-alexandru Zibileanu
5 (4)
新たな王者が登場 - インジケーター + 注文管理表示(TP1 + TP2 + TP3)+ オプションのTelegramシグナル送信機能付き(無料) (完全なトレード&シグナルシステム) ゴールド向け最高のEA: Gold Slayer このインジケーターには、高度な戦略、カスタマイズ可能な注文管理システム、そしてエンベロープ拡張を組み合わせた平均回帰システムが搭載されています。さらに、RSIなど複数のインテリジェントな確認フィルターによって、高確率の反転エントリーをBUY・SELLシグナルとして検出します。 単にトレードを学ぶだけでなく、複数ポジションを効果的に管理し、過去に利益を出しているオープンポジションで損失トレードをカバーする方法も学べます。 M5向けに構築・最適化されており、流動性が高くシグナルの精度が安定しているBTCUSDとXAUUSDで優れたパフォーマンスを発揮します。 このインジケーターは、ATRを基に自動計算されたエントリー、ストップロス、テイクプロフィットレベルを備えた明確なLong・Shortシグナルを提供するため、リスク管理が最初から組み込まれています。 マ
この製品は 2026 年の市場向けに更新され、最新の MT5 ビルドに最適化されています。 価格更新のお知らせ: Atomic Analyst は現在 $99 で提供されています。 次の 30 件の購入 後、価格は $199 に上がります。 特別オファー: Atomic Analyst を購入後、私にプライベートメッセージを送ることで、 Smart Universal EA を無料 で受け取り、Atomic Analyst のシグナルを自動売買に変えることができます。 Atomic Analyst は、リペイントなし、再描画なし、遅延なしの Price Action トレーディングインジケーターで、手動取引、シグナルの明確化、EA 自動化のために設計されています。 User manual: settings, inputs and strategy. 価格行動、強さ、モメンタム、マルチタイムフレーム方向、高度なフィルターを分析し、トレーダーがノイズを減らし、弱いセットアップを避け、より構造化された取引判断を行えるようにします。 このインジケーターは、複雑な市場計算をシンプルな視覚シ
Azimuth Pro
Ottaviano De Cicco
5 (7)
Azimuth Pro V2:MT5向けシンセティック・フラクタル構造分析と確認済みエントリー 概要 Azimuth Pro は Merkava Labs によるマルチレベルスイング構造インジケーターです。4つのネストされたスイングレイヤー、スイングアンカーVWAP、ABCパターン検出、3タイムフレーム構造フィルタリング、そして確定バーでの確認済みエントリー — 1つのチャートで、ミクロスイングからマクロサイクルまでを網羅するワークフロー。 これはブラインドシグナル製品ではありません。ロケーション、コンテキスト、タイミングを重視するトレーダーのための構造ファーストワークフローです。 V2発売記念オファー — Azimuth Pro V2をUSD 399で(次の100本)。最終価格:USD 499。 1. V2での変更点 シンセティック・マルチタイムフレームエンジン 上位タイムフレーム分析をMeridian Proと同じ独自のシンセティックアーキテクチャで一から再構築。よりクリーンなHTFコンテキスト、安定したライブ動作、従来のMTF同期問題なし。シンセティックエンジンは 固定比率タ
ScalpPoint is a powerful trading companion designed to generate high-probability entry signals with dynamic TP/SL/DP levels based on volatility. Built-in performance tracking shows win/loss stats, PP1/PP2 hits, and success rates — all updated live. Key Features: Buy/Sell signals with adaptive volatility bands Real-time TP/SL/DP levels based on ATR Built-in MA Filter with optional ATR/StdDev volatility Performance stats panel (Success, Profit/Loss, PP1/PP2) Alerts via popup, sound, push, or emai
Market Structure Order Block Dashboard MT5 は、市場構造と主要な価格反応ゾーンをチャート上で直接読み取りたいトレーダー向けに設計された MT5 インジケーターです。BOS、ChoCH、オーダーブロック、Fair Value Gap (FVG)、流動性、Kill Zones、Volume Profile、そして素早い分析のためのコンパクトなダッシュボードを組み合わせています。 本インジケーターは、市場構造、ICT、Smart Money の概念を意思決定の枠組みとして使用するトレーダーを対象としています。トレンド継続、反転の可能性、価格の不均衡、流動性ターゲット、注目ゾーンをより構造的に特定する助けとなります。 購入者向けの付属リソース 購入後、MQL5 のプライベートメッセージにてご依頼いただくと、完全な PDF ユーザーガイドとパラメータ設定のヒントを提供いたします。MQL5 のプライベートメッセージによる直接的な技術サポート。 バージョン 1.20 では 2 つの重要な追加機能があります: Pending BOS / Pending Cho
FX Power: 通貨の強弱を分析して、より賢い取引を実現 概要 FX Power は主要通貨と金の実際の強弱をあらゆる市場状況で理解するための必須ツールです。強い通貨を買い、弱い通貨を売ることで、 FX Power は取引の意思決定を簡素化し、高い確率の取引機会を見出します。トレンドを追従する場合でも、極端なデルタ値を使用して反転を予測する場合でも、このツールはあなたの取引スタイルに完全に適応します。ただ取引するだけではなく、 FX Power で賢く取引をしましょう。 1. なぜ FX Power がトレーダーにとって非常に有益なのか 通貨と金のリアルタイム強弱分析 • FX Power は主要通貨と金の相対的な強弱を計算し、マーケットダイナミクスに関する明確な洞察を提供します。 • どの資産がリードしているか、または後れを取っているかを監視して、取引するペアを賢く選びましょう。 マルチタイムフレームの包括的なビュー • 短期、中期、長期のタイムフレームで通貨と金の強弱を追跡し、マーケットトレンドに基づいて取引戦略を調整できます。 • スキャルピングからスイングトレード
Crystal Heikin Ashi Signals - Professional Trend & Signal Detection Indicator Advanced Heikin Ashi Visualization with Intelligent Signal System for Manual & Automated Trading Final Price: $149 ---------> Price goes up $10 after every 10 sales . Limited slots available — act fast . Overview Crystal Heikin Ashi Signals is a professional-grade MetaTrader 5 indicator that combines pure Heikin Ashi candle visualization with an advanced momentum-shift detection system. Designed for both manual traders
ご紹介     Quantum Breakout PRO は 、ブレイクアウト ゾーンの取引方法を変革する画期的な MQL5 インジケーターです。 13年以上の取引経験を持つ経験豊富なトレーダーのチームによって開発されました。     クォンタム ブレイクアウト プロ   は、革新的でダイナミックなブレイクアウト ゾーン戦略により、あなたのトレーディングの旅を新たな高みに押し上げるように設計されています。 クォンタム ブレイクアウト インジケーターは、5 つの利益ターゲット ゾーンを備えたブレイクアウト ゾーン上のシグナル矢印と、ブレイクアウト ボックスに基づいたストップロスの提案を提供します。 初心者トレーダーにもプロのトレーダーにも適しています。 量子EAチャネル:       ここをクリック 重要!購入後、インストールマニュアルを受け取るためにプライベートメッセージを送ってください。 推奨事項: 時間枠: M15 通貨ペア: GBPJPY、EURJPY、USDJPY、NZDUSD、XAUUSD アカウントの種類: ECN、Raw、またはスプレッドが非常に低い R
Quant Direction は、3次元の市場分析ツールです。完全に客観的なアルゴリズムベースの市場分析を提供し、様々なパラメータにわたる正確なパーセンテージ偏差を同時に算出します。高度なAI搭載モデリングツールで開発され、厳密なテストを経て開発されたこのアルゴリズムは、かつてない精度で市場を分析するように設計されています。プラットフォーム上では、あらゆる通貨ペアや金融商品を分析できます。 短期取引、デイトレード、スイングトレードなど、どのような取引スタイルに も、Quant Directionは最適な選択肢です。 オペレーターの本当の利点 Quant Directionの真の利点は、感情、眼精疲労、過剰分析を完全に排除できる点にあります。方向性を探るために何十ものチャートを手作業で精査したり、自分の好みを常に疑ったりする必要がなくなります。このシステムは、8つの時間間隔(5ヶ月から月単位まで)をミリ秒単位で処理します。あらゆる瞬間に市場を支配している主体を正確に明らかにし、常に成功確率が最も高い方向で取引できるようにします。 市場分析の3つの側面 このアルゴリズムは市場を3つの
マーケットメーカーのためのツール。 Meravith は次の機能を提供します: すべての時間足を分析し、現在有効なトレンドを表示します。 強気と弱気の出来高が等しくなる流動性ゾーン(出来高均衡)を強調表示します。 異なる時間足のすべての流動性レベルをチャート上に直接表示します。 テキスト形式の市場分析を生成し、参考情報として表示します。 現在のトレンドに基づいて目標値、サポートレベル、ストップロスを計算します。 取引のリスクリワード比を算出します。 口座残高に基づいてポジションサイズを計算し、潜在的な利益を推定します。 また、市場に大きな変化があった場合には警告を表示します。 インジケーターの主要ライン: 強気/弱気の出来高エグゾーストライン ― 目標値として機能します。 市場のトレンドを示すライン。市場が強気か弱気かによって色が変わり、トレンドのサポートとして機能します。主にその色が市場センチメントを示します。 出来高均衡ライン(Eq)。Eq(Volume Equilibrium)ラインはシステムの中核です。これは買い手と売り手の出来高のバランスポイントを表します。市場の流動性を示し
作者のその他のプロダクト
Start Midas SD Channel
Ricardo Almeida Branco
5 (1)
Do you already know the Start Midas indicator? What about the Vwap Standard Deviation indicator? And I need to speak again in the book MIDAS Technical Analysis ... The Start Midas SD Channel indicator combines the two in one, bringing the practicality and efficiency of Midas with the statistical calculation of the standard deviation. All of this with the practicality of the White Trader Start indicators, where you can plot the indicator and move them on the screen using keyboard shortcuts
The White's Candle Color indicator (by volume) will color the candles based on the current candle's volume compared to the moving average of the volume. This will allow you to see clearly if the volume (real or tick) is within the normal range, whether it is high or low and bring very important information about the market. I hope that this indicator can help in your operational. Success and good trades!
White Weis Volume This indicator shows the sum of the volume in each wave, bulish or bearish, as idealized by David Weis , but it brings an important addition , which is the marking of the bar with the highest volume of the wave (White Bar)! In coding the indicator, it was sought to optimize the code to require minimal processing during use and not to overload mt5. The indicator can be used for pre-trading analysis and study, where the trader analyzes possible points of support and resistance
Volume Doji
Ricardo Almeida Branco
Hey guys. This indicator will show you, in the volume histogram, if the candle was a Doji, a bullish candle, or a bearish candle. The construction of this indicator was requested by a trader who uses other indicators from my catalog, and I decided to release it free to help traders who think that the indicator can contribute to their operations. The parameters are: Volume Type: Real Volume or Tick Volume. Color if the candle is bearish: select the color. Color if the candle is high: select
FREE
Display N Bars
Ricardo Almeida Branco
4.88 (8)
The Display N Bars utility is a simple tool designed to help identify candles. If a trader tries to share knowledge with a colleague but it is difficult to pinpoint exactly the desired candle, just say the corresponding candle number. The candle count is reset every day. Seeking to offer a good customization the inputs are: Display type -> Display only odd, only odd, or both candles? Direction -> Horizontal or Vertical? Display multiples of: (display frequency) -> Display all number
FREE
White Trader Clock
Ricardo Almeida Branco
5 (1)
Simple countdown indicator for the next candle. Only claim is to be light! The indicator inserts a text object to the right of the current price and calculates how much time is left for the new bar, showing this to the trader. Leave your comment if the indicator helped you in any way! If you have any suggestions, let me know to evaluate the improvements. Success and Good Trades!
FREE
Automatic Vwap Midas
Ricardo Almeida Branco
5 (1)
The 3 Automatic Vwap (Midas) Indicator can be used for Price and Volume studyers to map the movement of market drivers. It automatically plots 3 Vwaps, two of which are dynamic and will be updated throughout the day if new highs or new lows emerge. The third Vwap is daily and can help if the trend is up or down. Also, an auxiliary indicator that plots (also dynamic) points of interest with OHLC prices (Open, High and Low of the current day and Close of the previous day) was inserted. Success and
Attention: New update - 4 major practicality improvements! 1) Alarm 2) Midas text value 3) Click panel 4) Can be connected to an EA to operate in semi-automatic mode Attention - This indicator does not work perfectly in backtest due to MT5 peculiarities (Reading hotkeys or panel clicks) . My suggestion is that you test Automatic Vwap Midas which has automatic operation to analyze the calculation and then buy Start if you think the indicator will match your operating.     This indicator is use
O HL2 C Lines
Ricardo Almeida Branco
5 (2)
If you consider the extremes of the daily price as important points, this indicator will help in your trades. Now, instead of manually drawing lines that mark daily highs and lows, you can use the O (HL) ² C Lines indicator. Thus, the OHLC Lines indicator automatically plots the lines O (Open for the current day), H (High for the current day), L (Low for the current day) and C (Close for the previous day). Plot also the high and low of the previous day. Thus, we have 4 static lines and tw
PVA Dragon
Ricardo Almeida Branco
Users of PVRSA / PVA certainly already know the Dragon indicator and its use. The Dragon works as dynamic support and resistance and can be used for scalper or trend follower. In addition to the Dragon we have the WGT (fast) and EMA (slow) averages that can show immediate movement and also trend movement. Stay tuned for the Dragon's inclination! The indicator can be used on any asset/currency pair and can be customized according to the trader's interest. See also my volume analysis indicato
Several techniques use volume as an important point in the trade. Whether to indicate strength, exhaustion, pullback weakness, among others. In chief I quote Richard Wyckoff's theory, which said about the importance of looking price and volume. However, there are several possibilities to filter what is volume that should be noticed. PVRSA/PVA users use an indicator with specific colors, which assist in identifying the volume and type of movement that the price has made. Will the high volume
Do you use volume in your reading of the market? Certainly many traders use it, and do not imagine operating without it. The Color Histogram Volume Set indicator allows the user to choose the value that he considers interesting to monitor. When you pass this you will have visual confirmation and if you want you will also have the audible alert that is given by the indicator. Of course, there are other ways to try to find a high volume, such as assessing whether the volume is above av
WT Vwap Bands
Ricardo Almeida Branco
The WT Vwap Bands indicator is an indicator that combines price and volume, helping to show whether the price is within the "fair price", overbought or oversold. The indicator code was designed for performance and has already been tested in a real trading account. In addition to the visual inputs (color, thickness and line style), the user can define a% value that depends on the price. The default values work with the most distant band at 1% of the price and then dividing this distance in
Fibo Z
Ricardo Almeida Branco
5 (1)
With it, you leave pre-configured two expansion settings and one fibo retraction configuration to use via keyboard shortcut and mouse click. That is, the Fibo_Z utility facilitates the use of MT5's native functions. The shortcut keys are: "Z" configuration 1 of the expansion. "X" expansion setting 2 "Z" retraction configuration. "V" clears objects from the screen. It is. Success and good trades!
Want to make the graph cleaner? Don't you use the opening price in your analysis? Want to use a chart model that was used by Richard Wyckoff? Then you need to know the Color HLC Candles and Bars indicator. In the same indicator you can switch to the display of candles or bars. Take a look at the other volume indicators to complement your operating. And don't forget to look at the best Vwap Custom (Midas)! Leave your comment! Success and good trades!
Vwap Freeze
Ricardo Almeida Branco
5 (1)
The previous day's vwap is used by some traders as a support and resistance point, after all it is one of the ways to consider the fair price of that asset or that pair the day before. Possible defenses can occur in this region indicating a reversal, or triggering stops starting a new, more directional movement. It is a matter of analyzing how it will add to your operational. To avoid manually drawing the previous day's vwaps and saving time for your analysis, use the Vwap Freeze indicator, as
Start Display N Bars
Ricardo Almeida Branco
5 (1)
Do you already know Display N Bars? Do you already know the Start tool (from Midas indicators)? In this indicator, we unified the two tools, allowing you to define which candle will start counting, or use the automatic numbering that was already available in the previous version. Description of the utility follows: Display N Bars The Display N Bars utility is a simple tool that aims to help identify candles. If a trader tries to share the knowledge with a colleague but it is difficult t
WT Vwap 5 Bands The WT Vwap Bands indicator is an indicator that combines price and volume, helping to show whether the price is within the "fair price", overbought or oversold. The indicator code was designed for performance and has already been tested in a real trading account. In addition to the visual inputs (color, thickness and line style), the user can define a% value that depends on the price. The default values work with the most distant band at 1% of the price and then dividing
Haos MT5
Ricardo Almeida Branco
5 (1)
The Haos oscillator coded for the MT5! This oscillator allows to verify overbought / oversold regions in two periods (14 and 96, for example), making it possible to anticipate a reversal. Possibility to activate an audible alert when it reaches a defined level. Possibility to choose the alert sound by placing a .wav song in each asset or timeframe. (save a .wav file to the MQL5 \ Files folder) Possibility to activate / deactivate histogram and levels to make the screen cleaner. Customizable col
The Initial Balance (Initial Balance / Initial Balance) is a concept related to the study of volume (to learn more, study about Market Profile and Auction Market Theory. You can find some videos in English when searching for "Initial Balance Market Profile"). The IB defines a range in which prices were negotiated in the first hour of trading.The amplitude of the range is important and the break in the range defined by the Initial Balance may have occurred due to the movement of several players
The VTC Volatility indicator was written to support a Brazilian stock market strategy in the WDO (USDBRL), but it can be adapted to other strategies and markets. In the new indicator update, it is now allowed to choose up to 4 levels to determine the range, and thus be more versatile. The Brazilian stock exchange (B3) has the VTC which is a "Structured Exchange Rate Volatility Transaction" (more information on the B3 website). At around 10:00 am, the VTC "Call" comes out and Brazilian broker
O indicador Vwap Deviation Bands segue na mesma linha dos outros indicadores da White Trader, que buscam leveza, personalização e qualidade, para entregar o que há de melhor para o trader. Isto, além de combinar preço e volume (informações importantes para o trader) com uma medida estatística do desvio padrão. Este indicador já foi utilizado e testado por outros traders que deram sugestões, inclusive, para chegarmos nesta versão final (embora ainda esteja aceitando sugestões, sempre :)   ). O de
Midas is the acronym for Market Interpretation / Data Analysis System is a trade approach started in 1995 by technical analyst Paul Levine and later developed by Andrew Coles, PhD and David Hawkins. Learn more in the book MIDAS Technical Analysis: A VWAP Approach to Trading and Investing in Today's Markets , (I saw that it is possible buy via Amazon). The positive points in relation to the Midas-based indicators are the prediction of movement reversal points, the negative point is the subjectivi
The Vwap Bands Auto indicator seeks to automatically map the maximum market frequency ( automatic update of the outermost band ) and has two intermediate bands that also adjust to daily volatility. Another tool from White Trader that combines price and volume, in addition to mapping the daily amplitude. The external band is updated automatically when the daily maximum or minimum breaks the current frequency, and can be an input signal, seeking a return to the daily vwap. Thus, in addition t
Here we have the Start Midas Fibo Bands , I confess that it is an indicator that excited me enough to operate because I was able to find more defined rules. Well, the indicator has the functions of the other indicators of the Start line , which is a possibility to plot several Midas on the screen, you can move the anchor point using keyboard shortcuts and use the legend to differentiate one anchor from another. The rules that I have analyzed for my possible setup are recommended to the entry, st
Prior Lines
Ricardo Almeida Branco
This indicator shows on the current day some lines of interest, such as maximum, minimum and closing of the previous day, as well as the opening, maximum and minimum price of the current day. It can also show the GAP (closing of the previous day and opening of the current day) and projections of the amplitude of the previous day, according to the value you choose in the multiplier. Oh, I was going to forget. It is also possible to determine the time frame, which is daily by default. If this i
The best Vwap Midas coding for Metatrader 5 you can find in White Trader indicators. The indicator has been optimized not to recalculate (improving performance) and has several visual settings for you to adapt in your own way. TRY IT FOR FREE by clicking the free demo button Where and why to use Vwap Midas (and Auto Zig Vwap Midas) can be used on a variety of indices, currencies, forex, cryptocurrencies, stocks, indices and commodities. Many successful traders use price and volume to get the
The Danko Trend Color indicator is actually a candle coloring to bring practicality, ease and information to your charts. Danko Trend Color combines PRICE AND VOLUME indicators to define the prevailing trend, so the colors are: Blue (indicates an uptrend) Orange (indicates a downtrend) White (indicates undefined trend) I don't like to promise anything with my indicators, I ask you to download, test it for free (for use in backtesting) and see if the indicator can, in some way, help your oper
Do not buy before seeing the Danko Trend Color product, as this panel is a way to view a summary of this indicator on various timeframes. The Danko DTC Panel utility allows you to look at the trend in up to 5 timeframes. When clicking on the timeframe texts, a new window will open with the indicator plotted on the screen so you can see the complete chart. The width of the panel, with the amount of candles you want to see, is customizable, see the images below. Ao clicar nos textos dos timeframe
フィルタ:
santosjpa
137
santosjpa 2021.03.26 21:26 
 

ユーザーは評価に対して何もコメントを残しませんでした

レビューに返信