WT Candle Color by Volume
- Indikatoren
-
Ricardo Almeida Branco
 Ich habe 2018 begonnen, der brasilianischen Börse in einem Demo-Konto zu folgen, und fand die Anzahl der verwendeten Setups interessant. Ich nahm das Lernen und sogar die Demo ernst und verstand, dass ich mit der Programmierung beginnen sollte, um Setups zu validieren / zu verwerfen.
 - Version: 1.0
- Aktivierungen: 5
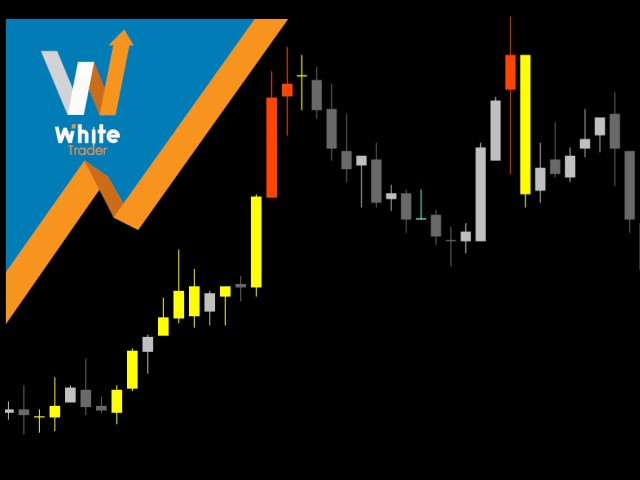
Der White's Candle Color Indikator (nach Volumen) färbt die Kerzen basierend auf dem Volumen der aktuellen Kerze im Vergleich zum gleitenden Durchschnitt des Volumens. Dies ermöglicht es Ihnen, klar zu sehen, ob das Volumen (real oder tick) ist innerhalb des normalen Bereichs, ob es hoch oder niedrig ist und bringen sehr wichtige Informationen über den Markt. Ich hoffe, dass dieser Indikator kann in Ihrem Betrieb zu helfen. Viel Erfolg und gute Trades!