Initial Balance MT5
- Indikatoren
-
Ricardo Almeida Branco
 Ich habe 2018 begonnen, der brasilianischen Börse in einem Demo-Konto zu folgen, und fand die Anzahl der verwendeten Setups interessant. Ich nahm das Lernen und sogar die Demo ernst und verstand, dass ich mit der Programmierung beginnen sollte, um Setups zu validieren / zu verwerfen.
 - Version: 2.0
- Aktualisiert: 28 Januar 2021
- Aktivierungen: 5
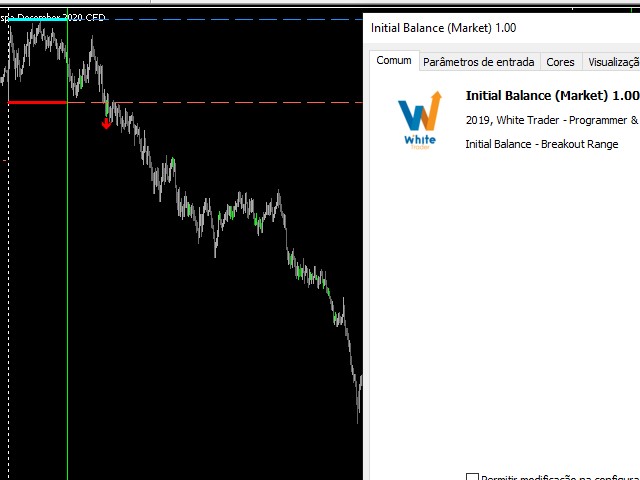
Die Anfangsbilanz (Initial Balance / Initial Balance) ist ein Konzept, das mit der Untersuchung des Volumens zusammenhängt (um mehr darüber zu erfahren, studieren Sie das Marktprofil und die Auktionsmarkttheorie. Sie können einige Videos auf Englisch finden, wenn Sie nach "Initial Balance Market Profile" suchen).
Die IB definiert eine Spanne, in der die Preise in der ersten Handelsstunde verhandelt wurden; die Amplitude der Spanne ist wichtig, und die Unterbrechung der durch die Anfangsbilanz definierten Spanne kann durch die Bewegung mehrerer Akteure, die in dieser Richtung tätig sind, entstanden sein, und es ist interessant, diese Bewegung zu verfolgen.
Dieser Indikator soll also automatisch das Niveau der IB markieren und kann den Bruch auch visuell anzeigen.
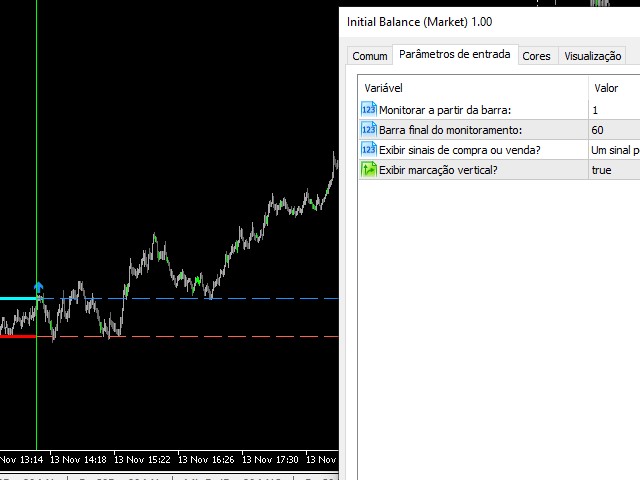
Die Eingabeeinstellungen sind:
- Startbar: 1 (Überwachung ab der ersten Kerze)
- Letzter Balken: 60 (wir überwachen also die erste Stunde, wenn es sich um den 1-Minuten-Zeitrahmen handelt)
- Anzeige von Kauf- und Verkaufssignalen (Puffer, der einen Bruch signalisiert und für die Verwendung in Expert Advisors angepasst werden kann, wobei Puffer 0 ein Verkaufssignal und Puffer 1 ein Kaufsignal ist);
- Anzeige der vertikalen Markierung (eine grüne Linie in der letzten IB-Kerze)
Das ist es.
Viel Erfolg und gute Trades!


Der Benutzer hat keinen Kommentar hinterlassen