Start Vwap Custom Midas
- Indikatoren
-
Ricardo Almeida Branco
 Ich habe 2018 begonnen, der brasilianischen Börse in einem Demo-Konto zu folgen, und fand die Anzahl der verwendeten Setups interessant. Ich nahm das Lernen und sogar die Demo ernst und verstand, dass ich mit der Programmierung beginnen sollte, um Setups zu validieren / zu verwerfen.
 - Version: 6.2
- Aktualisiert: 14 November 2023
- Aktivierungen: 5
Achtung! Neues Update - 4 wichtige praktische Verbesserungen!
1) Alarm 2) Midas-Textwert 3) Click-Panel 4) Kann mit einem EA verbunden werden, um im halbautomatischen Modus zu arbeiten
Achtung - Dieser Indikator funktioniert im Backtest aufgrund von MT5-Eigenheiten (Lesen von Hotkeys oder Panel-Klicks) nicht perfekt. Mein Vorschlag ist, dass Sie testen Automatic Vwap Midas, die automatischen Betrieb hat, um die Berechnung zu analysieren und dann kaufen Start, wenn Sie denken, der Indikator wird Ihr Betrieb entsprechen.
Dieser Indikator wird von REAL TRADERS verwendet, die mir geholfen haben, den Indikator zu verbessern, damit sie ihn in ihren Operationen verwenden können. Deshalb gibt es jetzt ein großes Update für diese Trader!
Woher wissen Sie, was die großen Investoren tun?
Mehrere Autoren haben Preis und Volumen untersucht, darunter Richard Wyckoff, Paul Levine, Andrew Coles, David Hawkins und Bob English.
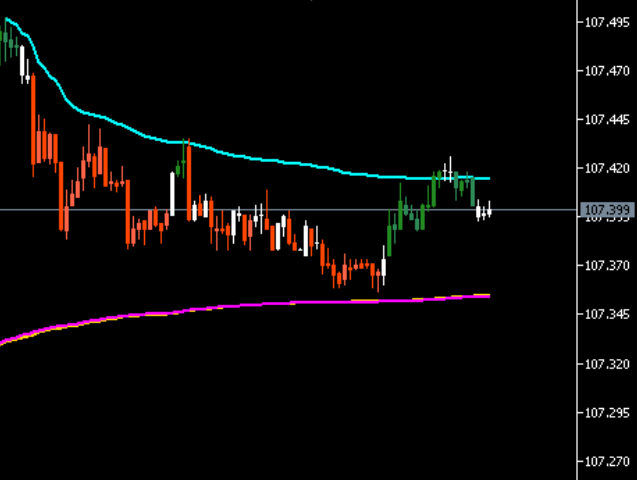
Vwap Custom (Midas) zeigt den Durchschnittspreis der Großanleger an, da es sich um einen volumengewichteten Durchschnitt handelt. Darüber hinaus kann Vwap Custom an bestimmten Punkten positioniert werden und große oder kleine Bewegungen abbilden.
Die Einsatzstrategien sind vielfältig, GAP Midas, Top oder Bottom Midas. Midas Disruption (JAC) oder Midas Defense?
Kommen wir nun zum Start des Vwap-Indikators:
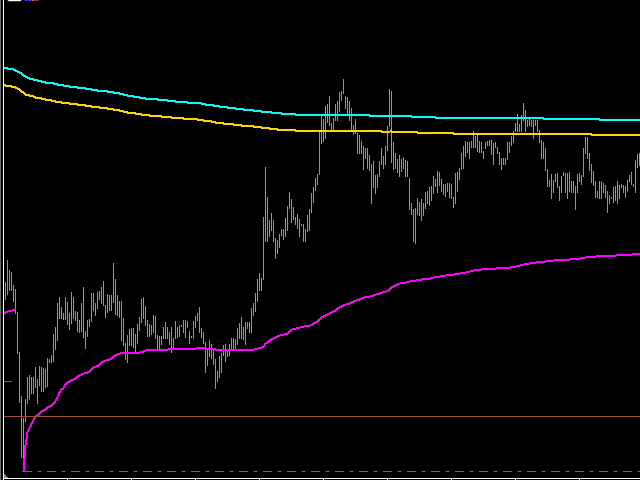
Wenn Sie den Indikator auf Ihren MT5 laden, können Sie * so viele Midas wie Sie wollen * schnell und einfach darstellen.
* Er funktioniert sowohl für B3 (Brasilien) als auch für Forex.
* Die Wahl des Volumens erfolgt automatisch.
* Verliert nicht die Verankerung, wenn der Zeitrahmen gewechselt wird.
* Kann während des Handels oder außerhalb davon verwendet werden.
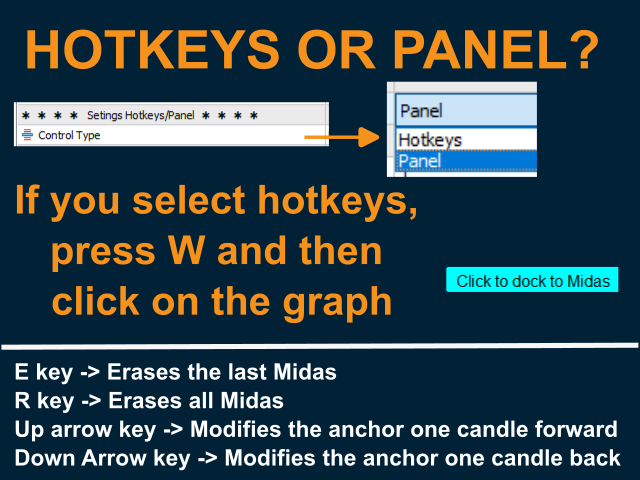
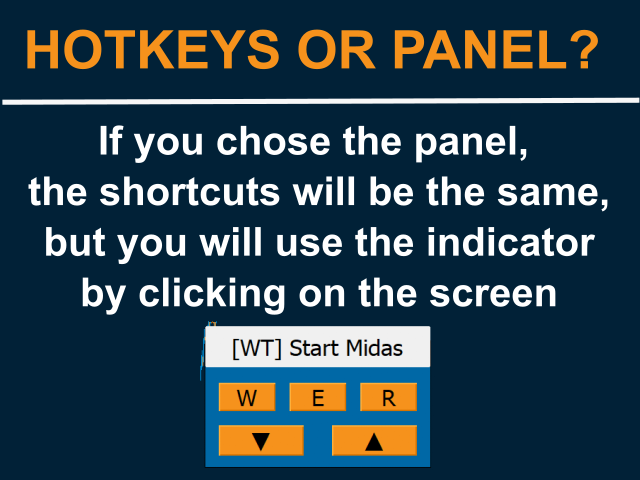
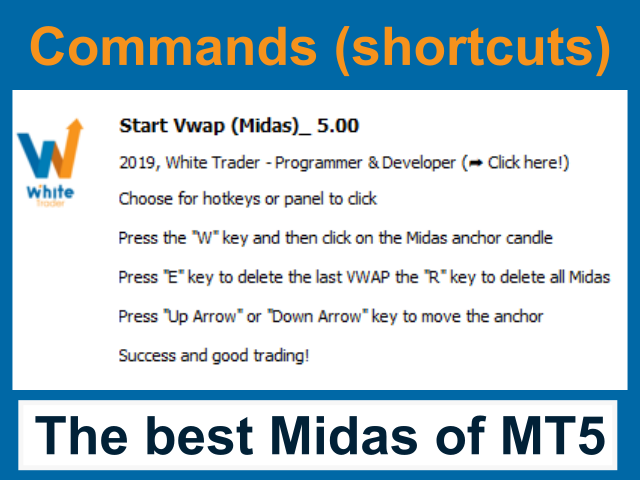
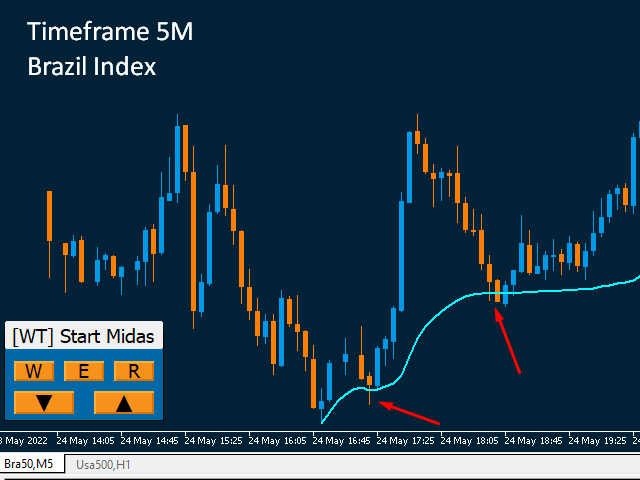
Sie können den Modus"Hotkeys" oder"Panel" wählen. Wenn Sie "w" drücken, geht der Indikator in den Hörmodus und wartet bis zu 5 Sekunden, bis Sie irgendwo auf den Bildschirm klicken, um Midas zu verfolgen.Wie wird es verwendet?
Der Standardindikator bringt die Version mit Tastenkombinationen, wenn Sie möchten, wechseln Sie einfach in den Panel-Modus, um nur mit Klicks auf dem Bildschirm arbeiten zu können.
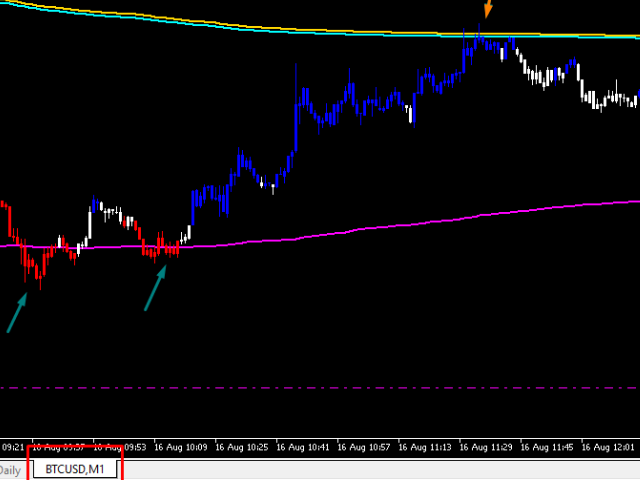
Der Indikator erkennt, ob Sie in der Nähe des Hochs der Kerze geklickt haben und zeichnet dann ein Top-VWAP, oder ob der Klick in der Nähe des Tiefs war und zeichnet dann ein Bottom-VWAP.
Wenn Sie den Ankerpunkt, die Linienfarbe oder die Liniendicke bearbeiten möchten, doppelklicken Sie einfach auf den Midas, wenn er auf dem Bildschirm angezeigt wird, oder gehen Sie durch die Liste der Indikatoren (STRG + I) und wählen Sie den Midas aus, der geändert werden soll, und bearbeiten Sie die Eingaben.
Mit der Alarmfunktion können Sie entscheiden, ob Sie in die Richtung des Midas handeln (z.B. Kauf bei Midas-Boden) oder aus dem Midas ausbrechen (Verkauf bei Midas-Touch) oder in beide Richtungen.
Zum Zeitpunkt des Alarms wird ein Signalpuffer aktiviert, für diejenigen, die die Eingaben automatisieren möchten (ich habe nicht den EA, der das Lesen für die Operationen übernimmt).
SetIndexBuffer(0, BufferMidas, INDICATOR_DATA);
SetIndexBuffer(1, BufferSignal, INDICATOR_DATA);
Außerdem kann der Indikator, je nach Wahl, eine Nachricht an Ihr Mobiltelefon oder an Ihre E-Mail senden (es ist notwendig, das Senden von Push-Nachrichten oder das Senden von E-Mails in MT5 selbst zu konfigurieren).
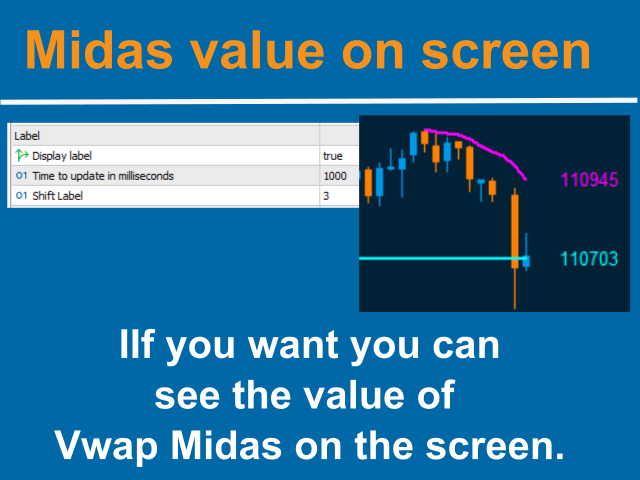
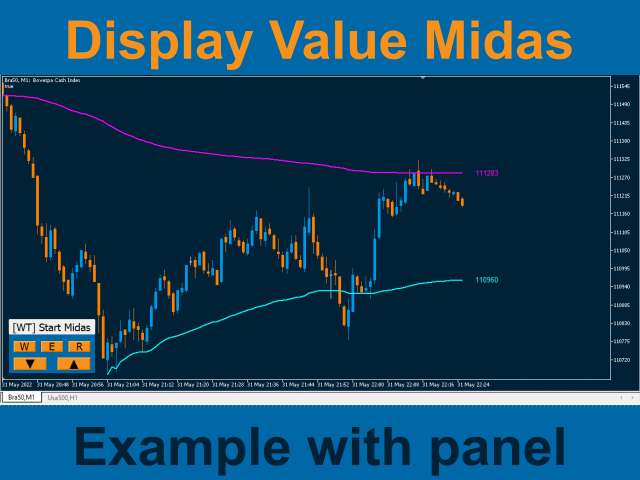
Die letzte der neuen Funktionen ist der Textwert auf dem Bildschirm für diejenigen, die diese Informationen sehen möchten. Die Aktualisierung des Wertes auf dem Bildschirm (die mehr Rechenleistung verbraucht) hat eine Option zur Auswahl der Aktualisierungszeit. 1000 Millisekunden entsprechen 1 Sekunde (Standard).
Viel Erfolg und guten Handel!


Bom dia Ricardo, parabéns pelo indicador. Poderia por favor implementar a opção de alerta apenas sonoro, sem a caixa de mensagem?