O HL2 C Lines
- Indikatoren
-
Ricardo Almeida Branco
 Ich habe 2018 begonnen, der brasilianischen Börse in einem Demo-Konto zu folgen, und fand die Anzahl der verwendeten Setups interessant. Ich nahm das Lernen und sogar die Demo ernst und verstand, dass ich mit der Programmierung beginnen sollte, um Setups zu validieren / zu verwerfen.
 - Version: 3.0
- Aktualisiert: 15 Oktober 2020
- Aktivierungen: 5
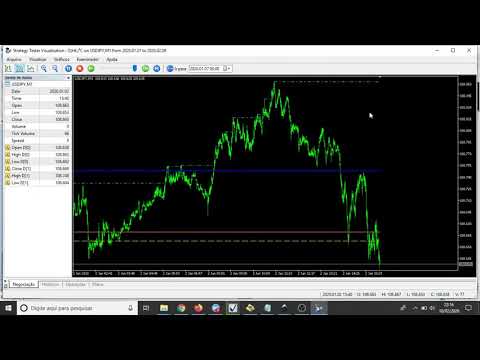
Wenn Sie die Extremwerte des Tageskurses als wichtige Punkte betrachten, wird Ihnen dieser Indikator bei Ihren Geschäften helfen.
Anstatt nun manuell Linien zu zeichnen, die die täglichen Hochs und Tiefs markieren, können Sie den Indikator O (HL) ² C Lines verwenden.
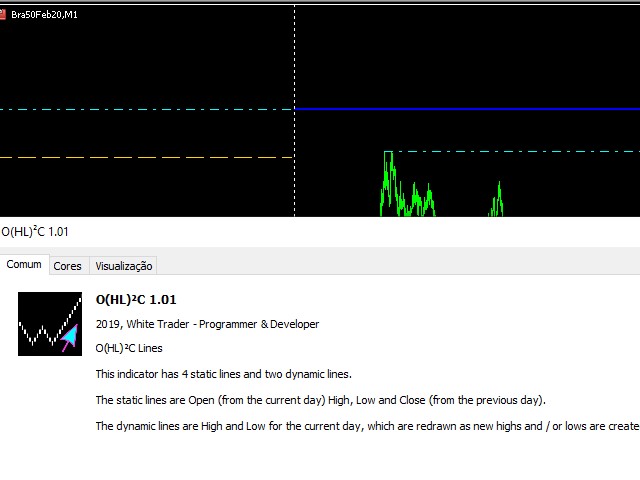
So zeichnet der Indikator OHLC Lines automatisch die Linien O (Open für den aktuellen Tag), H (High für den aktuellen Tag), L (Low für den aktuellen Tag) und C (Close für den Vortag). Es werden auch das Hoch und das Tief des Vortages eingezeichnet.
Somit haben wir 4 statische Linien und zwei dynamische Linien (Hoch und Tief der aktuellen Handelssitzung), die neu gestaltet werden, wenn am aktuellen Tag neue Hochs und/oder Tiefs auftreten.
Viel Erfolg und gute Trades!


GREAT INDICATOR!!!!! EXACTLY WHAT I WAS LOOKING FOR