VTC Volatility
- Indikatoren
-
Ricardo Almeida Branco
 Ich habe 2018 begonnen, der brasilianischen Börse in einem Demo-Konto zu folgen, und fand die Anzahl der verwendeten Setups interessant. Ich nahm das Lernen und sogar die Demo ernst und verstand, dass ich mit der Programmierung beginnen sollte, um Setups zu validieren / zu verwerfen.
 - Version: 3.0
- Aktualisiert: 16 August 2021
- Aktivierungen: 5
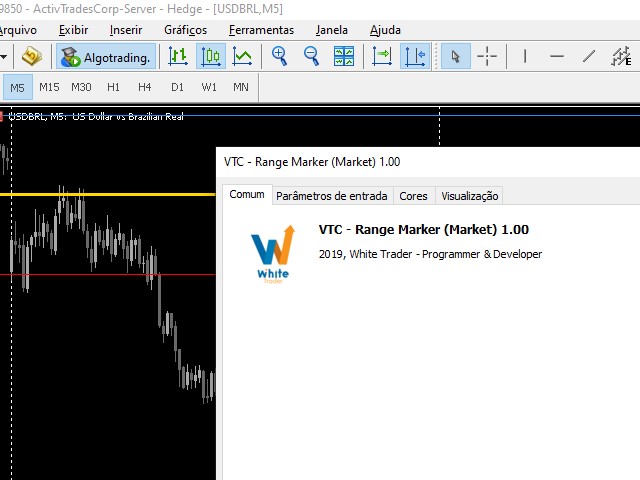
Der VTC-Volatilitätsindikator wurde geschrieben, um eine brasilianische Aktienmarktstrategie in der WDO (USDBRL) zu unterstützen, aber er kann an andere Strategien und Märkte angepasst werden.
Im neuen Indikator-Update ist es nun erlaubt, bis zu 4 Levels zu wählen, um die Spanne zu bestimmen und somit vielseitiger zu sein.
Die brasilianische Börse (B3) hat den VTC, der eine "Structured Exchange Rate Volatility Transaction" ist (mehr Informationen auf der B3-Website).
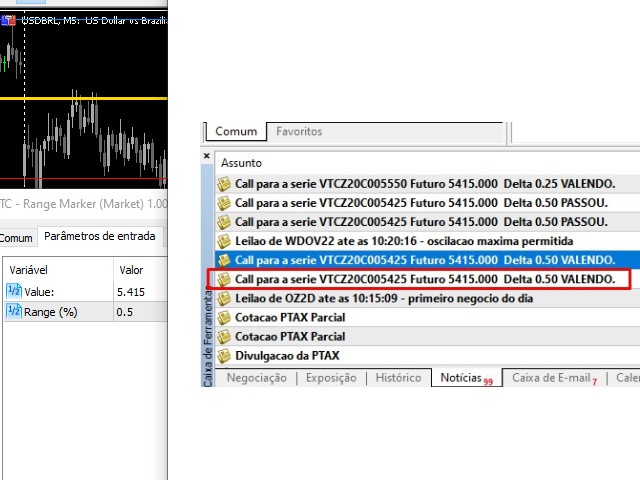
Um ca. 10:00 Uhr erscheint der VTC "Call" und die brasilianischen Broker informieren über MT5 (in der Registerkarte "News"), wie hoch der Wert des Calls ist (siehe Foto) und auch, wie hoch sein Delta ist.
Es stellt sich heraus, dass dieser VTC-Wert zu einem Preis wird, über den viel verhandelt wurde, und er kann einen interessanten Punkt bestimmen. Die Position des Preises in Bezug auf den VTC kann auch ein Indikator für die Bewegung sein, und die Beobachtung des Wertes des Deltas (in Bezug auf den VTC) ist ebenfalls wichtig.
Der Indikator VTC Volatility automatisiert nicht die Suche nach dem VTC-Wert, aber er bringt in seine Eingaben den Tageswert und den Delta-Wert ein.
Dieser Indikator ist ein weiterer Indikator, der auf Anregung von Kollegen programmiert wurde, die meine Arbeit verfolgen.
Hier lasse ich meinen Dank!
Das war's.
Erfolg und gute Geschäfte!
Im neuen Indikator-Update ist es nun erlaubt, bis zu 4 Levels zu wählen, um die Spanne zu bestimmen und somit vielseitiger zu sein.
Die brasilianische Börse (B3) hat den VTC, der eine "Structured Exchange Rate Volatility Transaction" ist (mehr Informationen auf der B3-Website).
Um ca. 10:00 Uhr erscheint der VTC "Call" und die brasilianischen Broker informieren über MT5 (in der Registerkarte "News"), wie hoch der Wert des Calls ist (siehe Foto) und auch, wie hoch sein Delta ist.
Es stellt sich heraus, dass dieser VTC-Wert zu einem Preis wird, über den viel verhandelt wurde, und er kann einen interessanten Punkt bestimmen. Die Position des Preises in Bezug auf den VTC kann auch ein Indikator für die Bewegung sein, und die Beobachtung des Wertes des Deltas (in Bezug auf den VTC) ist ebenfalls wichtig.
Der Indikator VTC Volatility automatisiert nicht die Suche nach dem VTC-Wert, aber er bringt in seine Eingaben den Tageswert und den Delta-Wert ein.
Dieser Indikator ist ein weiterer Indikator, der auf Anregung von Kollegen programmiert wurde, die meine Arbeit verfolgen.
Hier lasse ich meinen Dank!
Das war's.
Erfolg und gute Geschäfte!

Der Benutzer hat keinen Kommentar hinterlassen