PositionGuard MT5
- Indikatoren
- Version: 7.4
- Aktualisiert: 19 November 2021
- Aktivierungen: 5

Dieser Indikator ist dazu gedacht, Ihre offene Position in jedem Zeitrahmen und Währungspaar zu überwachen.
Lange Position
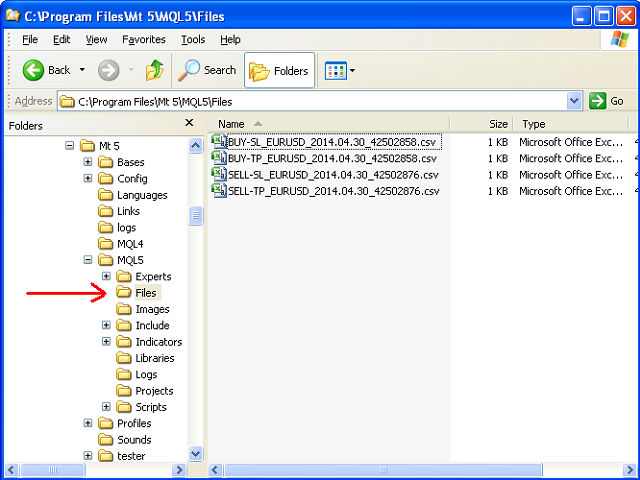
Für den Fall, dass der aktuelle Kurs über den Take-Profit-Kurs oder unter den Stop-Loss-Kurs der eröffneten Position steigt und der Dealing Desk diese Position nicht schließt, erstellt der Indikator eine Excel-Datei mit dem Namen:
Buy-TP_Symbol_Datum_PositionID.csv oder Buy-SL_Symbol_Datum_PositionID.csv
die im Ordner: C:\Programme\ ........\MQL5\Files abgelegt wird
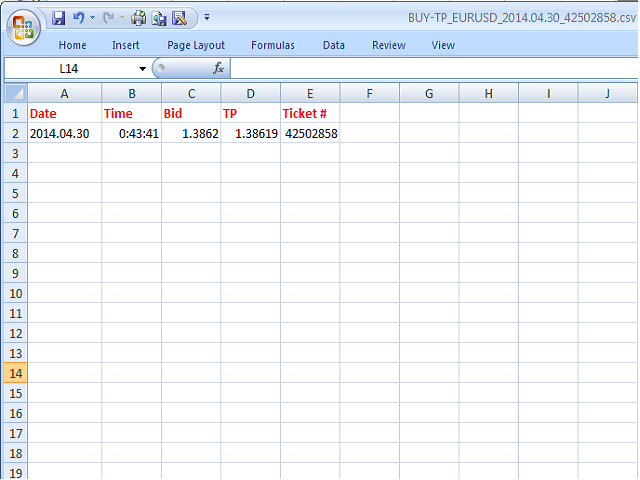
- Excel-Datei für Buy-TP: Sie erhalten eine erste Datenzeile mit Datum und Uhrzeit (HH:MM:SS), wenn der Geldkurs größer als der Take Profit ist.
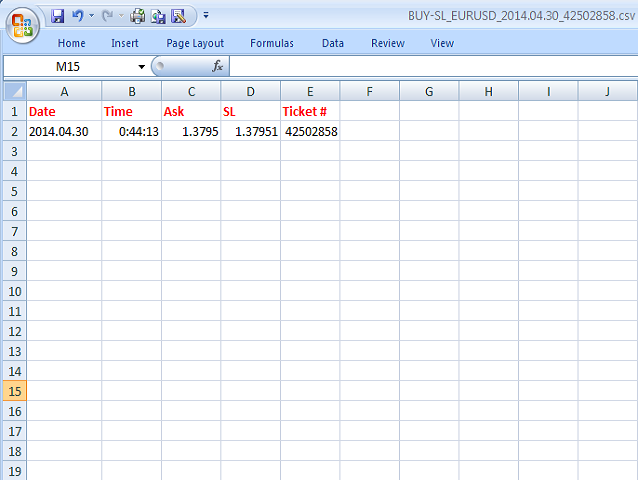
- Excel-Datei für Buy-SL: Sie erhalten eine erste Datenzeile mit Datum und Uhrzeit (HH:MM:SS), wenn der Geldkurs niedriger ist als der Stop Loss.
Short-Position
Für den Fall, dass der aktuelle Kurs unter den Take-Profit-Kurs oder über den Stop-Loss-Kurs der eröffneten Position fällt und der Dealing Desk diese Position nicht schließt, erstellt der Indikator eine Excel-Datei mit dem Namen:
SELL-TP_Symbol_Datum_PositionID.csv oder Buy-SL_Symbol_Datum_PositionID.csv
die im Ordner: C:\Program Files\ ........\MQL5\Files
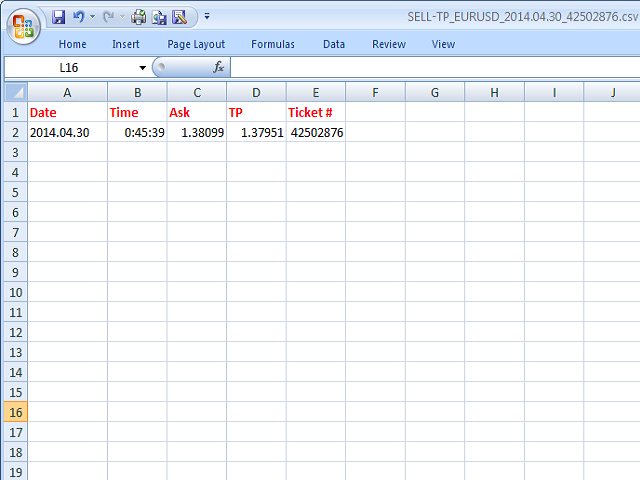
- Excel-Datei für SELL-TP: Sie erhalten eine erste Datenzeile mit Datum und Uhrzeit (HH:MM:SS), wenn der Briefkurs niedriger ist als der Take Profit.
- Excel-Datei für SELL-SL: Sie erhalten eine erste Datenzeile mit Datum und Uhrzeit (HH:MM:SS), wenn der Geldkurs größer als der Stop Loss ist.
Mit diesem System haben Sie immer die richtigen Daten, um mit Ihrem Dealer zu sprechen.