Candle Transition
- Indikatoren
-
Yu Zhang
 I am a senior practitioner in Fintech industry.
And I have done a lot of academic research on financial markets.
From 2012, I work as a Quant.
Forex, stock and futures are my main trading varieties.
I can use MQL4, MQL5, C++, MySql, and Python. - Version: 1.4
- Aktualisiert: 6 Juni 2020
- Aktivierungen: 20
Je nach Handelserfahrung:
- Einige Symbole sind an bestimmten Tagen, wie z.B. Montag oder Nachmittag, leicht umkehrbar. Ein Vergleich des aktuellen Preises mit dem entsprechenden historischen Momentpreis ist daher wertvoll.
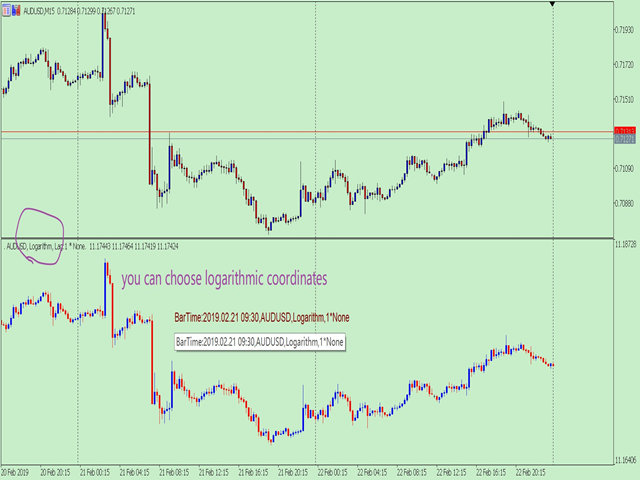
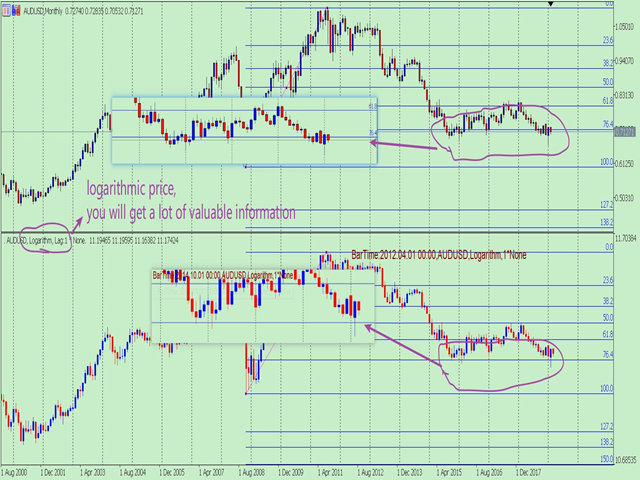
- Wenn das Preiskoordinatensystem einen logarithmischen Preis verwendet, erhalten Sie eine Menge wertvoller Informationen.
1. Was ist das?
Dieses Programm kann den Preis des Symbols konvertieren und zu Ihrem Chart hinzufügen. Sie können ihn mit Ihrem Hauptchart vergleichen.
Die DEMO-Version Link:https://www.mql5.com/en/market/product/36198/
2. Funktion
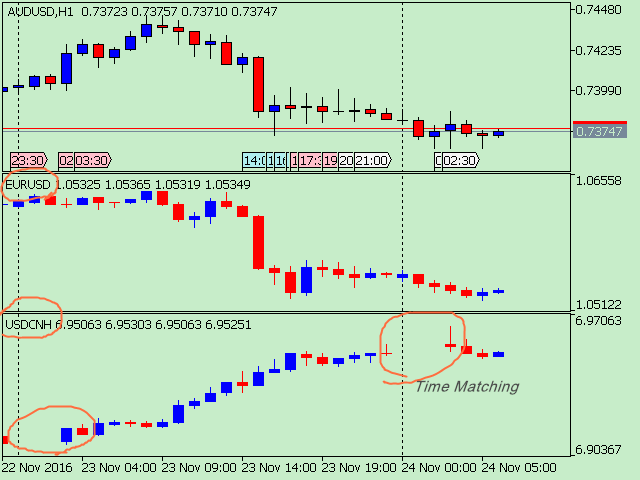
- Sie können das gewünschte Symbol eingeben, das mehrere Symbole in einem einzigen Chart beobachten kann.
- Einige Symbole werden weniger als 24 Stunden pro Tag gehandelt, so dass eine Anpassung an die Zeit erforderlich ist.
- Die Preiskoordinaten haben einen ursprünglichen Modus und einen logarithmischen Modus.
- Sie können den Grad der Verzögerung der Kerze wählen. Zum Beispiel, der aktuelle Chart ist 2019-2-22 am Freitag, können Sie wählen, um das Symbol des vorherigen Freitags zu überlagern.
- Sie können die Verzögerungszeit für die Bequemlichkeit identifizieren.
3. Wie verwenden Sie
Parameter:
- Input_Forex=""; //Eingabe Ihres Symbols, Standard-Chart-Symbol.
- CoordinateMode=Original; //Preiskoordinatenmodus: Original / Logarithmus.
- LagUnit=W1; //Die hinzugefügte Lag-Einheit der Kerze.
- Auch LagUnit kann ausgewählt werden D1/H12/H8... Das bedeutet die Grundeinheit der Verzögerung.
- LagCount=1; //Die hinzugefügte Lag-Anzahl der Kerze.
- wenn LagUnit=W1 und LagCount=2, Das bedeutet eine Gesamtverzögerung von 2 Wochen.
- color BullCandle=clrRed; //Set Bull Candle Color
- color BearCandle=clrBlue; //Bär-Kerzenfarbe einstellen
- color OtherCandle=clrBlack; //Set Other Candle Color
PS:
Wenn Sie keine Daten auf Ihrem System haben, kann es zu folgendem Problem kommen: Plötzlich ist nichts mehr zu sehen, was bedeutet, dass Ihr System gerade Daten herunterlädt. Ich habe nämlich die Möglichkeit zum Herunterladen von Daten in dieses Programm aufgenommen.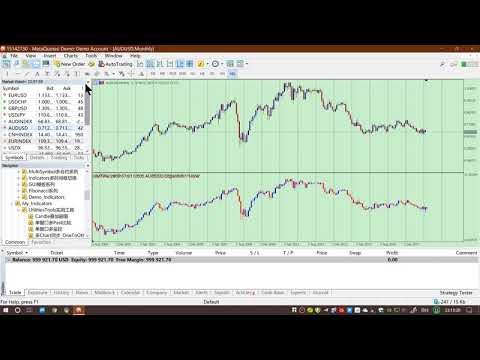

Der Benutzer hat keinen Kommentar hinterlassen