Economic Markers PRO
- Indikatoren
-
Flavio Javier Jarabeck
 We are a closed brotherhood of traders whose ultimate goal is to profit through well-studied, structured, and automated trades. As a result, we publish dozens of MT5 indicators (FREE and paid) to the global MQL5 community. 80% of our published products are high-quality free indicators so beginner
 - Version: 1.4
- Aktualisiert: 27 Januar 2021
- Aktivierungen: 20
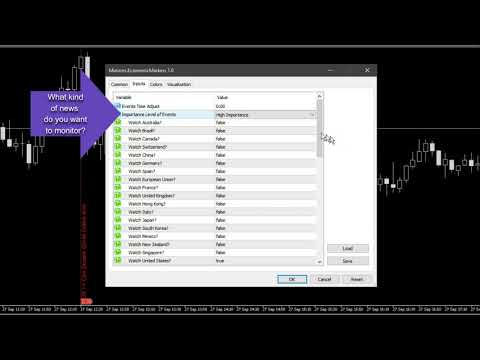
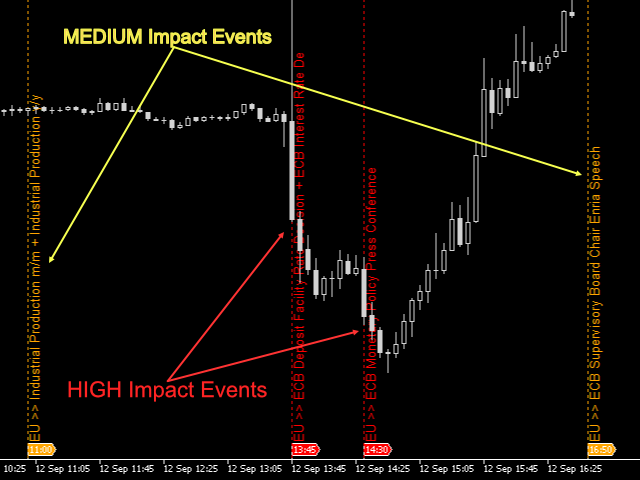
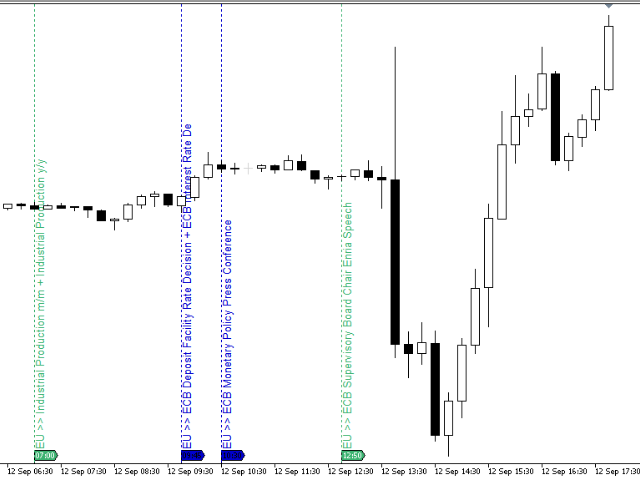
Holen Sie sich ganz einfach alle relevanten Wirtschaftsereignisse des aktuellen Tages als Marker direkt in Ihr Diagramm. Filtern Sie, welche Art von Markern Sie wünschen: nach Land (einzeln ausgewählt) und nach Wichtigkeit (hohe Relevanz, mittel, gering oder eine beliebige Kombination davon). Konfigurieren Sie die visuellen Anhaltspunkte nach Ihren Wünschen. Zusätzlich haben Sie die Möglichkeit, bis zu 5 persönliche Marker Ihrer eigenen Agenda hinzuzufügen. Mit Alerts und/oder mit Blackout-Perioden, wenn Sie es innerhalb eines Expert Advisors verwenden! Alles in einem Wirtschaftskalender-Indikator!
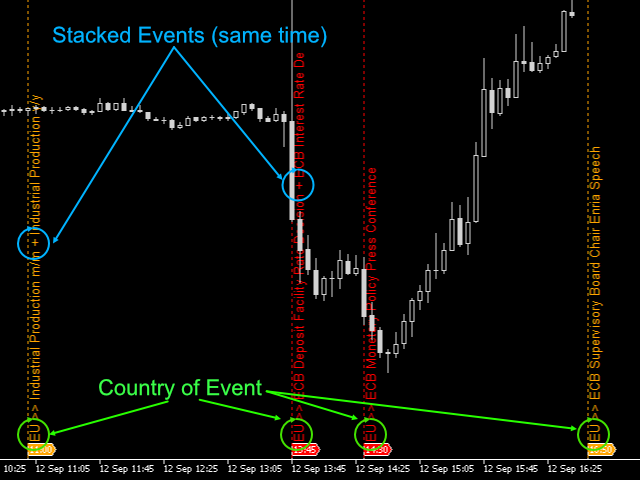
Wenn mehr als ein Ereignis auf die gleiche Zeit eingestellt ist, werden ihre Namen gestapelt und Sie werden die Nachrichten mit dem Pluszeichen (+) auf der Markierung zusammengeführt sehen. Natürlich werden zu lange oder zu viele Ereignisse zur gleichen Zeit automatisch abgeschnitten, da MT diese Art von Text in den Charts begrenzt...
EINSTELLUNGEN
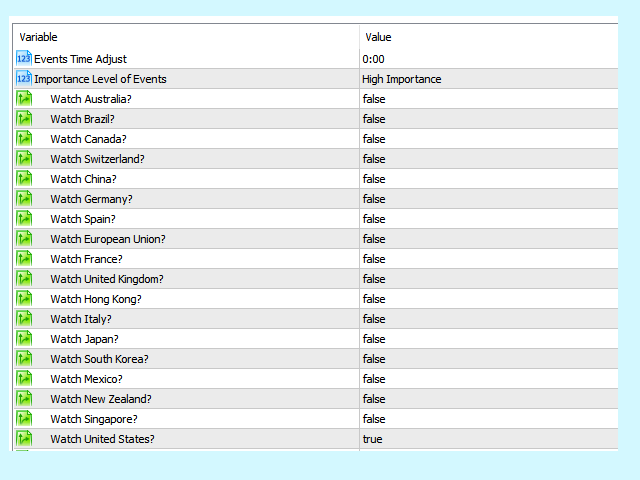
- Zeitanpassung - Addieren oder subtrahieren Sie Zeit, um die Ereignisse an Ihre Zeitzone/Serverzeit anzupassen. Aufgrund der Beschränkungen und des Durcheinanders, das es bedeutet, MT5-Clients auf der ganzen Welt zu verwenden, um alle Märkte weltweit zu bedienen, ist diese Anpassung offen für den Benutzer, um Fehler bei der automatischen Berechnung der richtigen Ereigniszeit für Ihre Plattform zu vermeiden. Benutzen Sie einfach die Seite des MQL5 Wirtschaftskalenders, um die dortigen Ereignisse an Ihr Terminal anzupassen: www.mql5.com/en/economic-calendar
- Auswählbare Länder: Vereinigte Staaten, Europäische Union, Japan, Vereinigtes Königreich, Kanada, Australien, Schweiz, China, Neuseeland, Deutschland, Frankreich, Italien, Spanien, Brasilien, Südkorea, Hongkong, Singapur und Mexiko.
- Auswählbare Wichtigkeitsstufen: Geringe Auswirkung, Mittlere Auswirkung, Hohe Auswirkung, Niedrig+Mittel, Mittel+Hoch, Niedrig+Mittel+Hoch.
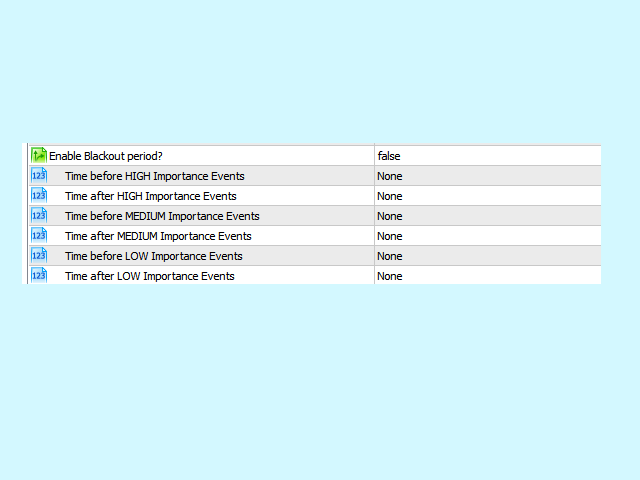
- Individuell aktivierbare Blackout-Perioden für Ereignisse von HOHER, MITTLERER und NIEDRIGER Bedeutung - Startzeit und Endzeit.
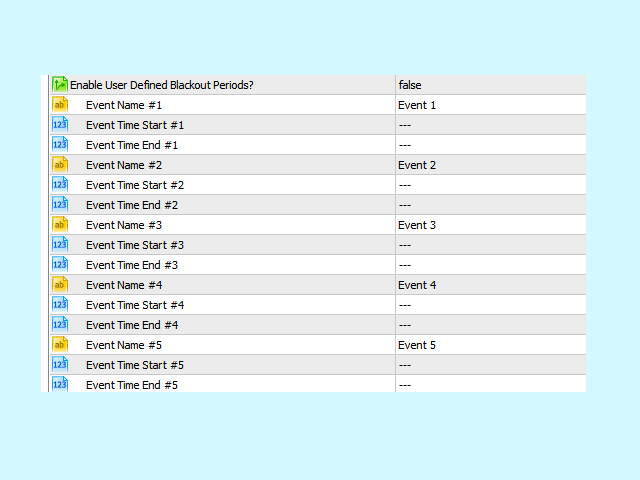
- Benutzerdefinierte Blackout-Perioden - bis zu 5 (fünf).
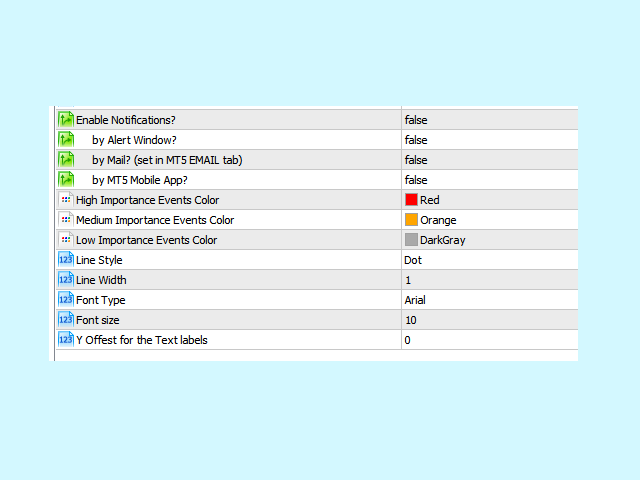
- Optionale Warnungen per Popup-Fenster, E-Mail und/oder Mobile App.
- Individuelle Farben für Markierungen (geringe, mittlere und hohe Bedeutung)
- Linien-Stile
- Linienbreite
- Schriftart und Schriftgröße für Ereignisnamen.
- Y-Achsen-Offset für benutzerdefiniertes Auffüllen der Ereignisnamen.
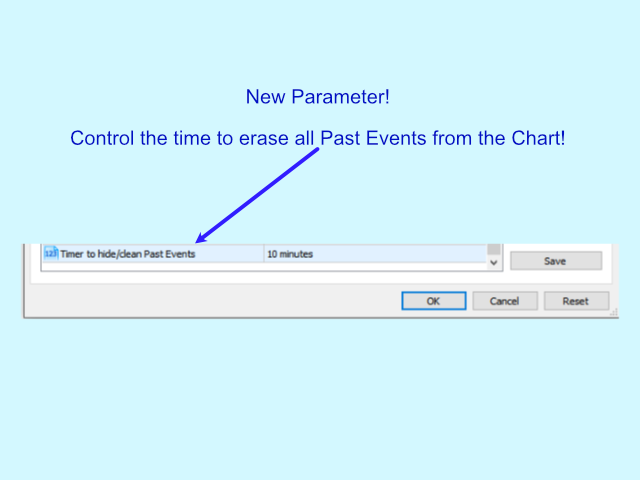
- Timer zum Bereinigen/Löschen aller vergangenen Ereignisse aus dem Diagramm
Expert Advisor Messwerte:
Puffer #0 - Index #0 - 0=Keine Blackout-Periode / 1=Blackout-Periode
Buffer #1 - index #0 - Wichtigkeitsgrad der gezeichneten Nachrichten, gemäß dem Metaquotes News Stream Service (1=Niedrig 2=Mittel 3=Hoch 4=Benutzer erstellt)
Die vollständige Dokumentation finden Sie unter:
http://www.minionslabs.com/news/indicators/economic-markers-pro-documentation-for-eas/
Wichtige Hinweise:
- Aufgrund der Art der Datenzufuhr funktioniert dieser Indikator NICHT mit dem Strategy Tester.
- Wenn Sie die Plattform an einem neuen Tag starten und der Markt noch geschlossen ist, werden alle Kalenderereignisse korrekt geladen und auf dem Chart dargestellt, es sei denn, die Registerkarte Experten (Log) meldet einen Fehler beim Laden der Kalenderereignisse. Sie werden Ihnen erst angezeigt, wenn der neue Tag tatsächlich neue Balken aufzeichnet.
- Um die Nachrichten in Ihrem Diagramm im Vordergrund zu sehen, müssen Sie die Funktion "Chart Shift" aktivieren, die absichtlich auf der rechten Seite Ihres Diagramms Platz schafft. Und Sie können den kleinen "Griff" verwenden, um die Menge des benötigten Platzes zu kontrollieren.
Langes und erfolgreiches Leben!
;)
Es ist leider nicht möglich alle Termine Low+Medium+High anzuzeigen jedoch ALLES in der Vergangenheit vollständig auszublenden. z.B. bleibt bei EUR/USD immer ein Termin störend im Chart stehen, dieser ist zwar "ganztägig" dennoch sollte das ausblendbar sein, wenn man nur zukünftige Termine sehen will.
Unfortunately, it is not possible to display all Low+Medium+High dates, but it is possible to completely hide EVERYTHING in the past. For example, with EUR/USD, one date always remains annoyingly in the chart. Although it is "all day", it should still be possible to hide it if you only want to see future dates.