Price Trail Chart
- Indikatoren
-
Flavio Javier Jarabeck
 We are a closed brotherhood of traders whose ultimate goal is to profit through well-studied, structured, and automated trades. As a result, we publish dozens of MT5 indicators (FREE and paid) to the global MQL5 community. 80% of our published products are high-quality free indicators so beginner
 - Version: 1.1
- Aktualisiert: 6 Juni 2020
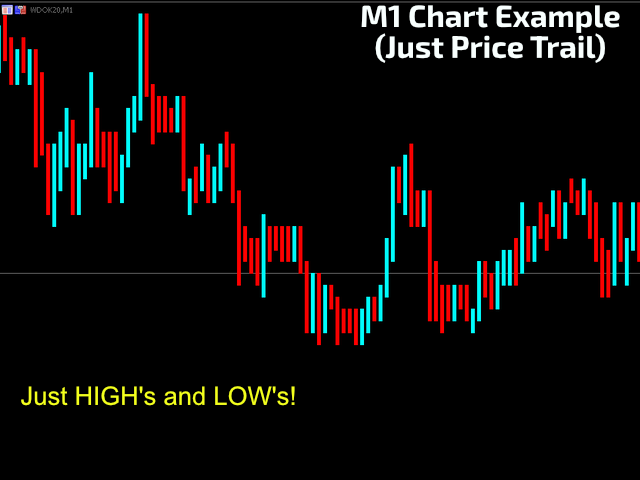
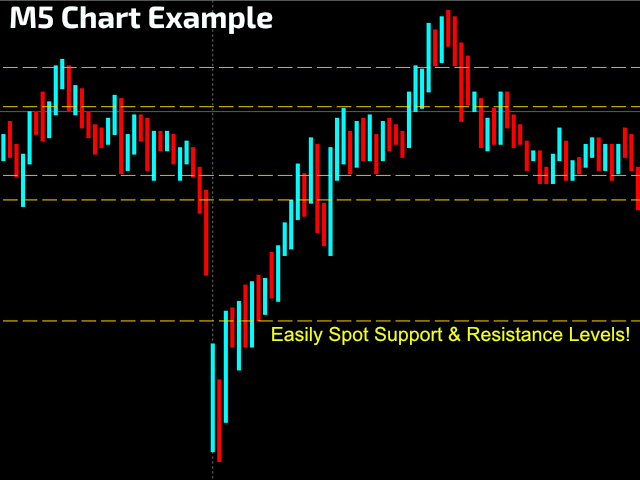
Für diejenigen, die Kerzen in den unteren Zeitrahmen (M1 bis M15) hassen, haben wir eine saubere neue Methode zur Verfolgung der Preisbewegung und -verschiebung (Volatilität) "erfunden", den Price Trail Chart. Das große "Geheimnis" besteht darin, diese lästigen Kerzendochte loszuwerden und die gesamte Kerze ohne sie zu zeichnen. Auf diese Weise erhalten wir ein saubereres Diagramm und eine neue Sicht auf den Kursverlauf. Keine Open- oder Close-Markierungen, nur LOW's und HIGH's, eine komplette Kerze.
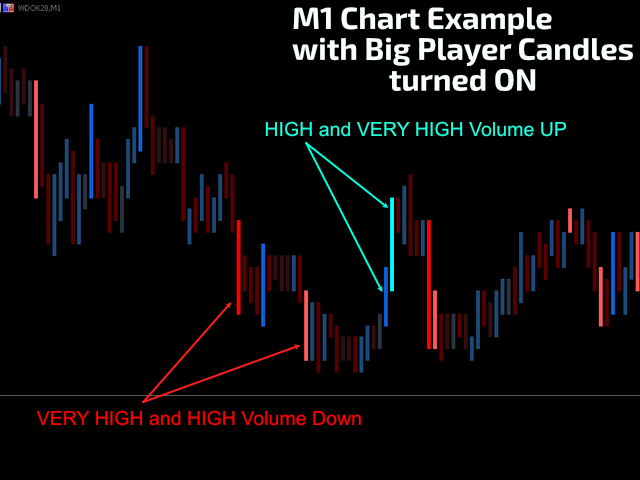
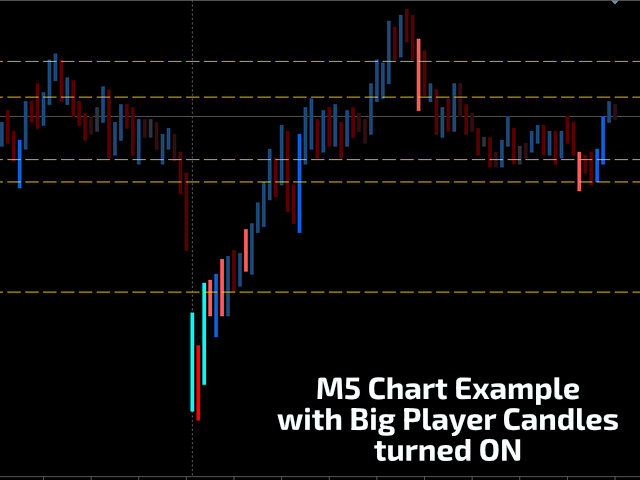
Zusätzlich haben wir einen Volumenmonitor aus unserem Best Downloaded Indikator namens Big Player Candles eingefügt, der die verschiedenen Volumina, die bei jeder Kerze auftreten, mit Farben Ihrer Wahl malt.
Probieren Sie es aus, Sie werden überrascht sein von der neuen, ruhigen Art, einen Kurs-Chart zu betrachten: nur der Kursverlauf!
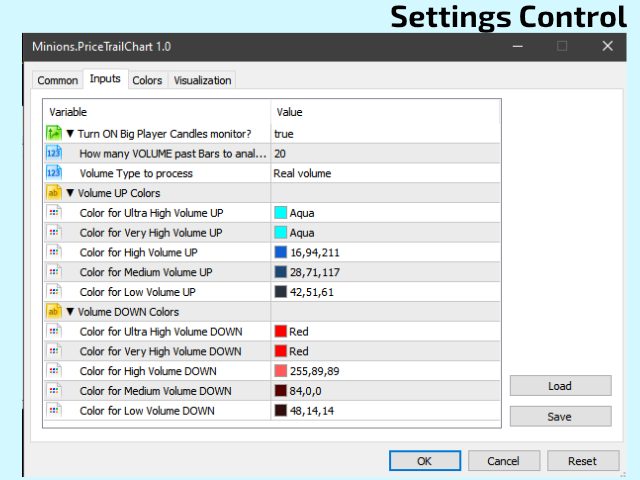
EINSTELLUNGEN
- Möglichkeit, den Big Player Candles Monitor ein- und auszuschalten.
- Zu analysierende Volumenperiode (Balken).
- Zu verarbeitender Volumentyp: Echtes Volumen / Tick-Volumen
- 5 Farben für die UP-Bewegung: Niedrig, Mittel, Hoch und Ultrahoch.
- 5 Farben für die Abwärtsbewegung: Niedrig, Mittel, Hoch und Ultrahoch.
Wie immer, wenn Ihnen dieser Indikator gefällt, bitte ich Sie nur um ein kleines Review (kein Kommentar, sondern ein REVIEW!)...
Das wird mir sehr viel bedeuten... Und auf diese Weise kann ich weiterhin coole Sachen kostenlos verschenken...
Ohne Bedingungen! Niemals!
Lebe lang und in Frieden!
;)


super, thanks for share