Candlestick Pattern Teller
- Indikatoren
-
Flavio Javier Jarabeck
 We are a closed brotherhood of traders whose ultimate goal is to profit through well-studied, structured, and automated trades. As a result, we publish dozens of MT5 indicators (FREE and paid) to the global MQL5 community. 80% of our published products are high-quality free indicators so beginner
 - Version: 1.2
- Aktualisiert: 6 Juni 2020
- Aktivierungen: 20
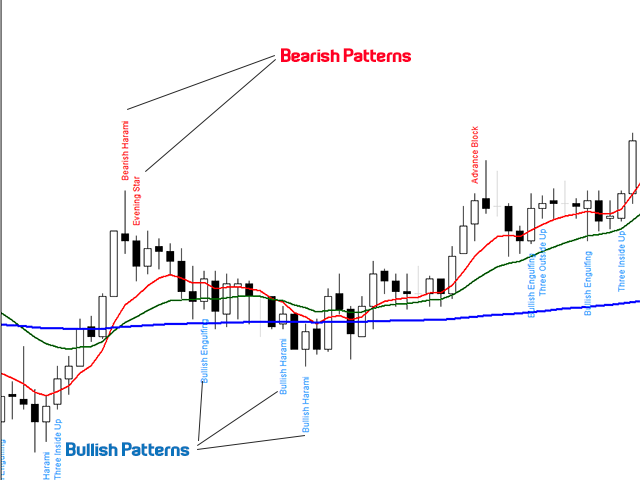
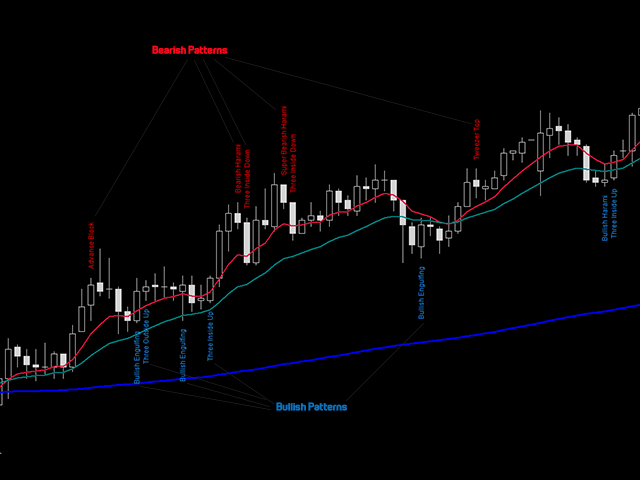
Minions Labs' Candlestick Pattern Teller
Es zeigt auf Ihrem Chart die Namen der berühmten Candlestick Patterns Formationen, sobald sie erstellt und bestätigt werden. Kein Nachmalen.
Auf diese Weise wird Anfängern und auch professionellen Händlern, die Schwierigkeiten haben, Candlestick-Muster visuell zu erkennen, die Analyse in einem viel einfacheren Format ermöglicht. Wussten Sie, dass es im Allgemeinen 3 Arten von Menschen gibt: Visuell, auditiv und kinästhetisch? Schämen Sie sich nicht, wenn Sie Candlestick-Muster nicht leicht erkennen können. Wir helfen Ihnen dabei!
Musterliste
Der Candlestick Pattern Teller wurde für den *DayTrader* entwickelt. Aus diesem Grund enthalten unsere Muster keine Muster mit Preislücken. Dieser Indikator wird also für liquide Symbole empfohlen, und auch die Verwendung in liquiden Symbolen wird Ihnen verlässlichere Muster liefern. Die Liste:
Bullische Muster
- Bullish Engulfing : : Tsutsumi
- Hammer:: Kanazuchi
- Bullenstarkes Harami :: Harami
- Super Bullish Harami ::(Schöpfung von Minions Labs)
- Umgekehrter Hammer :: Tohba
- Durchdringende Linie :: Kirikomi
- Stierischer Doji-Stern :: Doji Fahrrad
- Abstiegsblock :: Saki Zumari Kudari
- Drei innen oben :: Harami Age
- Drei aussen oben :: Tutsumi Aga
- Bullish Stick Sandwich :: Gyakusashi Niten Zoko
- Bullish Squeeze Alert :: Tsukami
- Steigende Drei :: Uwa Banare Sanpoo Ohdatekomi
- Bullish Three Line Strike :: Sante Uchi Karasu No Bake Sen
- Pinzette Unten :: Kenukizoko
- Morgenstern :: Sankawa Ake No Myojyo
- Stierischer Kreisel
- Oberhalb des Magens
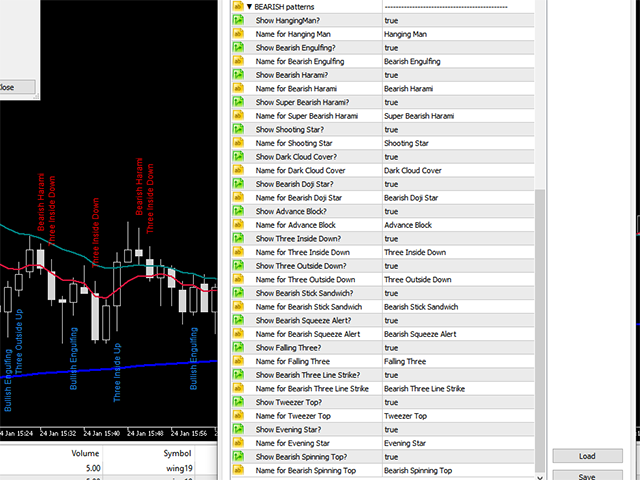
Bärische Muster
- Bearish Engulfing :: Tsutsumi
- Hanging Man :: Kubitsuri
- Bärischer Harami :: Harami
- Super Bearish Harami ::(Schöpfung von Minions Labs)
- Sternschnuppe :: Nagare Boshi
- Dunkle Wolkendecke :: Kabuse
- Bearish Doji Star :: Doji Bike
- Vorwärts-Block :: Saki Zumari
- Drei Innen nach unten :: Harami Sage
- Drei Außen unten :: Tutsumi Sage
- Bärischer Stock-Sandwich :: Gyakusashi Niten Zoko
- Bärischer Quetschungsalarm :: Tsukami
- Fallender Dreier :: Uwa Banare Sanpoo Ohdatekomi
- Bärischer Drei-Linien-Schlag :: Sante Uchi Karasu No Bake Sen
- Pinzette oben :: Kenukitenjo
- Abendstern :: Sankawa Ake No Myojyo
- Bärischer Kreisel
- Unterhalb des Magens
We named the "Super Bullish Harami" to a variation pattern that is more powerfull, or at least, have more probability of a reversal than the traditional Bullish and Bearish Harami. It consists of the whole candle (high,Low, Open, Close) being engulfed by just (and only) the body of the previous candle.
Eigenschaften
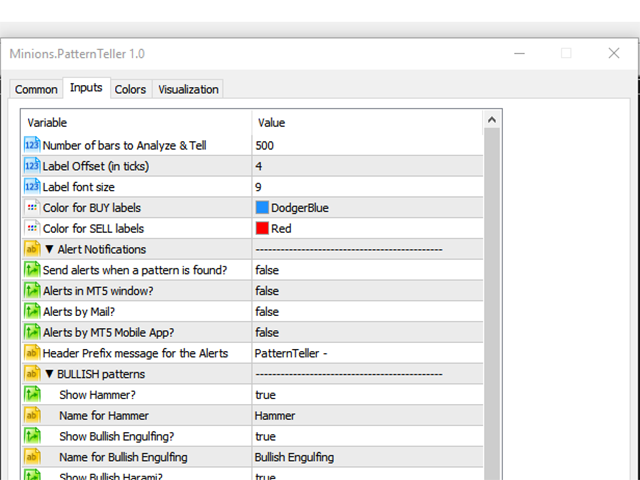
- Sie können die Anzahl der zu analysierenden Bars in der Vergangenheit festlegen, um Ressourcen Ihres MT5 zu sparen.
- Stellen Sie den Abstand (Offset) der Etiketten von den Candlesticks ein, so nah oder so weit wie Sie wollen.
- Steuern Sie die Schriftgröße.
- Legen Sie die Farbe der Bullish- und Bearish-Labels fest.
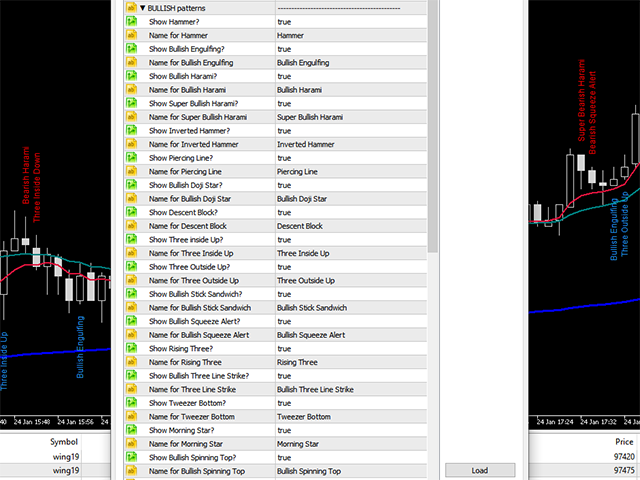
- Aktivieren/Deaktivieren jedes Candlestick-Musters auf dem Chart.
- Möglichkeit, den Namen jedes Musters zu ändern, so dass Sie die von Ihnen bevorzugten Namen Ihrer Studie/Methodik in Ihrem Chart verwenden können.
- Warnungen durch: Fenster-Popup, E-Mail, MT5 Mobile App. Alle individuell anpassbar (ein/aus).
| Wenn Sie diesen Indikator auf einem Live- oder Demo-Konto ausprobieren möchten, lesen Sie bitte die Anleitung in unserem Blog: https://www.mql5.com/pt/blogs/post/746804 |
|---|
Sie haben eine Funktion nicht gefunden, die Sie benötigen?
Kein Produkt ist für jeden perfekt. Wenn Sie glauben, dass Sie eine Funktion in unserem Produkt vermissen, schicken Sie uns einfach eine Nachricht. Wir lieben Feedback!
Über uns
Flavio Jarabeck ist der Eigentümer von MinionsLabs.com, einem Unternehmen, das sich darauf konzentriert, das Wissen und die Erfahrung professioneller Händler durch automatisierte Handelsroboter zu nutzen, um ihnen die Möglichkeit zu geben, neue Chancen und Strategien in neuen Märkten und Vermögenswerten zu suchen.
;)

Very good, free forever 1000 activations, recommended!