Market Momentum PRO
- Indikatoren
-
Flavio Javier Jarabeck
 We are a closed brotherhood of traders whose ultimate goal is to profit through well-studied, structured, and automated trades. As a result, we publish dozens of MT5 indicators (FREE and paid) to the global MQL5 community. 80% of our published products are high-quality free indicators so beginner
 - Version: 1.3
- Aktualisiert: 8 Mai 2023
- Aktivierungen: 20
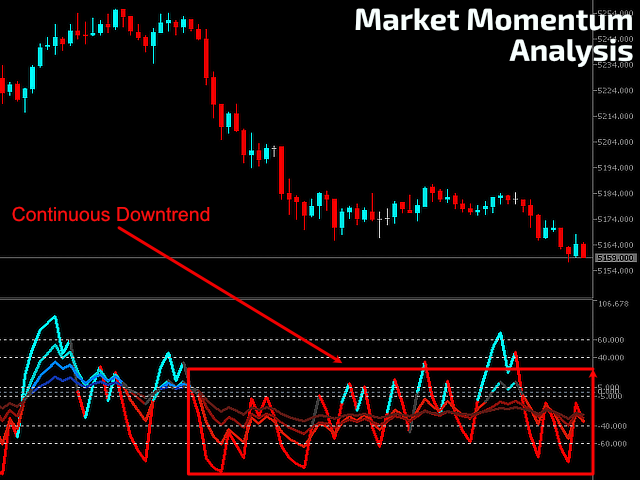
Der Market Momentum-Indikator basiert auf dem Volume Zone Oscillator (VZO), der von Waleed Aly Khalil in der Ausgabe 2009 der Zeitschrift der International Federation of Technical Analysts vorgestellt wurde, und bietet eine neue Sichtweise auf diese wertvollen Marktdaten, die oft missverstanden und vernachlässigt werden: VOLUME. Mit diesem neuen Ansatz des "Sehens" von Volumendaten können Händler besser auf das Marktverhalten schließen und ihre Chancen auf einen erfolgreichen Handel erhöhen.
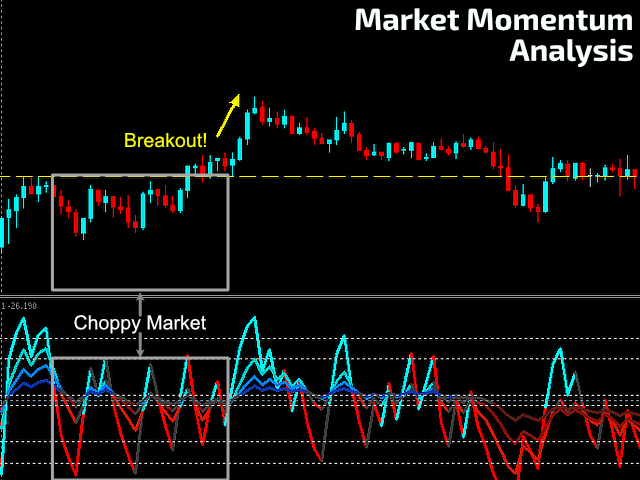
"The VZO is a leading volume oscillator; its basic usefulness is in giving leading buy/sell signals based on volume conditions, also to identify overbought/oversold volume conditions, along with mega overbought/oversold situations which lead to a change in sentiment, and most probably, leads to change of the current trend in the timeframe being studied."
"Dem Preis geht das Volumen voraus; das ist ein weiterer wichtiger Gedanke in der technischen Analyse. Wenn das Volumen in einem Aufwärtstrend zu sinken beginnt, ist dies in der Regel ein Zeichen dafür, dass der Aufwärtstrend bald zu Ende geht."
"Wir sind der Meinung, dass das Volumen den gleichen Stellenwert haben sollte wie der Preis und dass es genau beobachtet werden sollte.
"Einer der Hauptvorteile der VZO besteht darin, dass wir erkennen können, in welcher Zone sich das Volumen befindet, um zu entscheiden, auf welcher Seite wir reiten sollten."
-- Waleed Aly Khalil
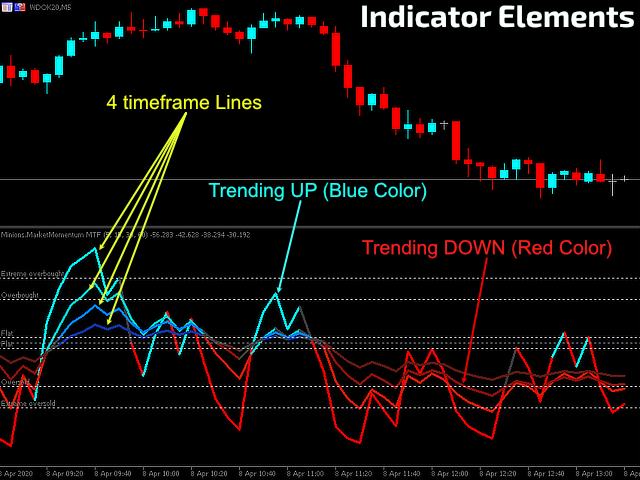
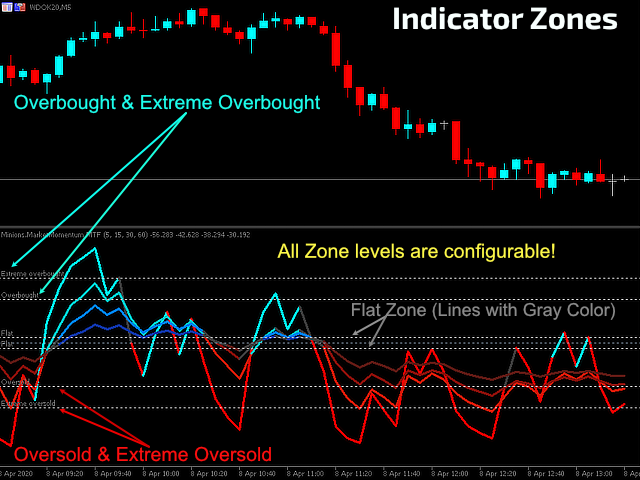
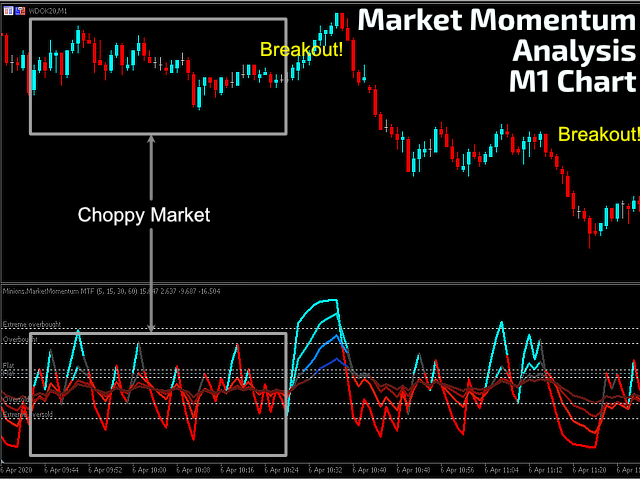
Der Marktmomentum-Indikator zeigt Händlern visuell an, wann sich der Markt über oder unter der NULL-Linie befindet und gibt die wahrscheinliche "Seite" des Marktes an. Sie können anpassen, wann der Indikator die Oszillatorlinien einfärbt, indem er die "Flat"-Werte ändert.
Sie können auch die Theorie des Überschreitens der überkauften und überverkauften Schwellenwerte testen. Oder Sie geben die Zonen ein und achten darauf, wann der Oszillator die Zonen verlässt, achten auf Divergenzen, usw...
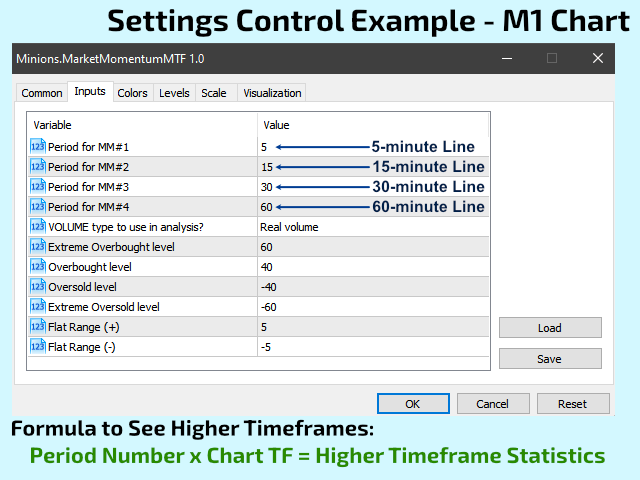
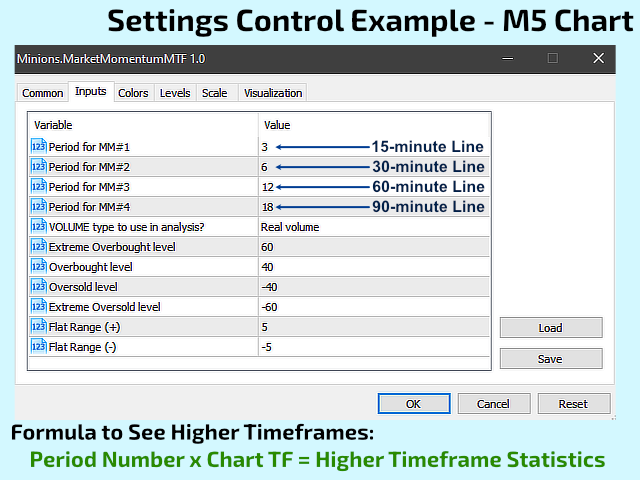
** Der Clou dieser PRO-Version ist die Hinzufügung von 4 möglichen Zeitrahmenberechnungen, die innerhalb des Indikators hinzugefügt werden können. Auf diese Weise können Sie die visuelle Statistik von 4 (VIER) verschiedenen Zeitrahmen innerhalb desselben Indikatorfensters haben. Bitte sehen Sie sich die Screenshots unten mit allen Beispielen und Anweisungen an.
EINSTELLUNGEN
- Analysezeitraum (Balken)
- Zu analysierende Volumenart (Ticks oder reales Volumen)
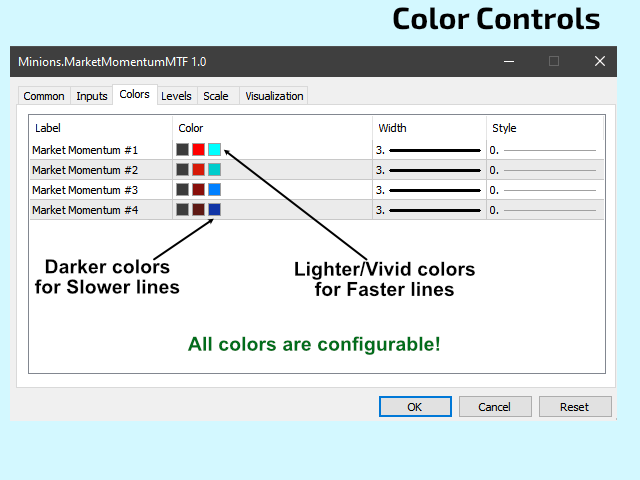
- Unterfenster Indikator Levels:
- Überkauft
- Extrem überkauft
- Überverkauft
- Extrem überverkauft
- Flaches Marktniveau
- Die optimalen Einstellungen hängen ausschließlich von der Analyse des Symbols und dem Zeitrahmen ab, in dem Sie handeln möchten.
- Dies ist ein großartiger Indikator, aber er ist NICHT magisch. Verwenden Sie ihn mit anderen Tools/Analysen, um die Chancen Ihres Handels zu erhöhen.
Wenn Sie die Basisversion von Market Momentum testen möchten, erhalten Sie hier eine KOSTENLOSE Kopie davon...
Leben Sie lange und in Wohlstand!
;)