Economic Markers PRO
- Göstergeler
-
Flavio Javier Jarabeck
 We are a closed brotherhood of traders whose ultimate goal is to profit through well-studied, structured, and automated trades. As a result, we publish dozens of MT5 indicators (FREE and paid) to the global MQL5 community. 80% of our published products are high-quality free indicators so beginner
 - Sürüm: 1.4
- Güncellendi: 27 Ocak 2021
- Etkinleştirmeler: 20
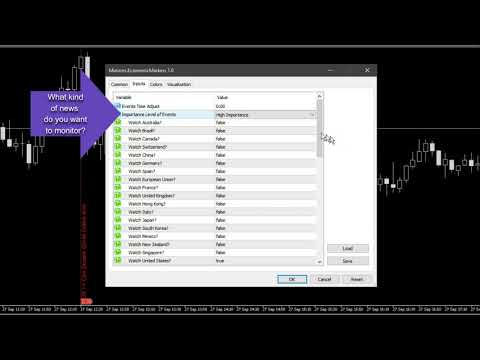
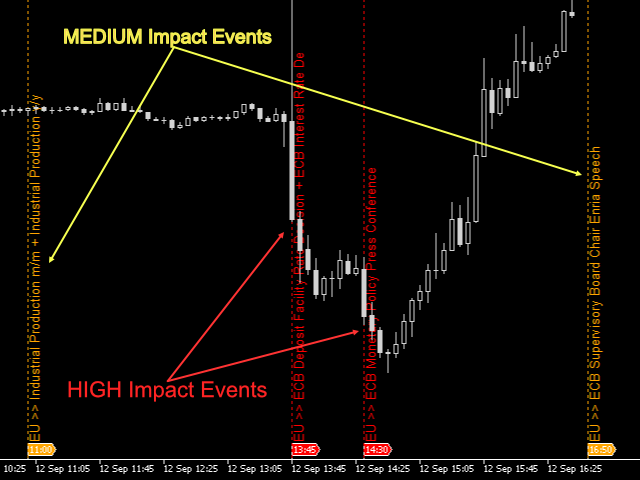
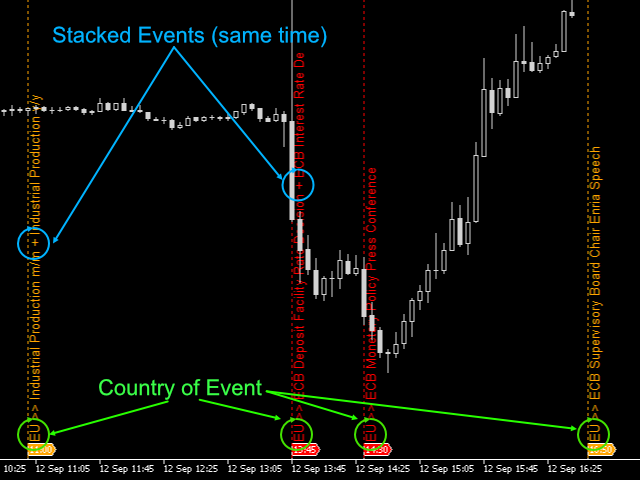
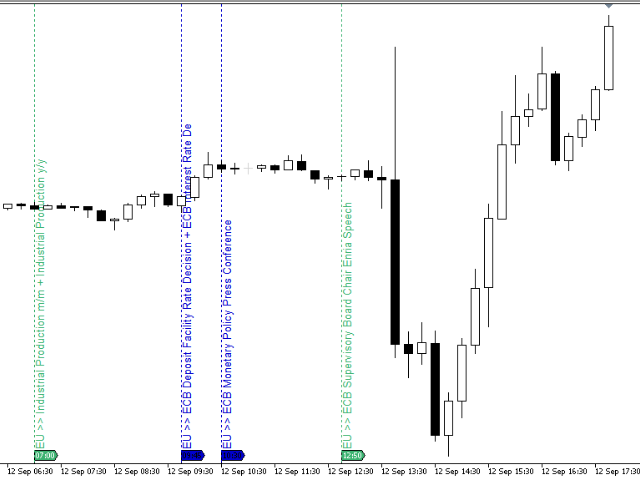
Easily get all relevant economic events of the current day right into your chart, as markers. Filter what kind of markers do you want: by country (selected individually) and by Importance (High relevance, Medium, Low or any combination of these). Configure the visual cues to your liking. Additionaly you have the ability to add up to 5 personal markers of your own agenda. With Alerts and/or with blackout periods, if you are using it within an Expert Advisor! All in one Economic Calendar indicator!
If there is more than one event set to the very same time, their Names will be stacked and you will see the messages merged with the plus (+) sign on the marker. Obviously that long or too much events on the same time will be automatically trimmed due to MT's limitation of this kind of text over the charts...
SETTINGS
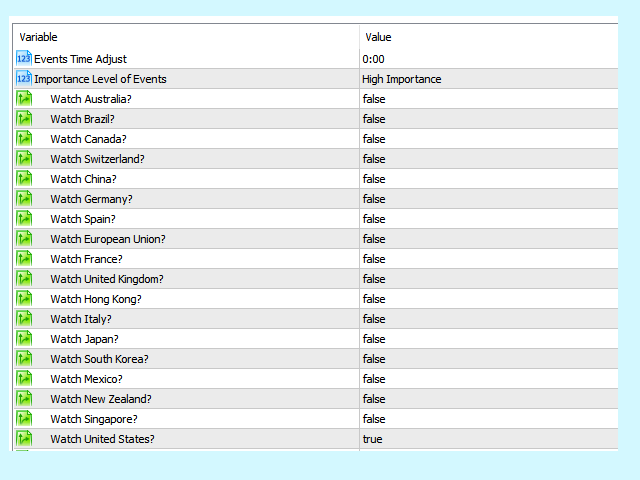
- Time Adjust - Add or subtract time to adjust and match the Events to your timezone/server time. Due to the limitations and mess that is to use MT5 clients all over the world to operate all markets worldwide, this adjustment is open to the user, avoiding mistakes in automatically trying to calculate the proper Event time for your platform. Just use the MQL5's Economic Calendar page to match the events there to your terminal: www.mql5.com/en/economic-calendar
- Selectable Countries: United States, European Union, Japan, United Kingdom, Canada, Australia, Switzerland, China, New Zealand, Germany, France, Italy, Spain, Brazil, South Korea, Hong Kong, Singapore and Mexico.
- Selectable Importance Levels: Low Impact, Medium Impact, High Impact, Low+Medium, Medium+High, Low+Medium+High.
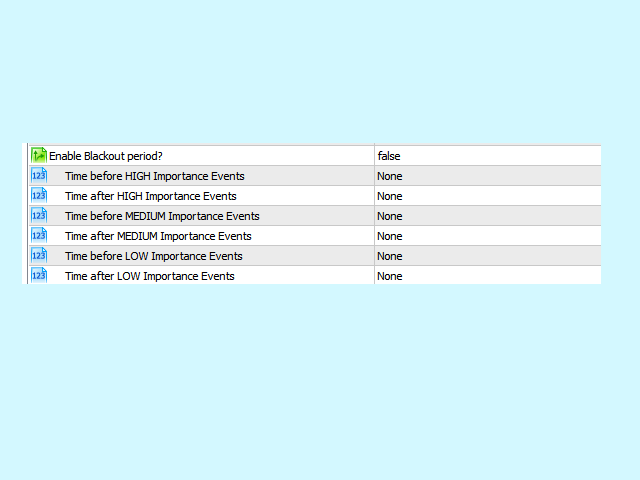
- Individually enable Blackout Periods for HIGH, MEDIUM and LOW importance events - Start time and End time.
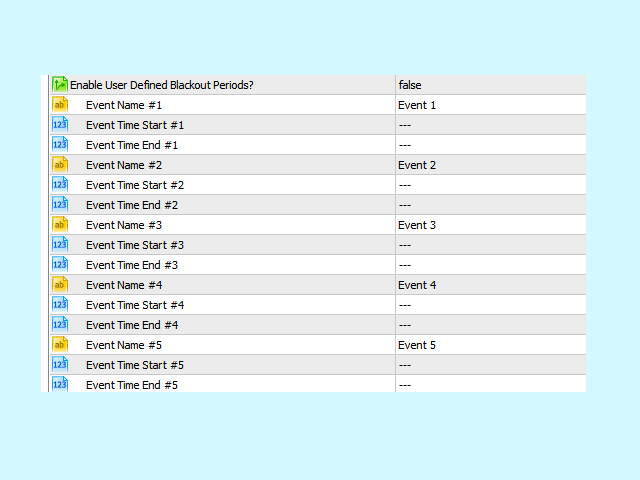
- User Defined Blackout Periods - up to 5 (five).
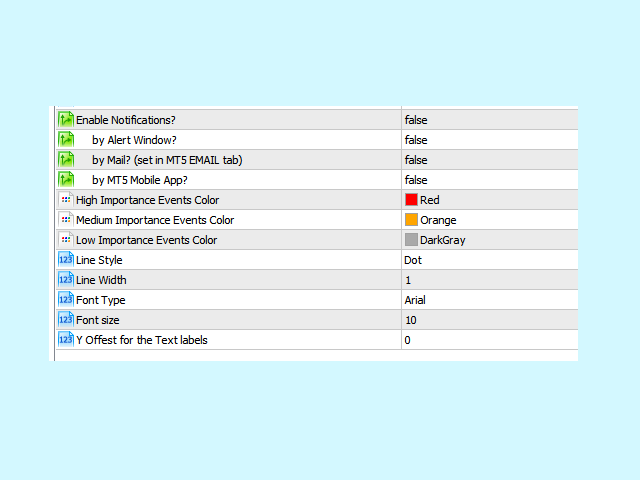
- Optional Alerts by Popup Windows, eMail and/or Mobile App.
- Individual Colors for Markers (Low, Medium and High impact)
- Line Styles
- Line Width
- Font Type and Font Size for Event Names.
- Y-axis offset for custom-padding the Event Names.
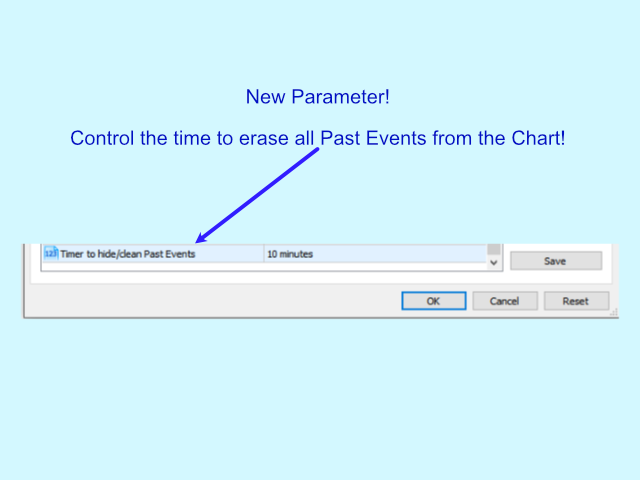
- Timer to clean/erase all past events from chart
Expert Advisor Readings:
Buffer #0 - index #0 - 0=No Blackout period / 1=Blackout Period
Buffer #1 - index #0 - Importance Level of the news plotted, according to the Metaquotes News Stream Service (1=Low 2=Medium 3=High 4=User Created)
For the FULL Documentation, go to:
http://www.minionslabs.com/news/indicators/economic-markers-pro-documentation-for-eas/
Important Notes:
- Due to the nature of the data feeding process this indicator DOES NOT WORK with the Strategy Tester.
- When starting the platform on a new day and the market is still closed, unless the Experts tab (log) says that there is an error loading the Calendar Events, all of them were correctly loaded and plotted on the chart. They will only be shown to you when the new day really starts plotting new bars.
- In order to see the news coming upfront in your chart you need to enable the Chart Shift feature - space created intentionally at the right of your chart. And you can use the little "handle" to control the ammount of space needed.
Live Long and Prosper!
;)
Es ist leider nicht möglich alle Termine Low+Medium+High anzuzeigen jedoch ALLES in der Vergangenheit vollständig auszublenden. z.B. bleibt bei EUR/USD immer ein Termin störend im Chart stehen, dieser ist zwar "ganztägig" dennoch sollte das ausblendbar sein, wenn man nur zukünftige Termine sehen will.
Unfortunately, it is not possible to display all Low+Medium+High dates, but it is possible to completely hide EVERYTHING in the past. For example, with EUR/USD, one date always remains annoyingly in the chart. Although it is "all day", it should still be possible to hide it if you only want to see future dates.