Money Flow Index EA Friendly
- Indikatoren
-
Flavio Javier Jarabeck
 We are a closed brotherhood of traders whose ultimate goal is to profit through well-studied, structured, and automated trades. As a result, we publish dozens of MT5 indicators (FREE and paid) to the global MQL5 community. 80% of our published products are high-quality free indicators so beginner
 - Version: 1.2
- Aktualisiert: 6 Juni 2020
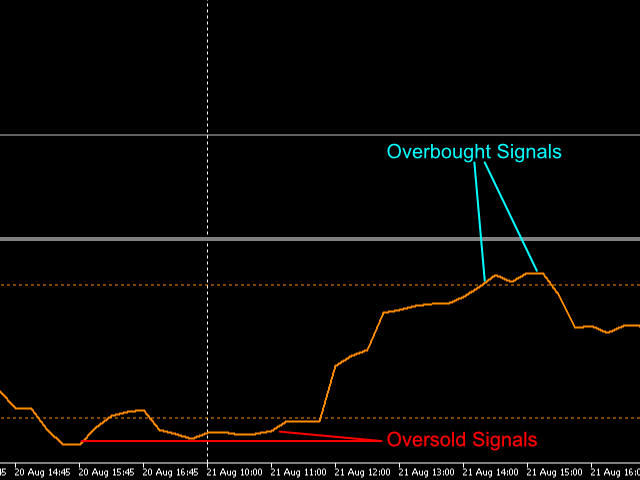
Der traditionelle Money Flow Index-Indikator, dieses Mal EA-freundlich. Es gibt 3 Puffer, die von EAs verwendet werden können, um automatisch die überkauften und überverkauften Bedingungen des Kurses zu analysieren. Verwenden Sie einfach die traditionelle iCustom()-Funktion, um diese Signale zu erhalten.
Die Berechnung des Money Flow Index basiert auf dem traditionellen MFI-Indikator von Metaquote.
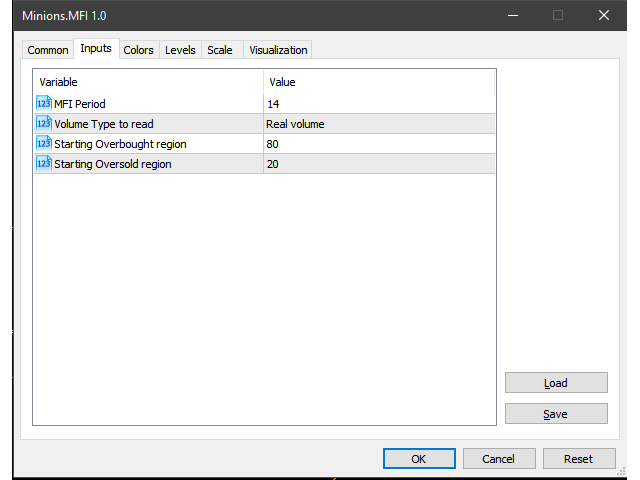
EINSTELLUNGEN
- MFI-Zeitraum
- Art des zu analysierenden Volumens (reales Volumen oder Ticks)
- Beginn des überkauften Bereichs
- Beginnende überverkaufte Region
VERWENDUNG MIT EAs
- Puffer #0: MFI-Wert
- Puffer #1: 0=Überkaufter Zustand ist AUS / 1=Überkaufter Zustand ist EIN
- Puffer #2: 0=Überverkaufter Zustand ist AUS / 1=Überverkaufter Zustand ist EIN
Bitte beachten Sie, dass dieser Indikator WIEDERHOLT! Der aktuelle Balken kann also wiederholt die Signale EIN und AUS anzeigen .
Wenn Ihnen dieser Indikator gefällt, bitte ich Sie nur um ein kleines Review (kein Kommentar, sondern ein REVIEW!)...
Das wird mir sehr viel bedeuten... Und auf diese Weise kann ich weiterhin Cool Stuff for Free verschenken...
Ohne Bedingungen! Niemals!
Lebe lang und in Frieden!
;)


A good indicator to use as same window to RSI. Thank you Flavio!