KT Currency Strength and Correlation
- Indikatoren
-
KEENBASE SOFTWARE SOLUTIONS
 Keenbase Trading builds professional MetaTrader 4 and MetaTrader 5 indicators and Expert Advisors used by traders worldwide.
 - Version: 1.2
- Aktualisiert: 19 Februar 2020
- Aktivierungen: 10
Wenn Sie Forex handeln, kann detailliertes Wissen über die Währungsstärke und die Korrelation zwischen Währungspaaren Ihr Trading auf ein neues Niveau heben. Die Korrelation hilft, Ihr Risiko zu halbieren, während die Stärkenanalyse Ihre Gewinne maximieren kann.
Dieser Indikator bietet einen hybriden Ansatz zur Auswahl der besten Währungspaare, basierend auf einer Kombination aus Stärkenanalyse und Korrelation.
Wie man die Währungsstärkenanalyse verwendet
Angenommen, Ihre Handelsstrategie bietet eine Kaufgelegenheit bei AUD/JPY, aber mithilfe der KT-Währungsstärkenanalyse stellen Sie fest, dass der JPY stärker wird als der AUD. In diesem Fall wird der Handel wahrscheinlich mit einem Verlust enden. Mit diesem Indikator können Sie solche Verluste leicht vermeiden.
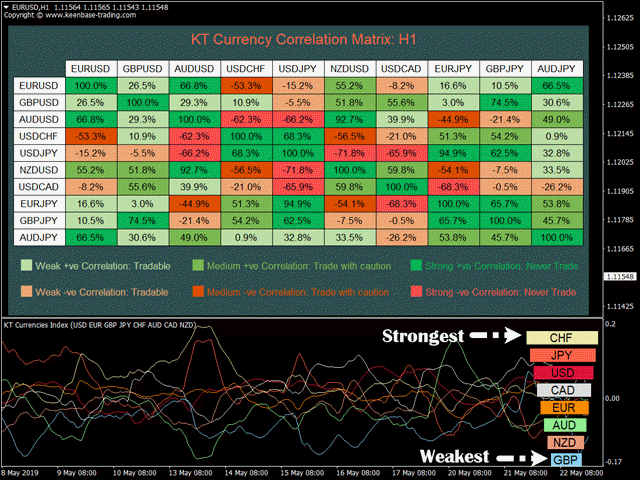
Wie man die Währungspaarkorrelation verwendet
Da diese Paare stark korreliert sind, würde der gleichzeitige Handel Ihr Risiko verdoppeln. Wenn Sie bei NZD/USD einen Verlust erleiden, ist es sehr wahrscheinlich, dass Sie auch bei GBP/JPY einen Verlust erleiden.
Funktionen
- Finden Sie schnell die stärkste und schwächste Währung, um Handelsmöglichkeiten zu bestätigen.
- Halbieren oder dritteln Sie Ihr Risiko, indem Sie stark korrelierte Paare vermeiden.
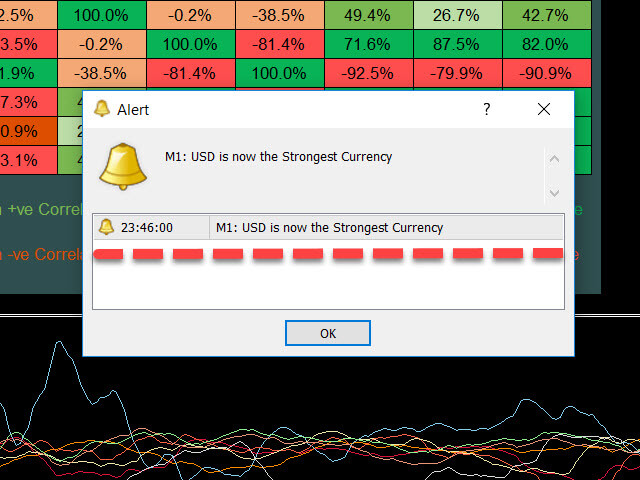
- Erhalten Sie Benachrichtigungen, wenn eine Währung die stärkste oder schwächste innerhalb des Währungskorbs wird.
- Analysieren Sie die Stärkenübersicht mit einer Währungspyramide, die die Währungen von stark zu schwach anordnet.
Detaillierte Währungsstärkenanalyse
- Auswahl des besten Währungspaares
Angenommen, Ihre Strategie bietet Kaufchancen bei GBP/JPY und EUR/JPY. Da beide Paare stark positiv korreliert sind, würde der gleichzeitige Handel Ihr Risiko verdoppeln.
Mit der Währungspyramide können Sie erkennen, welche Währung (GBP oder EUR) stärker ist. Wenn GBP stärker ist, wählen Sie GBP/JPY. Wenn EUR stärker ist, entscheiden Sie sich für EUR/JPY.
- Vermeidung von Seitwärtsmärkten
Angenommen, Ihre Strategie bietet eine Kaufgelegenheit bei AUD/JPY. In der Währungspyramide sehen Sie, dass der Australische Dollar und der Japanische Yen nebeneinander angeordnet sind.
Dies zeigt eine Situation an, in der beide Währungen gleichzeitig stark oder schwach sind – eine typische Seitwärtsbewegung.
Detaillierte Währungspaarkorrelation
Allgemein gesprochen ist die Korrelation eine statistische Methode, um die Beziehung zwischen zwei Handelswerten zu messen. Die Währungspaarkorrelation zeigt, inwieweit zwei Währungspaare sich im selben, entgegengesetzten oder zufälligen Muster innerhalb eines bestimmten Zeitraums bewegen.
- Eine Korrelation von +1 steht für eine perfekte positive Korrelation: Beide Paare bewegen sich zu 100 % in die gleiche Richtung (z.B. EUR/USD und GBP/USD).
- Eine Korrelation von -1 bedeutet eine perfekte negative Korrelation: Beide Paare bewegen sich zu 100 % in entgegengesetzte Richtungen (z.B. EUR/USD und USD/CHF).
- Eine Korrelation von 0 zeigt keine Beziehung: Die Preisbewegungen sind zufällig und unabhängig.
- Stärke der positiven Korrelation
- Schwache positive Korrelation (10% bis 40%) = Handelbar
- Mittlere positive Korrelation (40% bis 60%) = Mit Vorsicht handeln
- Starke positive Korrelation (60% bis 100%) = Nicht handeln
- Stärke der negativen Korrelation
- Schwache negative Korrelation (-10% bis -40%) = Handelbar
- Mittlere negative Korrelation (-40% bis -60%) = Mit Vorsicht handeln
- Starke negative Korrelation (-60% bis -100%) = Nicht handeln