KT CCI Divergence MT5
- Indikatoren
-
KEENBASE SOFTWARE SOLUTIONS
 Keenbase Trading entwickelt professionelle MetaTrader 4- und MetaTrader 5-Indikatoren sowie Expert Advisors, die Trader dabei unterstützen, fundiertere Handelsentscheidungen zu treffen.
 - Version: 1.1
- Aktualisiert: 25 März 2022
- Aktivierungen: 5
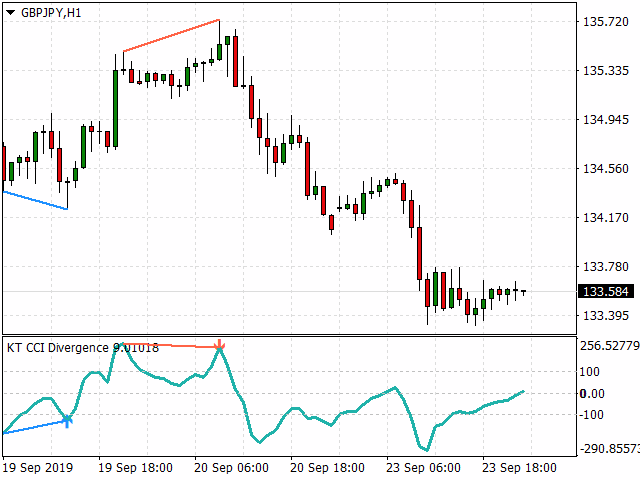
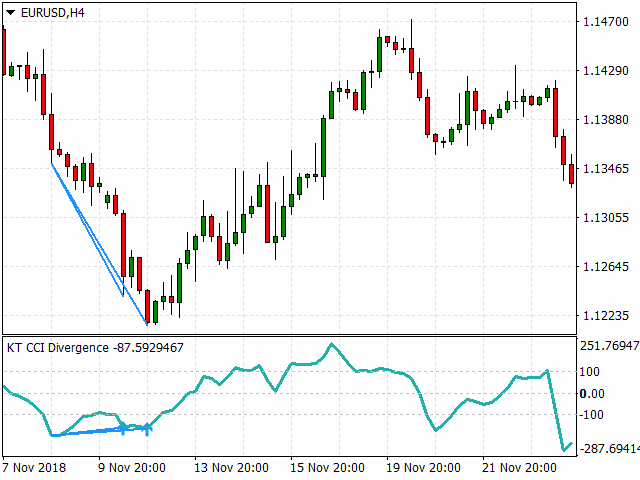
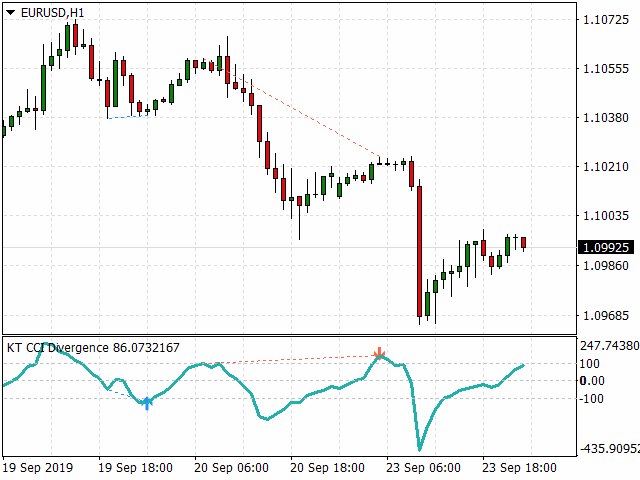
KT CCI Divergence zeigt die regelmäßige und versteckte Divergenz zwischen dem Preis und dem CCI-Oszillator an. Die Divergenz ist eines der wichtigsten Signale, das die bevorstehende Preisumkehr auf dem Markt anzeigt. Das manuelle Erkennen der Divergenz zwischen Preis und CCI kann eine hektische und zweideutige Aufgabe sein.
Einschränkungen der KT CCI-Divergenz
Die Verwendung der CCI-Divergenz als alleinstehendes Einstiegssignal kann riskant sein. Nicht jede Divergenz kann als ein starkes Umkehrsignal interpretiert werden. Um bessere Ergebnisse zu erzielen, sollten Sie versuchen, sie mit der Preisbewegung und der Trendrichtung zu kombinieren.
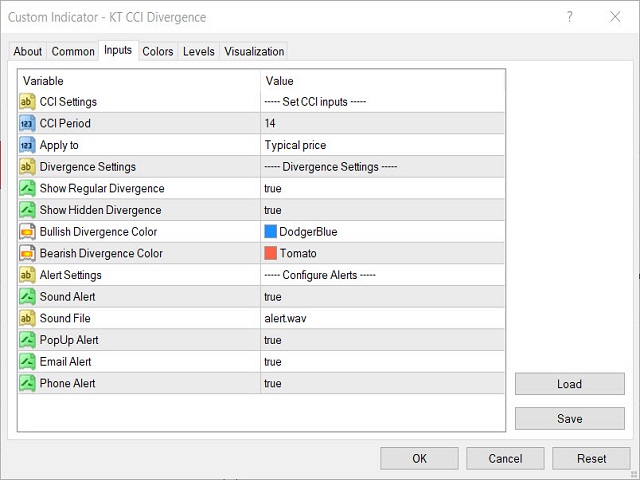
Merkmale
- Markiert regelmäßige und versteckte Divergenzen zwischen dem Preis und dem CCI-Oszillator.
- Unsymmetrische Divergenzen werden für eine bessere Genauigkeit und geringere Unübersichtlichkeit verworfen.
- Unterstützt Handelsstrategien für Trendumkehr und Trendfortsetzung.
- Vollständig kompatibel für die Einbettung in Expert Advisors.
- Kann sowohl für den Einstieg als auch für den Ausstieg verwendet werden.
- Alle Metatrader-Warnungen sind verfügbar.
Was genau ist eine Divergenz?
Im Allgemeinen gilt: Wenn der Kurs höhere Höchststände erreicht, sollte auch der Oszillator höhere Höchststände erreichen. Wenn der Kurs tiefere Tiefs erreicht, sollte der Oszillator auch tiefere Tiefs erreichen. Wenn sich dieses normale Verhalten nicht einstellt, bedeutet dies, dass der Preis und der Oszillator voneinander abweichen. Es gibt zwei Arten von Divergenzen:
Reguläre Divergenz
- Reguläre bullische Divergenz: Wenn der Kurs niedrigere Tiefststände erreicht, der Oszillator jedoch höhere Tiefststände aufweist.
- Regelmäßige bärische Divergenz: Wenn der Kurs höhere Höchststände erreicht, der Oszillator jedoch niedrigere Höchststände aufweist.
Versteckte Divergenz
- Versteckte bullische Divergenz: Wenn der Kurs höhere Tiefststände erreicht, der Oszillator jedoch niedrigere Tiefststände aufweist.
- Versteckte bärische Divergenz: Wenn der Kurs niedrigere Hochs erreicht, der Oszillator jedoch höhere Hochs verzeichnet.