KT Currency Strength and Correlation
- Indicatori
-
KEENBASE SOFTWARE SOLUTIONS
 Keenbase Trading sviluppa indicatori professionali ed Expert Advisor per MetaTrader 4 e MetaTrader 5, progettati per aiutare i trader a prendere decisioni di trading più consapevoli.
 - Versione: 1.2
- Aggiornato: 19 febbraio 2020
- Attivazioni: 10
Se fai trading nel Forex, avere informazioni dettagliate sulla forza delle valute e sulla correlazione tra coppie di valute può portare il tuo trading a un livello superiore. La correlazione ti aiuterà a dimezzare il rischio, mentre l'analisi della forza ti permetterà di massimizzare i profitti.
Questo indicatore offre un approccio ibrido per selezionare le coppie di valute più appropriate, combinando l'analisi della forza delle valute e la correlazione tra coppie di valute.
Come utilizzare l'analisi della forza delle valute
Supponiamo che la tua strategia di trading offra un'opportunità di acquisto su AUD/JPY. Utilizzando l'analisi della forza di KT, scopri che il JPY sta diventando più forte dell'AUD. In tal caso, è probabile che l'operazione si concluda con una perdita. Con questo indicatore, puoi facilmente evitare queste perdite.
Come utilizzare la correlazione tra coppie di valute
Poiché queste coppie sono fortemente correlate, operarle insieme raddoppierebbe il rischio. Se subisci una perdita su NZD/USD, è molto probabile che anche su GBP/JPY si verifichi una perdita.
Funzionalità
- Trova rapidamente la valuta più forte e la più debole per confermare le opportunità generate dalla tua strategia.
- Riduci il rischio della metà o anche di un terzo evitando di negoziare coppie di valute fortemente correlate.
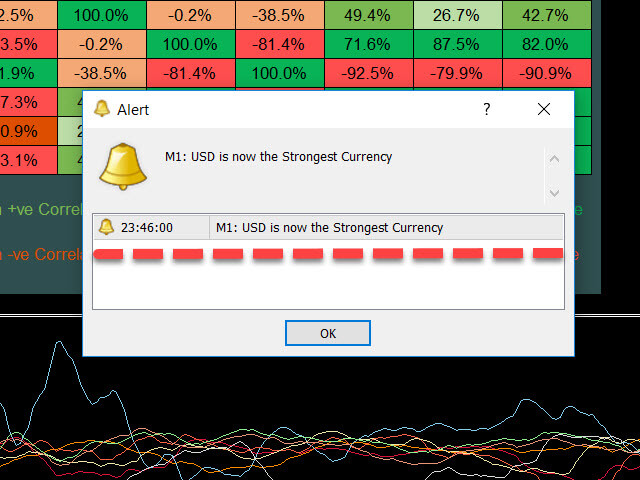
- Ricevi avvisi quando una valuta diventa la più forte o la più debole all'interno del paniere.
- Analizza i rapporti di forza utilizzando una piramide delle valute che le ordina dalla più forte alla più debole.
Analisi dettagliata della forza delle valute
- Come scegliere la migliore coppia di valute
Supponiamo che la tua strategia offra un'opportunità di acquisto su GBP/JPY e EUR/JPY. Poiché entrambe le coppie sono fortemente correlate positivamente, negoziarle insieme raddoppierebbe il rischio.
Utilizzando la piramide delle valute, puoi capire quale tra GBP e EUR è più forte. Se GBP è più forte, scegli GBP/JPY; se EUR è più forte, scegli EUR/JPY.
- Come evitare i mercati laterali
Supponiamo che la tua strategia offra un'opportunità di acquisto su AUD/JPY. Se nella piramide delle valute AUD e JPY sono posizionati uno accanto all'altro, è probabile che entrambi siano contemporaneamente forti o deboli.
Questa situazione porta spesso a un mercato laterale o senza direzione chiara.
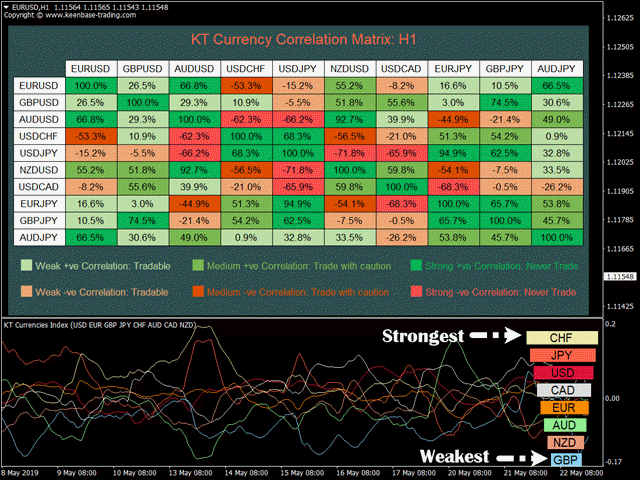
Analisi dettagliata della correlazione tra coppie di valute
La correlazione è un metodo statistico per misurare la relazione tra due asset di trading. La correlazione tra valute mostra quanto due coppie di valute si muovano nella stessa direzione, in direzioni opposte o in modo casuale in un determinato periodo.
- Una correlazione di +1 indica una correlazione positiva perfetta: le coppie si muoveranno nella stessa direzione il 100% delle volte, ad esempio EUR/USD e GBP/USD.
- Una correlazione di -1 indica una correlazione negativa perfetta: le coppie si muoveranno in direzioni opposte il 100% delle volte, ad esempio EUR/USD e USD/CHF.
- Una correlazione di 0 indica che i movimenti di prezzo non sono correlati tra loro.
- Forza della correlazione positiva
- Correlazione positiva debole (10% a 40%) = Negoziazione possibile
- Correlazione positiva media (40% a 60%) = Negoziare con cautela
- Correlazione positiva forte (60% a 100%) = Non negoziare
- Forza della correlazione negativa
- Correlazione negativa debole (-10% a -40%) = Negoziazione possibile
- Correlazione negativa media (-40% a -60%) = Negoziare con cautela
- Correlazione negativa forte (-60% a -100%) = Non negoziare