KT Currency Strength and Correlation
- 指标
- 版本: 1.2
- 更新: 19 二月 2020
- 激活: 10

如果您进行外汇交易,了解货币强弱和货币对相关性等详细信息,可以让您的交易更上一层楼。通过相关性分析,您可以将风险减半,而强弱分析将帮助您最大化利润。
本指标通过结合货币强弱分析和货币对相关性,提供了一种混合的方法,帮助选择最合适的货币对进行交易。
如何使用货币强弱分析
假设您的交易策略在AUD/JPY上提供了买入机会,但通过KT货币强弱分析发现JPY比AUD更强。那么,这笔交易很可能以亏损告终。有了这个指标,您可以轻松避免此类亏损。
如何使用货币对相关性
假设您的交易策略同时在NZD/USD和GBP/JPY上提供了卖出机会。通过KT货币对相关性功能,您发现这两个货币对的相关性达到77%。
由于这些货币对高度相关,同时交易它们只会加倍您的风险。如果在NZD/USD上出现亏损,GBP/JPY上的交易也很有可能出现亏损。
功能特点
- 快速识别最强和最弱货币,用以验证交易策略生成的交易机会。
- 通过避免交易高度相关的货币对,将风险降低一半甚至三分之一。
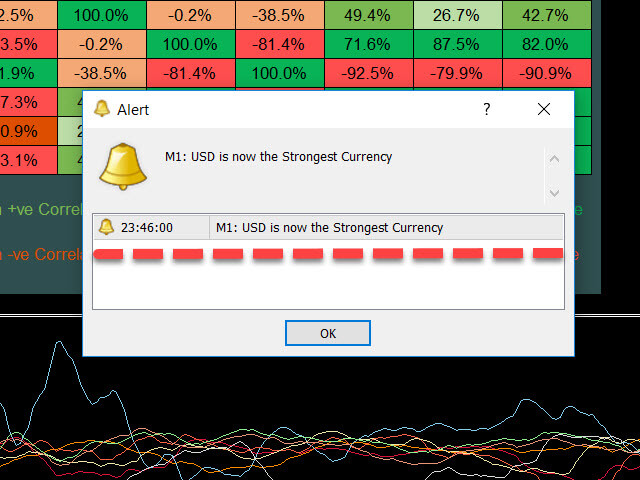
- 当某个货币成为最强或最弱时,接收警报通知。
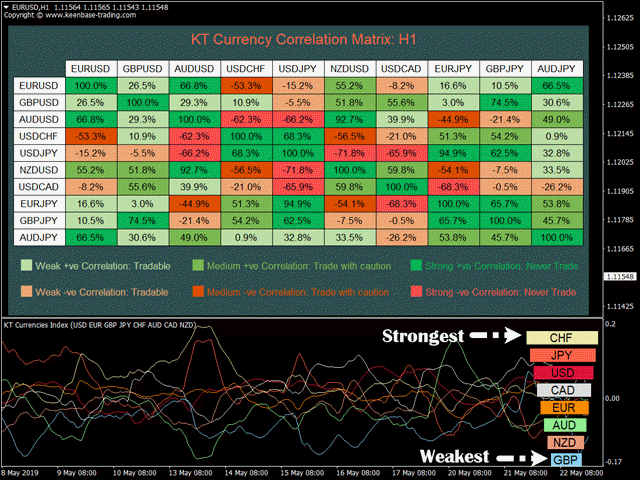
- 通过货币金字塔分析强弱报告,将货币按强到弱进行排序。
详细了解货币强弱分析
货币强弱分析通过数学计算帮助判断各货币的强弱。强弱是根据美元指数为参考基准计算得出其他货币指数的。
其基本理念是,在外汇市场中要成功交易,应买入最强的货币并卖出最弱的货币。
通过此工具,您可以在单一图表上监控和查看整个外汇市场的货币流向。
- 选择最佳货币对
假设您的交易策略同时在GBP/JPY和EUR/JPY上提供了买入机会。由于这两组货币对强正相关,同时交易会加倍风险。
使用货币强弱金字塔,您可以找出GBP和EUR中哪个更强。如果GBP更强,应选择GBP/JPY;如果EUR更强,应选择EUR/JPY。
- 避免震荡行情
假设您的交易策略在AUD/JPY上提供了买入机会,且在货币强弱金字塔中,澳元和日元紧邻排列。
这表明这两种货币在同一时间内都很强或都很弱,这通常导致价格进入震荡整理状态。
详细了解货币对相关性
一般来说,相关性是一种统计方法,用于衡量两个交易资产之间的关系。货币对相关性显示两组货币在特定时间段内是同向、反向还是随机波动的程度。
- 相关性为+1表示完美正相关,意味着两组货币100%同时向同一方向移动,如EUR/USD和GBP/USD。
- 相关性为-1表示完美负相关,意味着两组货币100%朝相反方向移动,如EUR/USD和USD/CHF。
- 相关性为0表示两组货币的价格走势彼此无关,属于随机运动。
- 正相关强度
- 弱正相关 (10% 至 40%) = 可交易
- 中等正相关 (40% 至 60%) = 谨慎交易
- 强正相关 (60% 至 100%) = 不要交易
- 负相关强度
- 弱负相关 (-10% 至 -40%) = 可交易
- 中等负相关 (-40% 至 -60%) = 谨慎交易
- 强负相关 (-60% 至 -100%) = 不要交易
"请注意,本工具本身不提供交易策略,而是作为辅助工具来验证交易信号。"