KT Asian Breakout Indicator
- Indikatoren
-
KEENBASE SOFTWARE SOLUTIONS
 Keenbase Trading entwickelt professionelle MetaTrader 4- und MetaTrader 5-Indikatoren sowie Expert Advisors, die Trader dabei unterstützen, fundiertere Handelsentscheidungen zu treffen.
 - Version: 1.2
- Aktualisiert: 19 September 2020
- Aktivierungen: 5
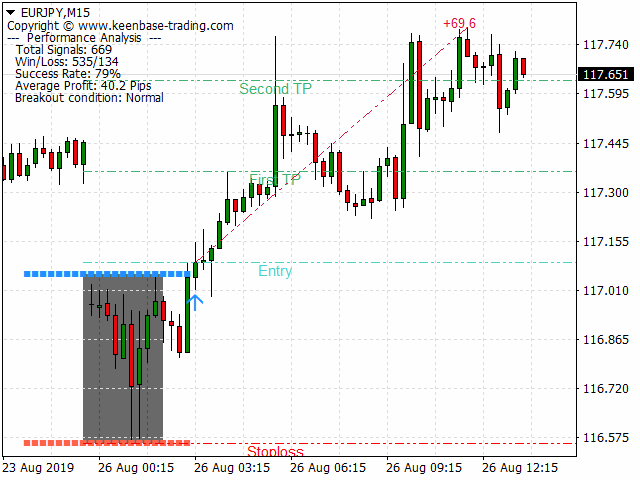
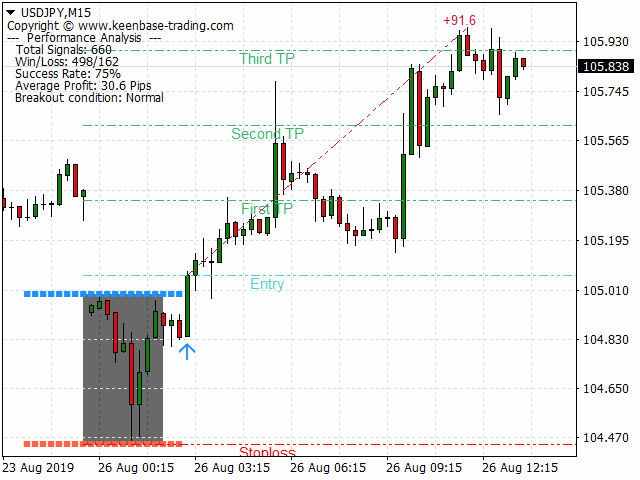
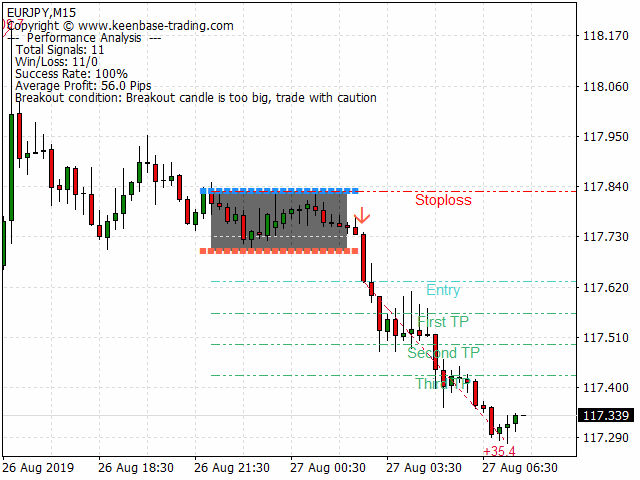
Der KT Asian Breakout Indikator analysiert einen wichtigen Teil der asiatischen Handelssitzung, um in beide Richtungen Kauf- und Verkaufssignale basierend auf dem Preis-Ausbruch zu generieren. Ein Kaufsignal wird ausgelöst, wenn der Preis das Sitzungs-Hoch durchbricht, und ein Verkaufssignal tritt auf, wenn der Preis das Sitzungs-Tief durchbricht.
Wichtige Hinweise
- Wenn die Sitzungsbox vertikal zu breit ist, sollte ein neuer Trade vermieden werden, da die meisten Kursbewegungen bereits innerhalb der Box stattgefunden haben.
- Wenn die Ausbruchskerze zu groß ist, macht der Preis oft eine kurzfristige Korrektur, bevor er sich in die Richtung des Signals bewegt.
Funktionen
- Stop-Loss und Gewinnziele sind in den Kauf-/Verkaufssignalen enthalten.
- Der KT Asian Breakout Indikator überwacht seine Performance kontinuierlich und nutzt das erste, zweite oder dritte Gewinnziel als Erfolgskriterium.
- Zeigt drei wichtige Leistungskennzahlen an: Anzahl der Gewinn-/Verlustsignale, Erfolgsquote und durchschnittliche Pips pro Signal.
- Wenn die Ausbruchskerze zu groß ist, wird eine Warnmeldung im Chart angezeigt.
Empfehlungen
- Zeitrahmen: 15 Minuten.
- Währungspaare: Alle JPY-Paare.
Eingabeparameter
- Sitzungsbox anzeigen: true/false
- Stop-Loss und Gewinnziele anzeigen: true/false
- Leistungsanalyse: true/false
- Textanalyse anzeigen (oben links): true/false
- Erfolgsquote-Kriterium: erstes Ziel | zweites Ziel | drittes Ziel
- Farb- und Stileinstellungen: anpassbar
- Alarm-Einstellungen: anpassbar
Für Entwickler
double Buy_Signal    = iCustom(NULL,0,"Market/KT Asian Breakout Indicator",0,1);
double Sell_Signal   = iCustom(NULL,0,"Market/KT Asian Breakout Indicator",1,1);
double Buy_Stoploss  = iCustom(NULL,0,"Market/KT Asian Breakout Indicator",2,1);
double Sell_Stoploss = iCustom(NULL,0,"Market/KT Asian Breakout Indicator",3,1);

if(Buy_Signal!=0) // Kaufbedingung erfüllt
if(Sell_Signal!=0) // Verkaufsbedingung erfüllt

// Ziele aus dem Chart abrufen
First Target = NormalizeDouble(ObjectGetDouble(0,"KT_FTP",OBJPROP_PRICE),Digits);
SecondTarget = NormalizeDouble(ObjectGetDouble(0,"KT_STP",OBJPROP_PRICE),Digits);
Third Target = NormalizeDouble(ObjectGetDouble(0,"KT_TTP",OBJPROP_PRICE),Digits);