Shark Deal Book
- Indikatoren
- Version: 2.10
- Aktualisiert: 8 Oktober 2023
- Aktivierungen: 5
Der Begriff "Hai" bezeichnet in der Geschäftswelt einen Großinvestor, der gerade eine gute Investition in ein hochpotentes Geschäft getätigt hat, also diejenigen, die den Markt bewegen.
In unserem Fall, wenn ein amerikanischer Hai ein japanisches Unternehmen kauft, muss er/sie amerikanische Dollar in japanische Yen umtauschen, um das Geschäft abzuschließen. Die Nachfrage nach dem japanischen Yen wird also stark ansteigen. Der USD/JPY wird also schnell short gehen, wenn das Geschäft von einem Hai getätigt wurde.
Ein weiteres Beispiel: Wenn die US-Notenbank FED ihren Leitzins erhöht, der jetzt attraktiver ist als der britische Leitzins, dann wird ein beträchtliches Nachfragevolumen nach USD entstehen. So werden Anleger und Händler, die in britische Anleihen investiert haben, Gelder in US-Anleihen umschichten, und diese großen Gelder werden von einem Land ins andere wandern. Bei diesem Geschäft wird GBPUSD schnell short gehen. Dieser Deal wird von einem Haifischschwarm ausgehen.
Worum geht es nun im Shark Deal Book?
Ich habe ein mathematisches Modell formuliert, um einen inneren Wert für den zugrunde liegenden Vermögenswert/Symbol zu ermitteln. Wenn der innere Wert auf 65 ansteigt, bestätigt dies, dass die zugrunde liegende Währung für Haie attraktiv ist, um ein Geschäft mit dem zugrunde liegenden Vermögenswert/Symbol abzuschließen. Dieses Verhalten deutet auf eine hohe Wahrscheinlichkeit einer neuen Trendfortsetzung oder Trendumkehr hin.
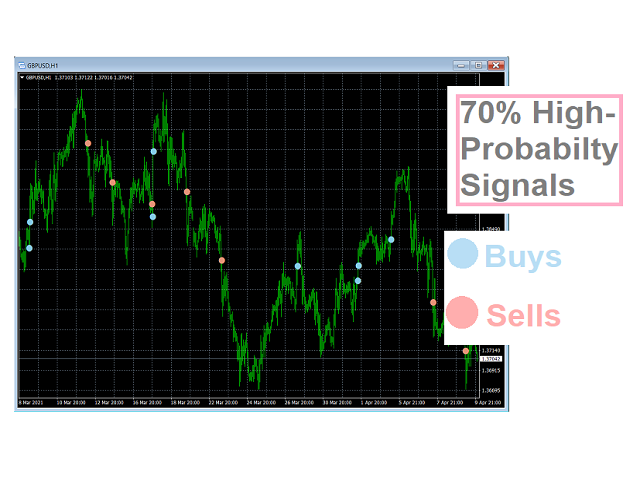
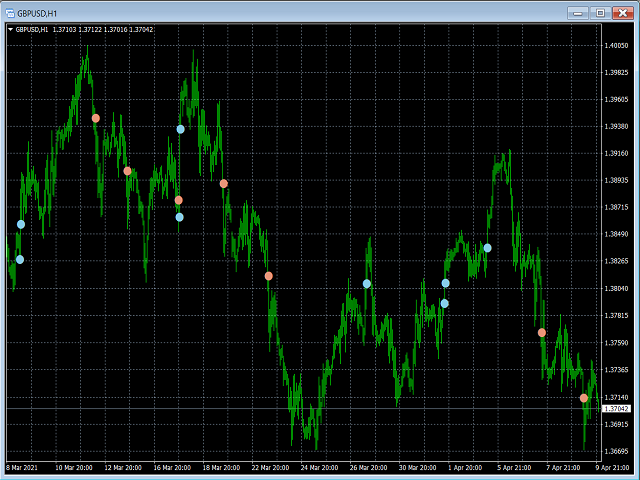
Ein grüner Wert von 75+ steht für ein Kaufsignal.
Ein roter Wert von 75+ steht für ein Verkaufssignal.
So wird jeder ausgeführte Handel zu einer ausgewogenen Kunst aus Optimismus und Pessimismus.
Warum müssen wir Hai-Geschäfte erkennen?
Weil Haie die Initiatoren sind, die einen Vermögenswert aufgrund seines inneren Wertes und nicht aufgrund seines äußeren Wertes kaufen, d.h. sie schaffen einen Trend oder treten in ein Muster so früh wie möglich ein.
Es gibt ein berühmtes Sprichwort: "Der Trend ist ein Freund", aber ich behaupte, es kommt darauf an, wann man in den Handel einsteigt. Wenn Sie zu spät in ein Geschäft einsteigen, müssen Sie für den Fehler bezahlen, denn der Trend wird Sie nicht als treuen Freund, sondern als Goldgräber sehen. (Ich hoffe, Sie können verstehen, was ich meine.)
So, jetzt möchte ich mich vorstellen?
Ich bin Philip Pankaj, und ich habe meinen Abschluss als Elektroingenieur gemacht, aber später habe ich meine Fähigkeiten in den Finanzbereich verlagert und den Abschluss als Research Analyst mit Handelsberater-Zertifizierung gemacht. Im Laufe meines Lebens habe ich eine größere Affinität zu Finanzdaten entwickelt, so dass ich mehrere Strategien entwickle und verschiedene Ideen gegeneinander abwäge. Während dieser Prozesse schloss ich meine Zertifizierungen für Data Science und maschinelles Lernen ab, gefolgt vom Erlernen verschiedener Programmiersprachen, zu denen auch mq4 und mq5 gehören.
Und nun die wichtigste Frage.
Wie kann ich handeln?
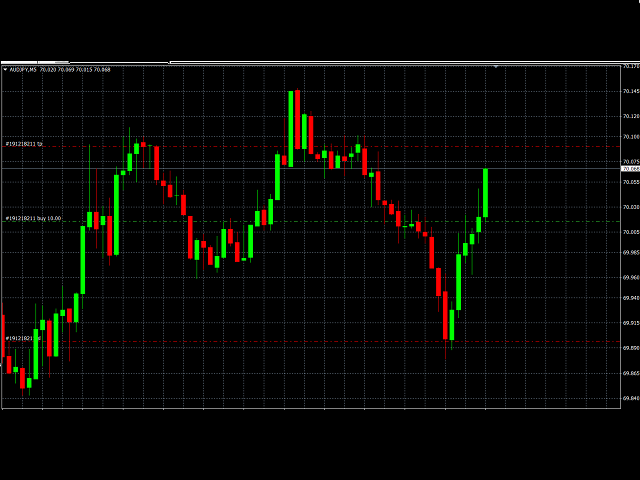
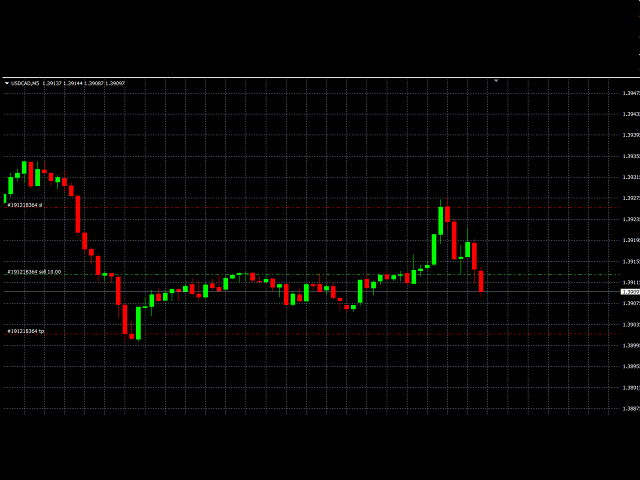
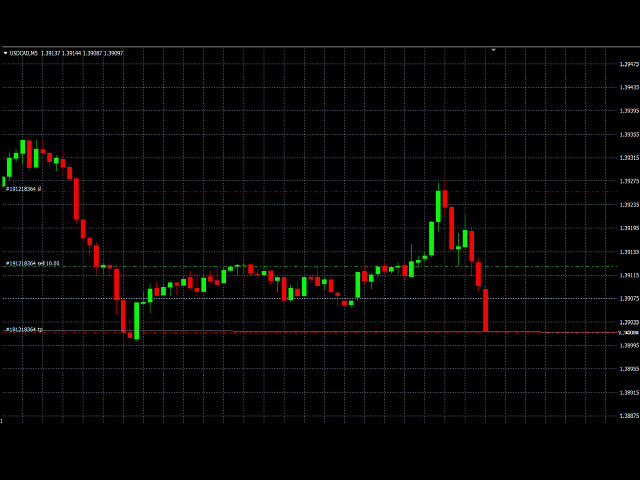
Führen Sie Ihre Trades in 2 einfachen Schritten aus!
Schritt 1: Handelsaufbau
Geben Sie ein Signal ein, wenn das Shark Deal Book größer als 65 ist, und bestätigen Sie, dass mindestens eine Kerze in unsere Richtung reagiert (Bullen-Kerze für Kaufsignal und Bären-Kerze für Verkaufssignal).
Grün - Kaufen & Rot - Verkaufen
Schritt 2: Ausstieg aus dem Handel
Schritt Eins 1: Stop-Loss-Kurs - Jüngstes Swing-Tief/Hoch für Kauf/Verkauf (abhängig vom generierten Signal TimeFrame).
Schritt 1 2: Take Profit Preis -
Für Buy - Entry Level + (Entry Level - letztes Tief).
Für Verkauf - Einstiegskurs + (Einstiegskurs - letztes Hoch).
Vorteile, die Sie erhalten
Schnelles Erkennen des inneren Wertes von Assets/Symbolen.
Steigen Sie zum richtigen Zeitpunkt in den Trend ein, wie ein Hai.
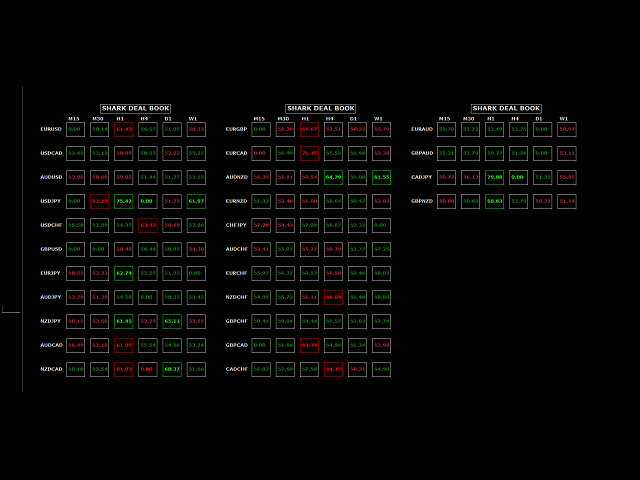
Analysieren Sie mehrere Timeframes und mehrere Symbole auf einem Chart.
Dieser Indikator ist die ideale Kombination mit jeder Handelsstrategie.
Zeichnet nie neu, malt nie zurück, berechnet nie neu.
Funktioniert in allen Symbolen und allen Zeitrahmen.
Integrierte Pop-up-, E-Mail-, Push-Benachrichtigungen und akustische Warnungen.
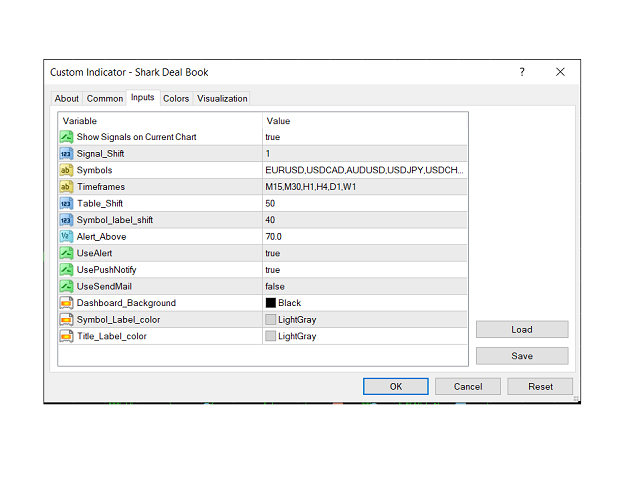
Parameter
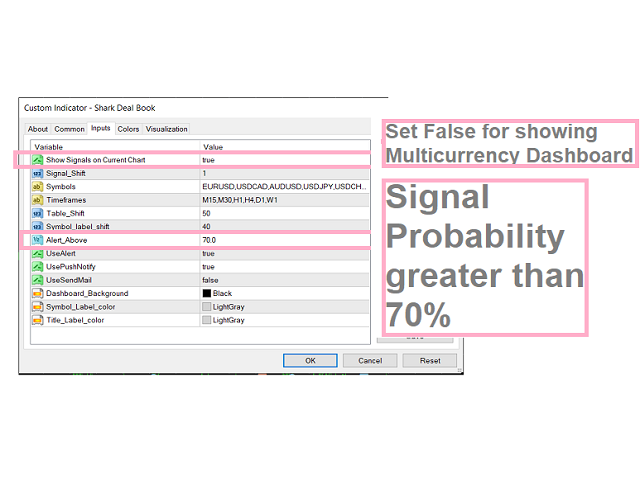
Symbols Parameter - Fügen Sie mehrere Symbole, getrennt durch ein Komma (","), hinzu.
TimeFrame-Parameter - Fügen Sie mehrere durch Komma(",") getrennte Timeframes hinzu.
M1 - 1Minute
M5 - 5 Minuten
M15 - 15 Minuten
M30 - 30 Minuten
H1 - 1 Stunde
H4 - 4 Stunden
D1 - 1 Tag
W1 - 1 Woche
MN1 - 1 Monat
Positionsparameter - steuert die Position der im Diagramm gezeichneten Objekte.
Grafikparameter - steuert das Aussehen und die Farben der gezeichneten Objekte im Diagramm.
Alert-Parameter - steuert die aktivierten Alarmoptionen.


Very Good