SFT Horizontal Volume
- Indikatoren
-
Artem Kuzmin
 ALL PRODUCTS ▶️ https://www.mql5.com/ru/users/zombiezorrofx/seller
🔥 Maximum commission discounts:
💠 Binance 35% (trading bypassing sanctions) - Version: 1.0
- Aktivierungen: 5
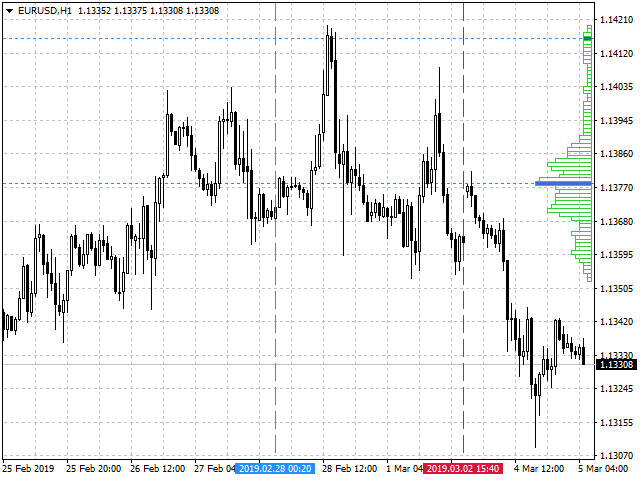
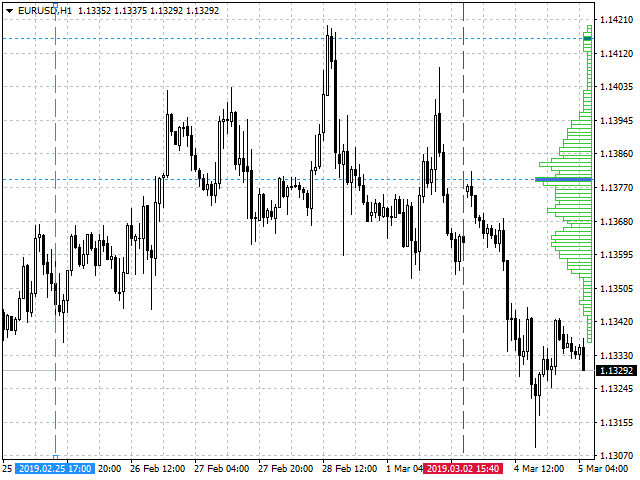
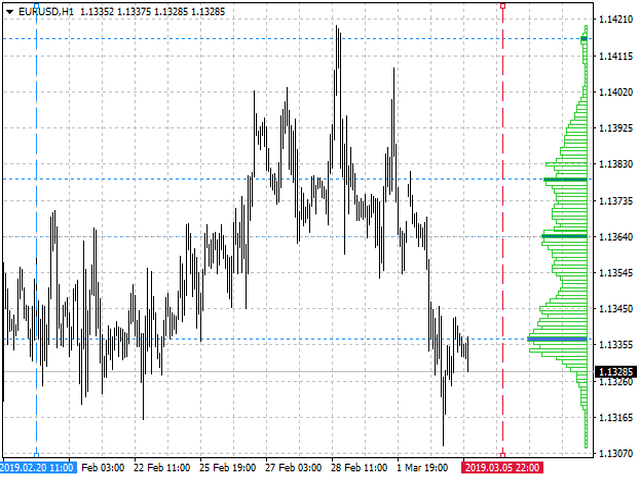
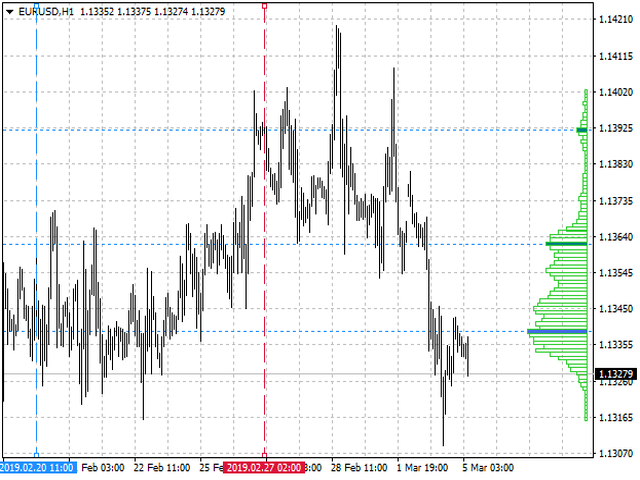
Der Indikator zeigt für den ausgewählten Bereich das Tickvolumen in Form eines horizontalen Histogramms an.
hebt die höchsten und wichtigsten Kursniveaus hervor, in deren Nähe Korrekturen und Kursumkehrungen am wahrscheinlichsten sind
Ermöglicht Ihnen den Handel mit Trends und Gegentrends anhand von Unterstützungs- und Widerstandsniveaus
Funktioniert auf allen Zeitrahmen, für alle Währungspaare, Metalle und Kryptowährungen
Kann bei der Arbeit mit binären Optionen verwendet werden
Unterscheidende Merkmale
- Zeigt die wichtigsten Unterstützungs- und Widerstandsniveaus an;
- Geeignet für den Handel mit Markt- und Pending-Orders;
- Wird nicht neu gezeichnet;
- Es hat einfache und klare Einstellungen;
- Funktioniert auf allen Zeitrahmen und für alle Symbole;
- Geeignet für den Handel mit Währungen, Metallen, Optionen und Kryptowährungen (Bitcoin, Litecoin, Ethereum, etc.);
Für genauere Eingaben und zusätzliche Bestätigungssignale kann er in Verbindung mit anderen Indikatoren verwendet werden.
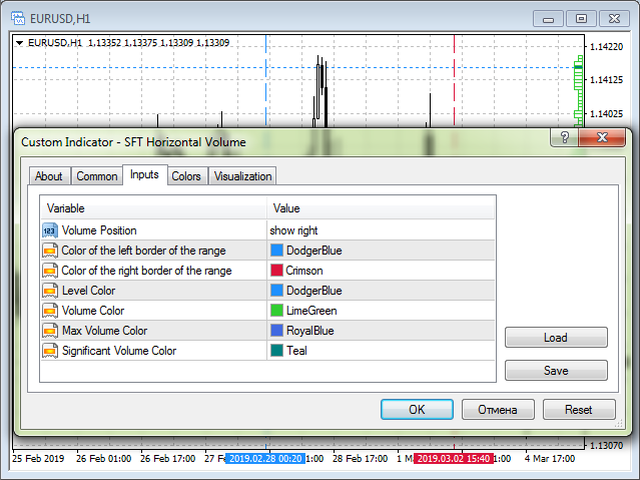
Einstellungen des Indikators
- Volumenposition - Position des Histogramms der Volumina auf dem Diagramm nach rechts oder links;
- Die Farbe der Linie , die die linke Grenze des Bereichs definiert;
- Farbe der Linie , die den rechten Rand des Bereichs definiert;
- Farbe des Niveaus - die Farbe der Unterstützungs- und Widerstandslinien;
- Volumenfarbe - die Farbe des Histogramms;
- Farbe des maximalen Volumens - die Farbe des maximalen Volumens des Histogramms;
- Farbe des signifikanten Volumens - die Farbe des Histogramms der signifikanten Volumina;
Handelsempfehlungen
Gut bewährt in Zusammenarbeit mit dem kostenlosen IndikatorSFT Bullet Arrow
Weitere Informationen und einen detaillierten Überblick über die Handelsmethoden finden Sie hier:
Handelsstrategie mit dem SFT Horizontal Volume Indikator
Wir wünschen Ihnen einen stabilen und profitablen Handel.
Vielen Dank, dass Sie unsere Software nutzen.
Wenn es Ihnen gefällt, dann tun Sie eine gute Tat und teilen Sie den Link mit Ihren Freunden.
Um die Veröffentlichung von neuen nützlichen Programmen für den Handel nicht zu verpassen - fügen Sie als Freund hinzu:SURE FOREX TRADING


Der Benutzer hat keinen Kommentar hinterlassen