AQ XFifteen Pro
- Indikatoren
-
HIT HYPERTECH INNOVATIONS LTD
 We are a team of experts in Artificial Intelligence, Computational Finance & Finance with more than 25 years trading experience each, having worked in Hedge funds, big corporations, research institutes & academia. We operate from London, New York, Athens, Cyprus & are incorporated in Cyprus.
 - Version: 1.0
- Aktivierungen: 5
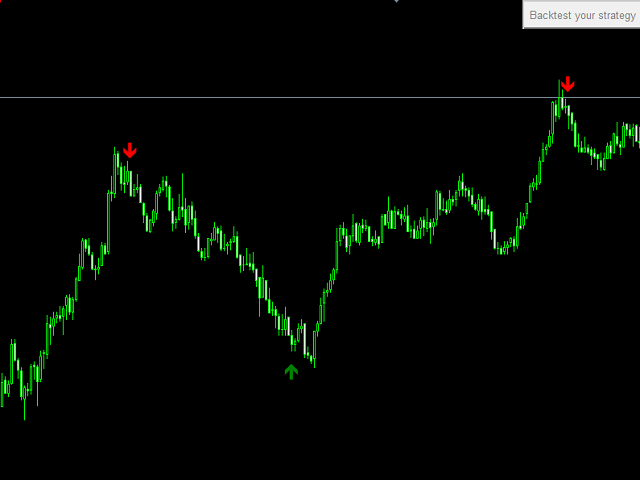
Der Χ15-Indikator ist ein MetaTrader 4-Tool, das es Ihnen ermöglicht, Ihre eigenen Strategien schnell, einfach und effizient zu erstellen und in Echtzeit zu testen. Es enthält 15 der beliebtesten technischen Analyse-Indikatoren, die Sie verwenden können, jeder auf eine andere Weise. Wählen Sie die Indikatoren, die Sie verwenden möchten, wählen Sie aus, wie Sie sie verwenden möchten, und Sie werden auf dem Chart KAUFEN (grün) und VERKAUFEN (rot) Pfeile sehen, die Ihre Strategie umsetzen. Wählen Sie Take-Profit und Stop-Loss und Sie sehen die Ergebnisse Ihrer Strategie mit der VOLLSTÄNDIGEN BACKTEST-STATISTIK aller Kerzen auf dem ausgewählten Chart.
Alle Indikatoren werden vom Benutzer vollständig parametrisiert.
Alle Indikatoren sind in der MetaTrader 4 Plattform des Benutzers vorhanden, es ist keine spezielle Installation erforderlich.
In der Pro-Version haben wir den sehr erfolgreichen X15-Indikator mit einem einzigartigen Machine Learning-Filter verbessert, der Ihre Strategie verbessern kann. Erstellen Sie Ihre Strategie nach Ihren Regeln und geben Sie ihr einen ernsthaften Schub, indem Sie den aQuantTrendOn-Parameter aktivieren. Unabhängig von der Strategie, die Sie erstellen (Trendfolge, Reversal, Breakout usw.) wird der a-Quant-Trend-Algorithmus die Profitabilität in den meisten Fällen erhöhen. Es ist sehr einfach, dies mit dem X15 Backtesting Tool herauszufinden. Die Pro-Version enthält auch die sehr nützliche Funktion der Alerts, die Sie bei jedem auftretenden Signal benachrichtigen.
Die Indikatoren sind:
- Zwei MAs, ein schneller und ein langsamer, mit der Auswahl, den schnellen, den langsamen oder den schnellen gegen den langsamen zu verwenden
- RSI mit Auswahl zur Verwendung von überkauften/überverkauften Niveaus, RSI-Spanne und RSI oberhalb/unterhalb eines kritischen Wertes
- ADX mit der Möglichkeit, den kritischen ADX-Wert, den ADX-Trend, +DI und -DI oder alle oben genannten Werte zu verwenden
- Stochastik mit Auswahl der Stochastik-Wertespanne oder des kritischen Wertes
- MACD mit Auswahl oberhalb/unterhalb von Null, oberhalb/unterhalb von MACD Signal oder beides
- Volumen mit Auswahl oberhalb/unterhalb eines Levels, Volumen oberhalb/unterhalb des Volume MA oder beides
- Bollinger Bands mit der Auswahl, den Bereich zwischen den oberen/unteren Bändern oder das mittlere Band zu verwenden
- Heiken Ashi mit Auswahl der Heiken Ashi-Farbe
- CCI mit Auswahl von CCI überkauft/überverkauft und CCI oberhalb/unterhalb eines kritischen Niveaus
- Momentum mit Auswahl der Momentum-Richtung
- OSMA mit Auswahl über/unter Null, OSMA Richtung oder beides
- Parabolic SAR mit Auswahl oberhalb/unterhalb der SAR-Punkte
- Accelerator mit Auswahl oberhalb/unterhalb von Null, Accelerator Richtung oder beides
- ATR mit Auswahl der ATR-Richtung
- Ichimoku mit Auswahl von Chikou, Kumo, Kijun und Tenkan
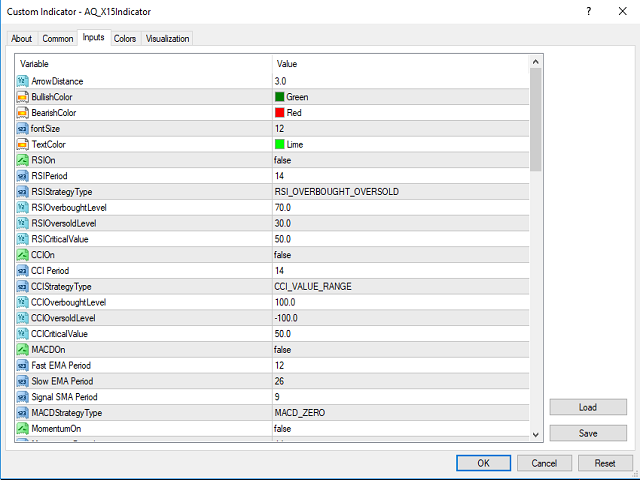
Parameter
- ArrowDistance - Abstand der Pfeile des Indikators von jedem Balken in Pips
- BullishColor - Farbe für bullish/buy Pfeile
- BearishColor - Farbe für bärische/verkaufende Pfeile
- fontSize - Schriftgröße für die Testergebnisse im Chart
- TextColor - Farbe des Textes für die Testergebnisse im Diagramm
- RSIOn - true, wenn Sie den RSI-Indikator in Ihre Strategie einbeziehen möchten
- RSIPeriod - RSI-Zeitraum
- RSIStrategyType
- RSI_OVERBOUGHT_OVERSOLD bedeutet BUY, wenn der RSI unter dem RSI Overbought Level liegt und SELL, wenn der RSI über dem RSI Oversold Level liegt
- RSI_VALUE_RANGE bedeutet KAUFEN, wenn der RSI zwischen dem RSI Overbought und RSI Oversold Level liegt
- RSI_VALUE_UP_DOWN bedeutet KAUFEN, wenn der RSI über dem kritischen Niveau liegt und VERKAUFEN, wenn der RSI unter dem kritischen Niveau liegt
- RSIOverboughtLevel - RSI Überkauft-Level
- RSIOversoldLevel - RSI Überkauft-Level
- RSICriticalValue - Kritisches RSI-Niveau