SFT Buy Sell Slides
- Indikatoren
-
Artem Kuzmin
 ALL PRODUCTS ▶️ https://www.mql5.com/ru/users/zombiezorrofx/seller
🔥 Maximum commission discounts:
💠 Binance 35% (trading bypassing sanctions) - Version: 1.0
- Aktivierungen: 5
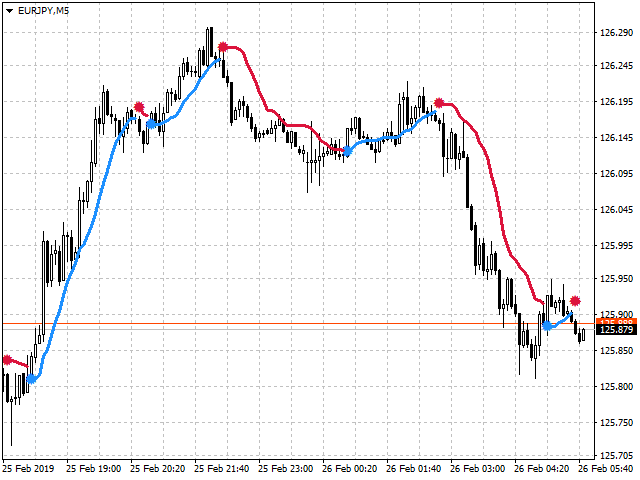
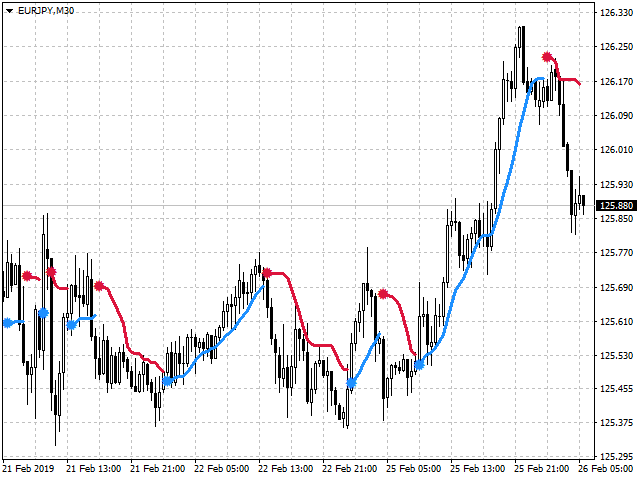
Indikator zur Bestimmung von Anpassungen und Preisumkehrungen
Er gibt Signale für Eingaben und zeigt die allgemeine Richtung der Preisbewegung an.
Ermöglicht Ihnen den Handel mit Trends und Gegentrends
Funktioniert auf allen Zeitrahmen, für alle Währungspaare, Metalle und Kryptowährungen
Kann bei der Arbeit mit binären Optionen verwendet werden
Unverwechselbare Merkmale
- Wird nicht neu gezeichnet;
- Dank der einfachen Einstellungen können Sie sich schnell an jedes Handelsinstrument anpassen;
- Funktioniert auf allen Zeitrahmen und für alle Symbole;
- Geeignet für den Handel mit Währungen, Metallen, Optionen und Kryptowährungen (Bitcoin, Litecoin, Ethereum, etc.);
- Geeignet für den manuellen Handel und für die Entwicklung von Beratern;
Für genauere Eingaben und zusätzliche Bestätigungssignale kann er in Verbindung mit anderen Indikatoren verwendet werden.
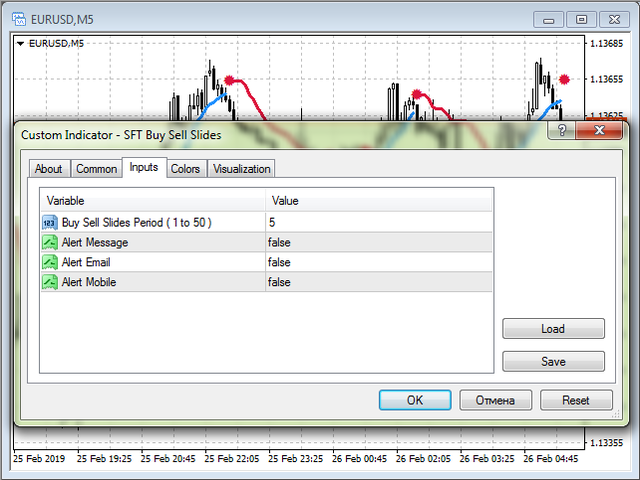
Einstellungen des Indikators
- Buy Sell Slides Period (1 bis 50) - der Zeitraum der Indikatorberechnung;
- Alert Message - Anzeige von Meldungen auf dem Bildschirm und akustische Bestätigung des Signals;
- Alert Email - sendet Signale an die E-Mail, Anweisungen zum Einrichten des Terminals hier ;
- Alert Mobile - sendet an das Telefon, über das installierte mobile Terminal, Anweisungen zur Einrichtung hier ;
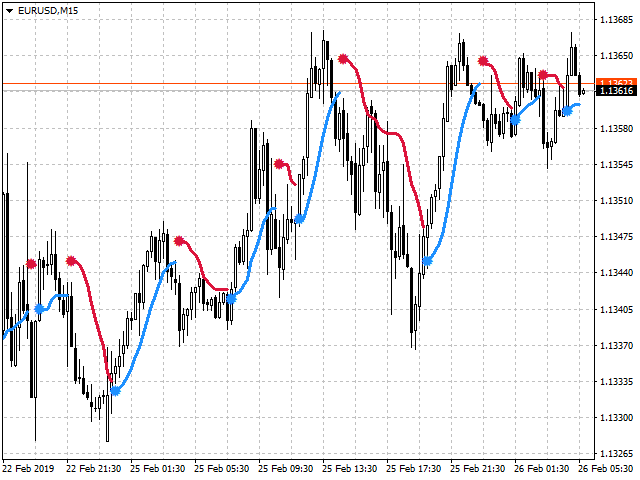
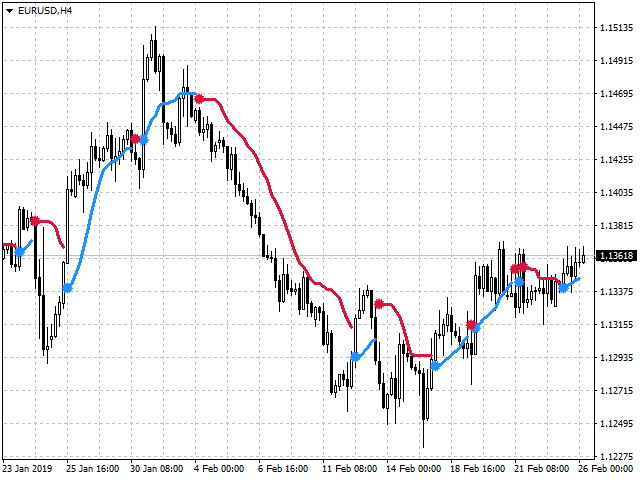
Handelsempfehlungen
- Wenn ein roter Punkt erscheint, öffnen Sie Sell oder Put (für Optionen)
- Wenn ein blauer Punkt erscheint, öffnen Sie Buy oder Call (für Optionen)
- Die Handelsrichtung sollte mit der Trendrichtung auf einem höheren Zeitrahmen übereinstimmen.
- Gut bewährt in Zusammenarbeit mit dem kostenlosen IndikatorSFTBullet Arrow
Es gibt noch weitere Optionen, im Laufe des Handels können Sie die für Sie günstigste Taktik entwickeln.
Weitere Informationen und einen detaillierten Überblick über die Handelsmethoden finden Sie hier:
Handelsstrategie mit Indikator SFT Buy Sell Slides
Wir wünschen Ihnen einen stabilen und profitablen Handel.
Vielen Dank, dass Sie unsere Software nutzen.
Wenn Sie es mögen, dann tun Sie eine gute Tat und teilen Sie den Link mit Ihren Freunden.
Um die Veröffentlichung von neuen nützlichen Programmen für den Handel nicht zu verpassen - fügen Sie als Freund hinzu:SURE FOREX TRADING