SFT Buy Sell Slides
- Indicadores
-
Artem Kuzmin
 ALL PRODUCTS ▶️ https://www.mql5.com/ru/users/zombiezorrofx/seller
🔥 Maximum commission discounts:
💠 Binance 35% (trading bypassing sanctions) - Versión: 1.0
- Activaciones: 5
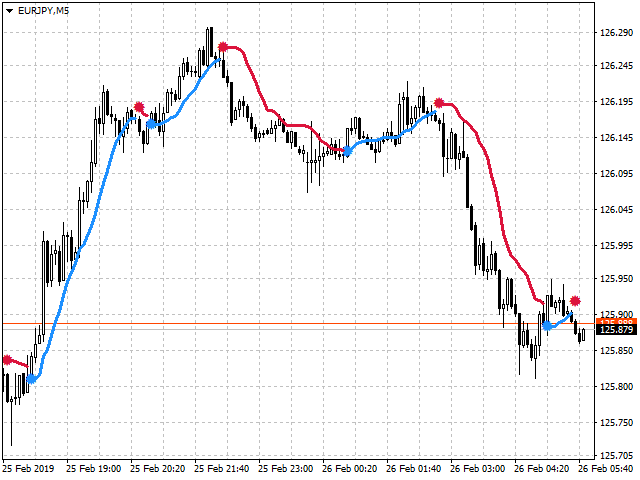
Indicador para determinar ajustes e inversiones de precios.
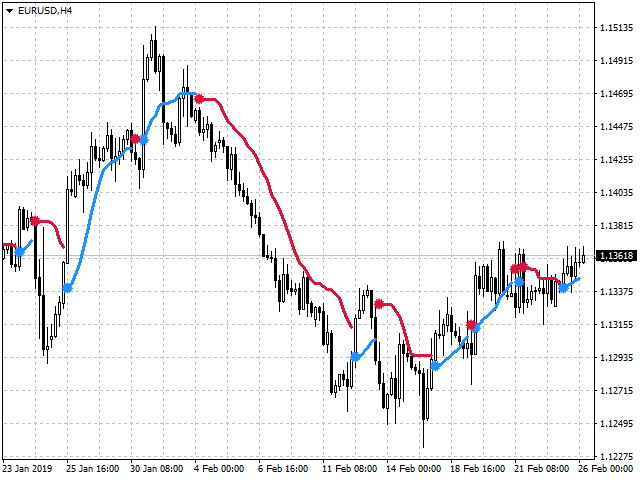
Da señales de entrada y muestra la dirección general del movimiento de los precios.
Le permite realizar operaciones de tendencia y contra tendencia
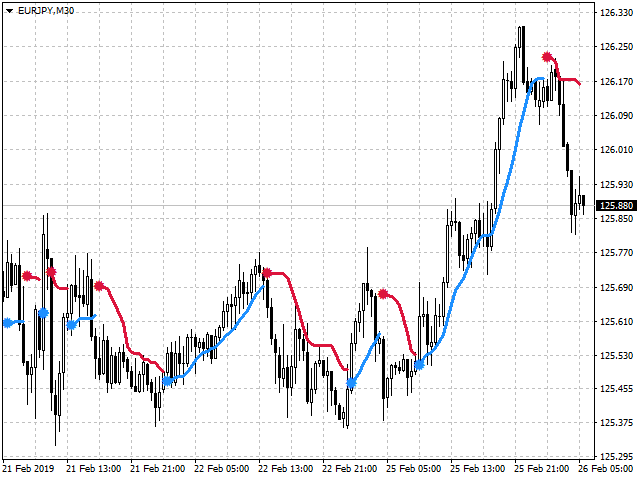
Funciona en todos los marcos temporales, en cualquier par de divisas, metales y criptodivisas
Se puede utilizar cuando se trabaja con opciones binarias
Características distintivas
- No se redibuja;
- Gracias a sus sencillos ajustes, puede adaptarse rápidamente a cualquier instrumento de negociación;
- Funciona en todos los plazos y en todos los símbolos;
- Adecuado para operar con divisas, metales, opciones y criptodivisas (Bitcoin, Litecoin, Ethereum, etc.);
- Adecuado para el comercio manual y para el desarrollo de asesores;
Para obtener entradas más precisas y señales de confirmación adicionales se puede utilizar junto con otros indicadores.
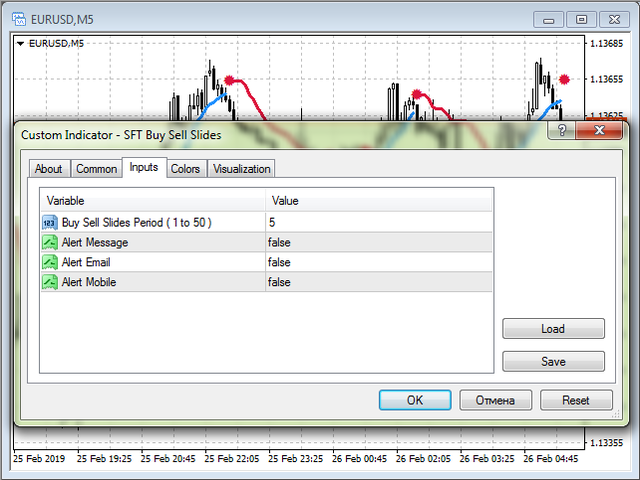
Configuración del indicador
- Comprar Vender Periodo de deslizamiento (1 a 50) - el período de cálculo del indicador;
- Mensaje de Alerta - mostrar mensajes en la pantalla y el sonido de confirmación de la señal;
- Alert Email - envía señales al correo, instrucciones para configurar el terminal aquí ;
- Alert Mobile - envía al teléfono, a través del terminal móvil instalado, instrucciones para configurar aquí ;
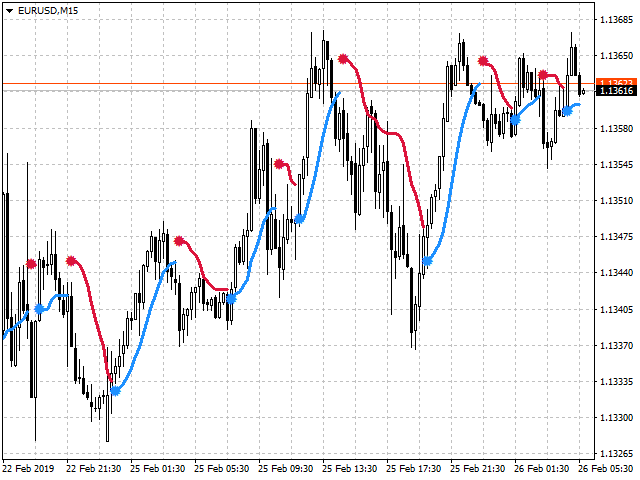
Recomendaciones para operar
- Cuando aparezca un punto rojo, abra Vender o Poner (para opciones)
- Cuando aparezca un punto azul, abra Comprar o Comprar (para opciones)
- La dirección de la operación debe corresponder a la dirección de la tendencia en un marco temporal superior.
- Bien probado en colaboración con el indicador gratuitoSFTBullet Arrow
Hay otras opciones, en el proceso de negociación puede desarrollar la táctica más conveniente para usted.
Para obtener más información y una visión más detallada de los métodos de negociación, consulte aquí:
Estrategia de negociación con el indicador SFT Compra Venta Diapositivas
Le deseamos un comercio estable y rentable.
Gracias por utilizar nuestro software.
Si le gusta, haga una buena acción y comparta el enlace con sus amigos.
Para no perderse el lanzamiento de nuevos programas útiles para el comercio - añadir como amigo:SURE FOREX TRADING