SFT Buy Sell Slides
- 지표
-
Artem Kuzmin
 ALL PRODUCTS ▶️ https://www.mql5.com/ru/users/zombiezorrofx/seller
🔥 Maximum commission discounts:
💠 Binance 35% (trading bypassing sanctions) - 버전: 1.0
- 활성화: 5
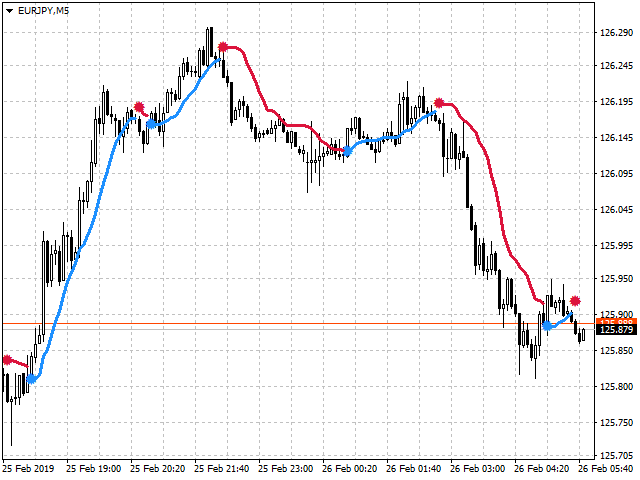
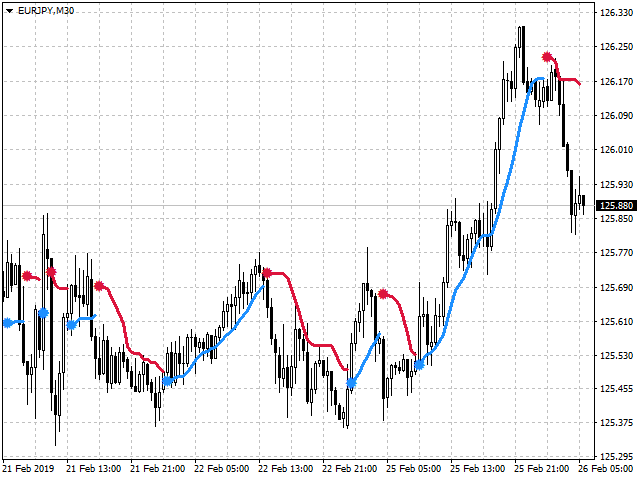
Indicator for determining adjustments and price reversals
It gives signals for inputs and shows the general direction of the price movement.
Allows you to conduct trend and counter trend trading
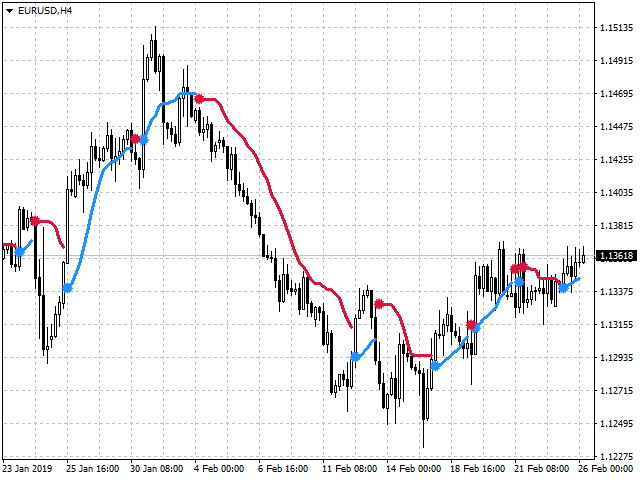
It works on all timeframes, on any currency pairs, metals and cryptocurrency
Can be used when working with binary options
Distinctive features
- Does not redraw;
- Thanks to simple settings, you can quickly adapt to any trading instrument;
- It works on all timeframes and on all symbols;
- Suitable for trading currencies, metals, options and cryptocurrency (Bitcoin, Litecoin, Ethereum, etc.);
- Suitable for manual trading and for developing advisers;
For more accurate inputs and additional confirmation signals can be used in conjunction with other indicators.
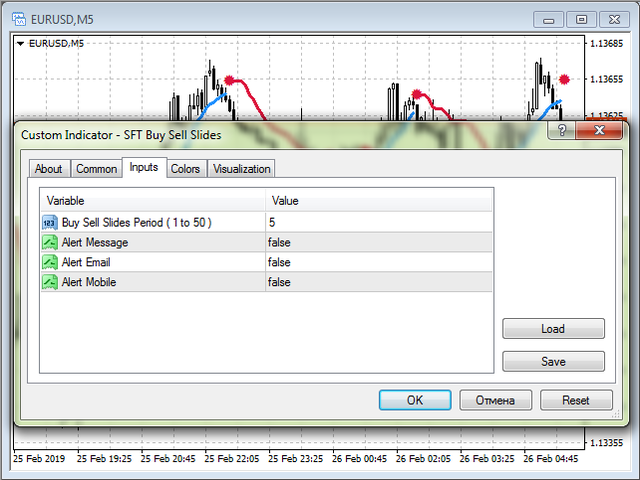
Indicator Settings
- Buy Sell Slides Period (1 to 50) - the period of the indicator calculation;
- Alert Message - display messages on the screen and sound confirmation of the signal;
- Alert Email - sends signals to the mail, instructions for setting up the terminal here ;
- Alert Mobile - sends to the phone, via the installed mobile terminal, instructions for setting up here ;
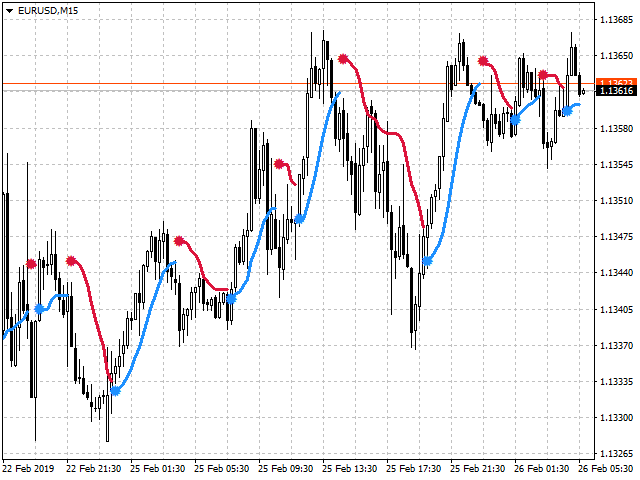
Trading Recommendations
- When a red point appears, open Sell or Put (for options)
- When a blue point appears, open Buy or Call (for options)
- The trade direction should correspond to the trend direction on a higher timeframe.
- Well proven in collaboration with the free indicator SFT Bullet Arrow
There are other options, in the process of trading you can develop the most convenient tactics for you.
For more information and a more detailed overview of trading methods, see here:
Trading strategy with indicator SFT Buy Sell Slides
We wish you a stable and profitable trade.
Thank you for using our software.
If you like it, then do a good deed and share the link with your friends.
Not to miss the release of new useful programs for trading - add as a friend: SURE FOREX TRADING