Compare Graphs
- Indikatoren
- Version: 1.0
- Aktivierungen: 5

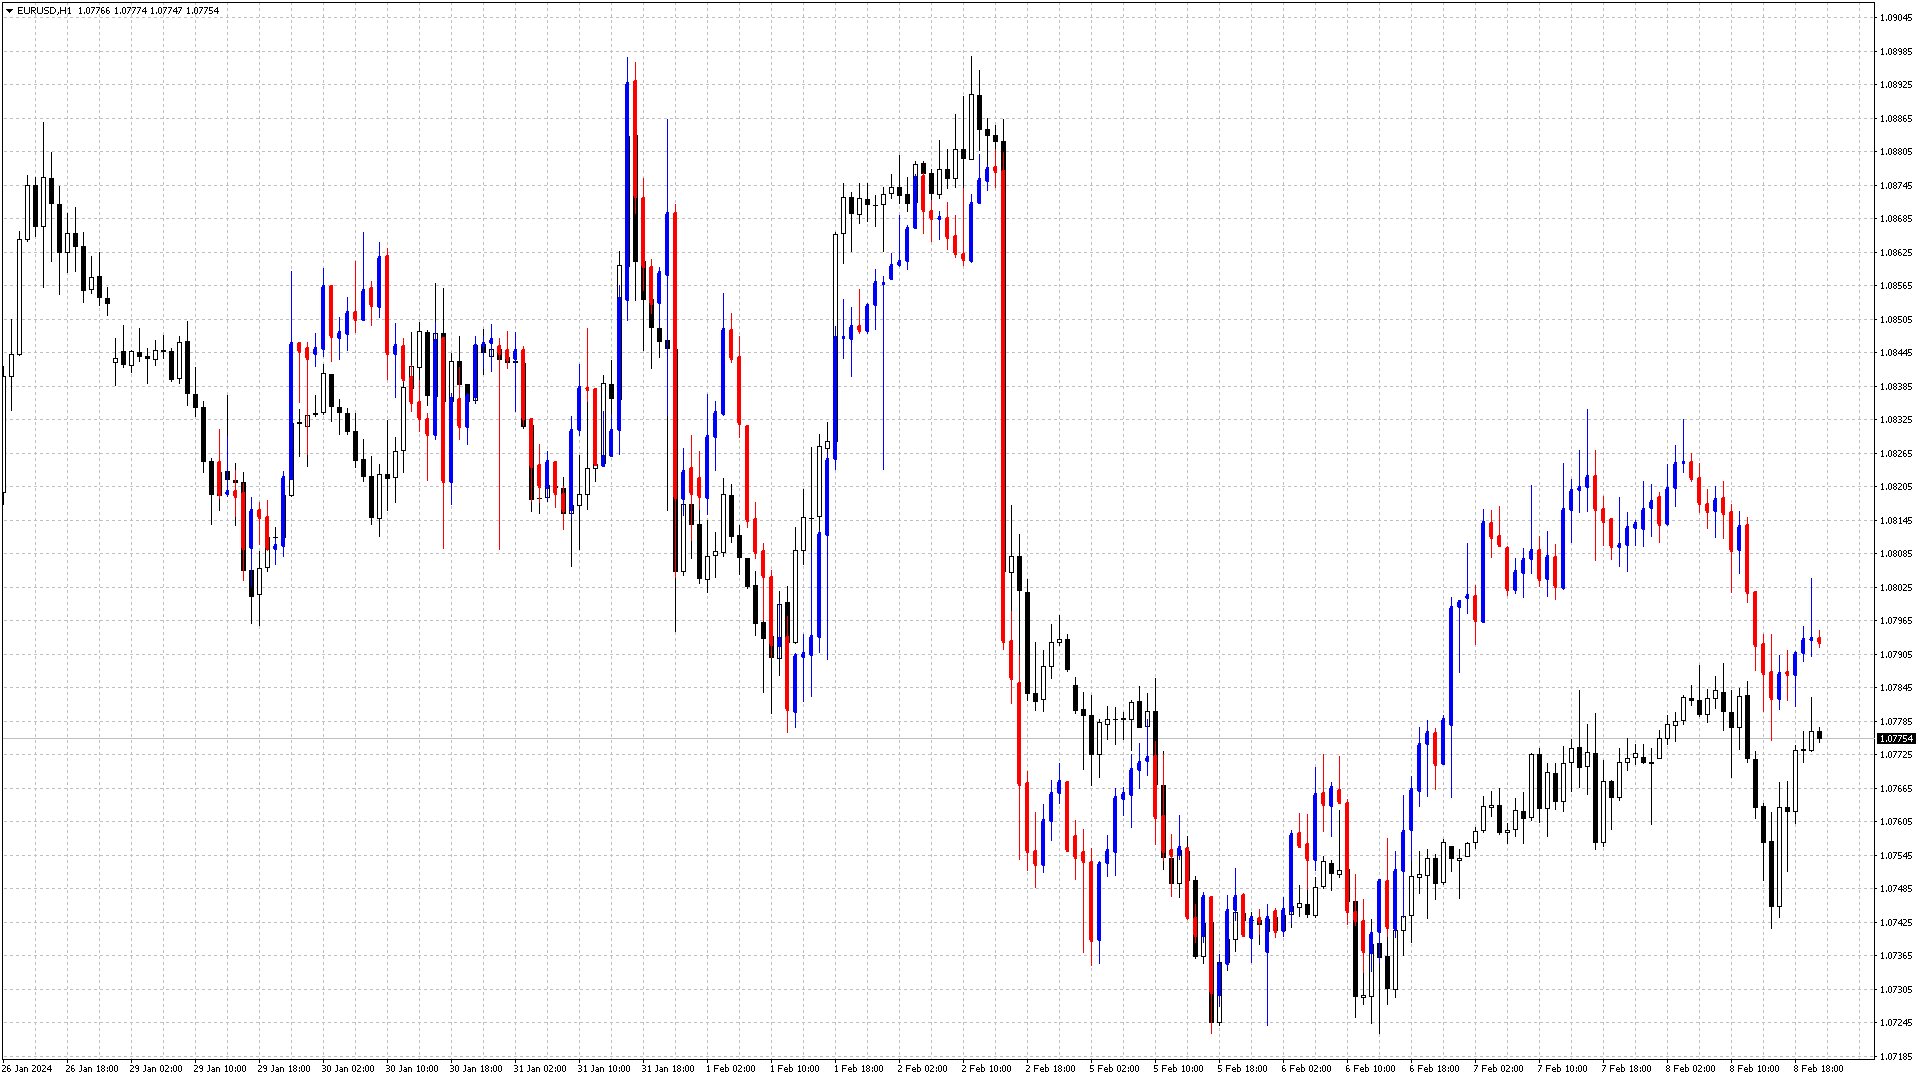
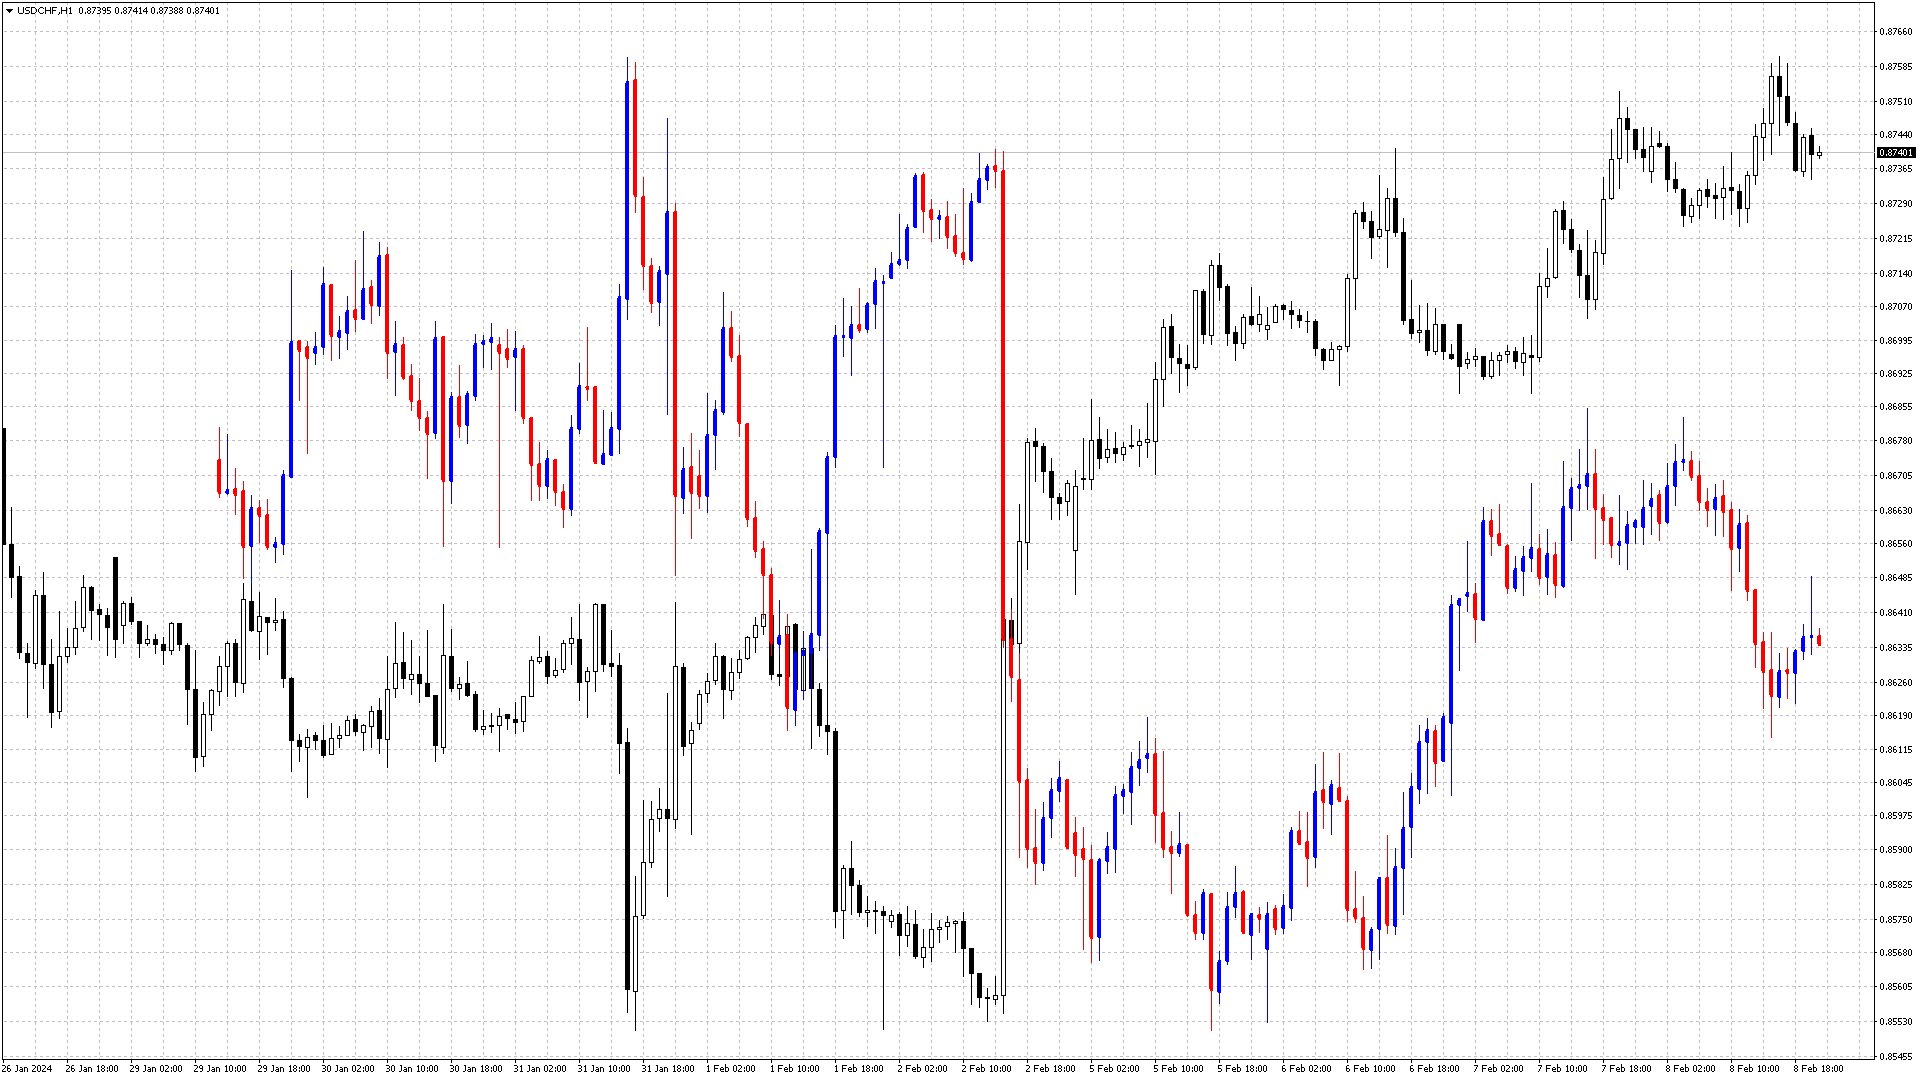
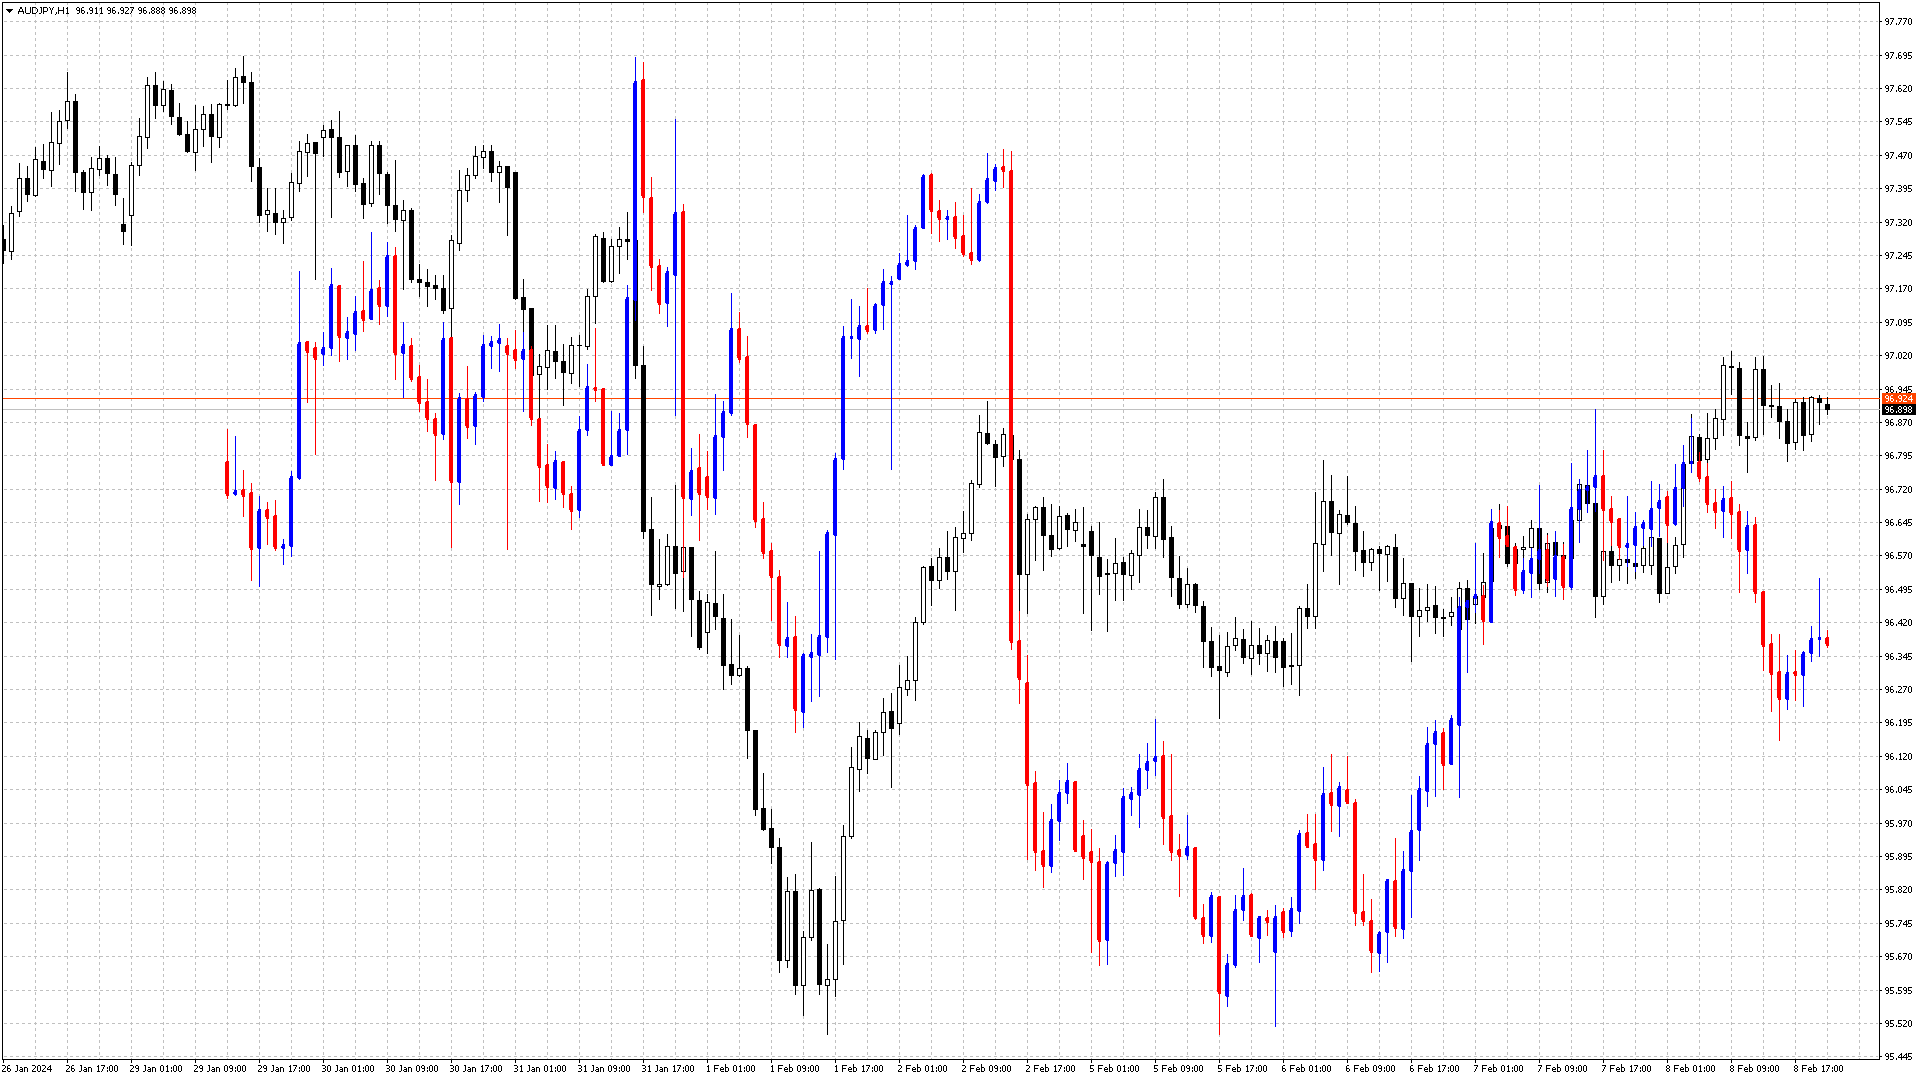
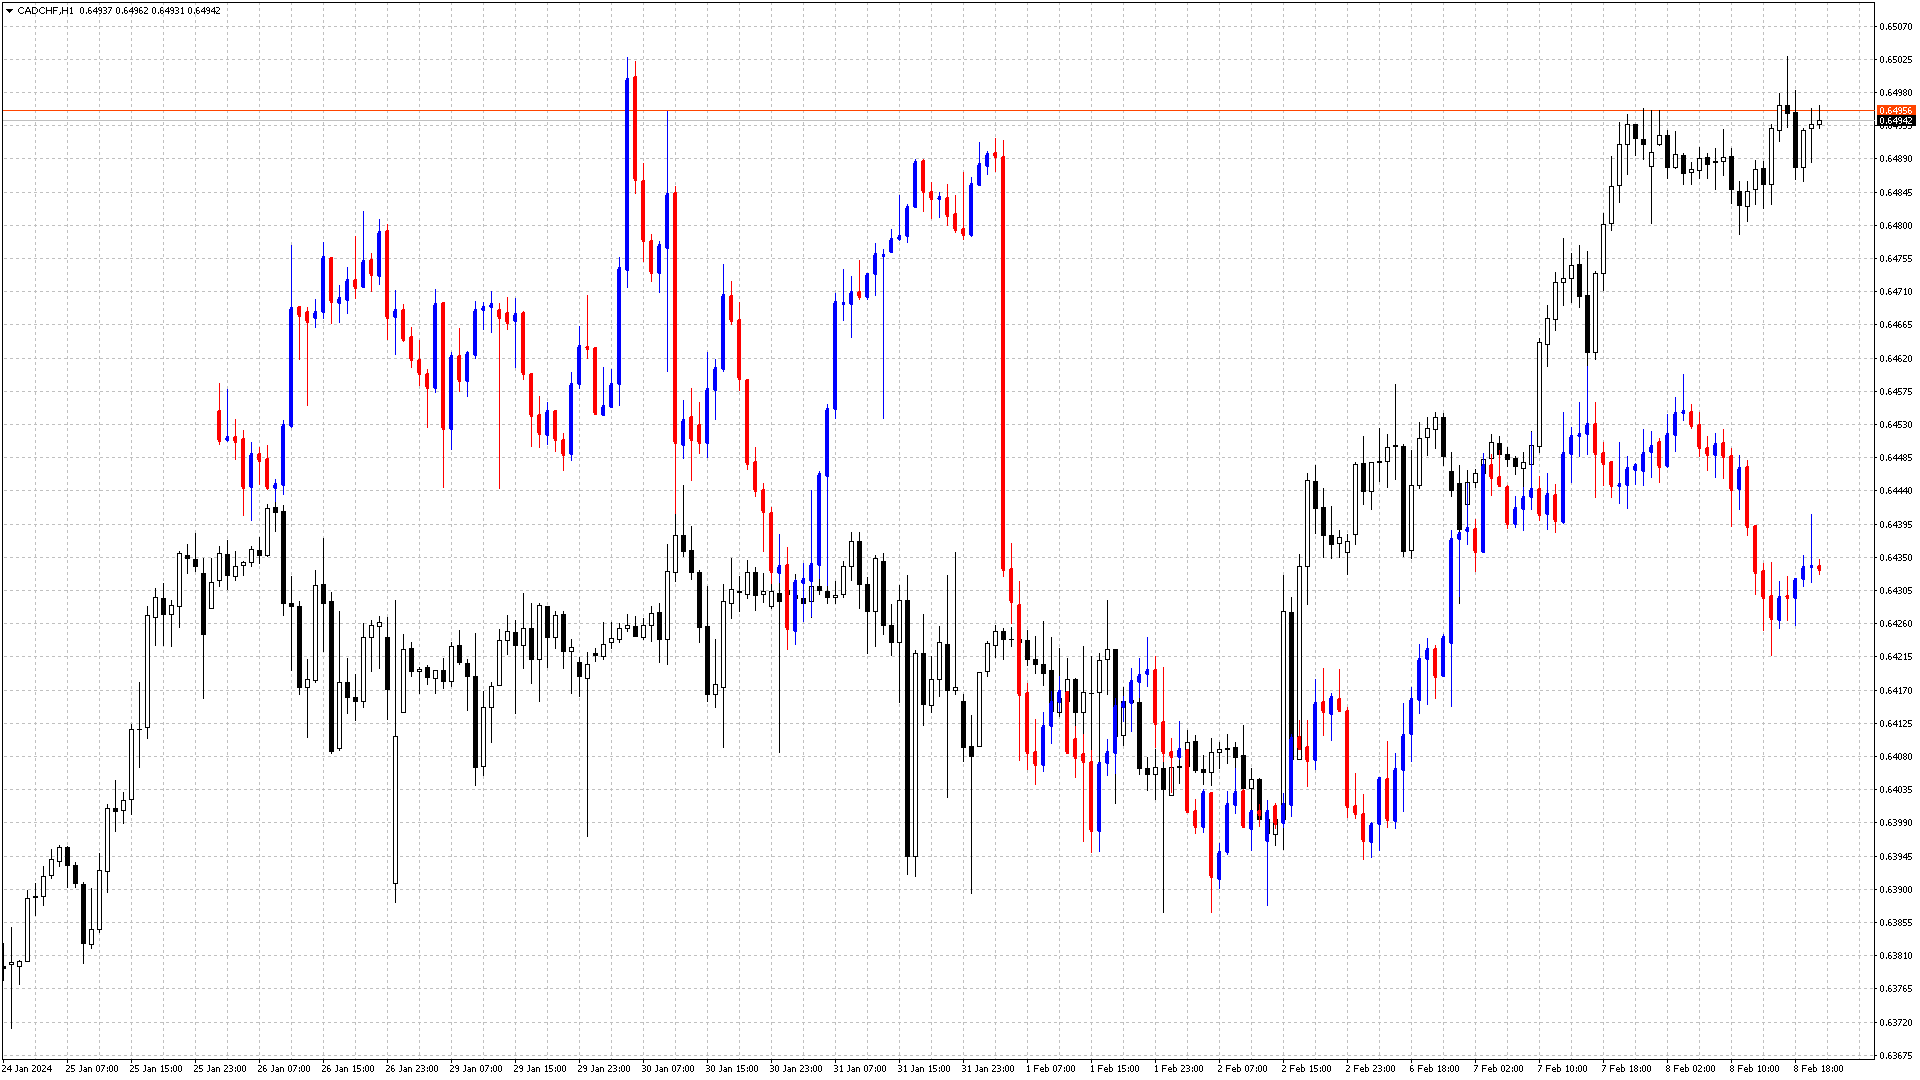
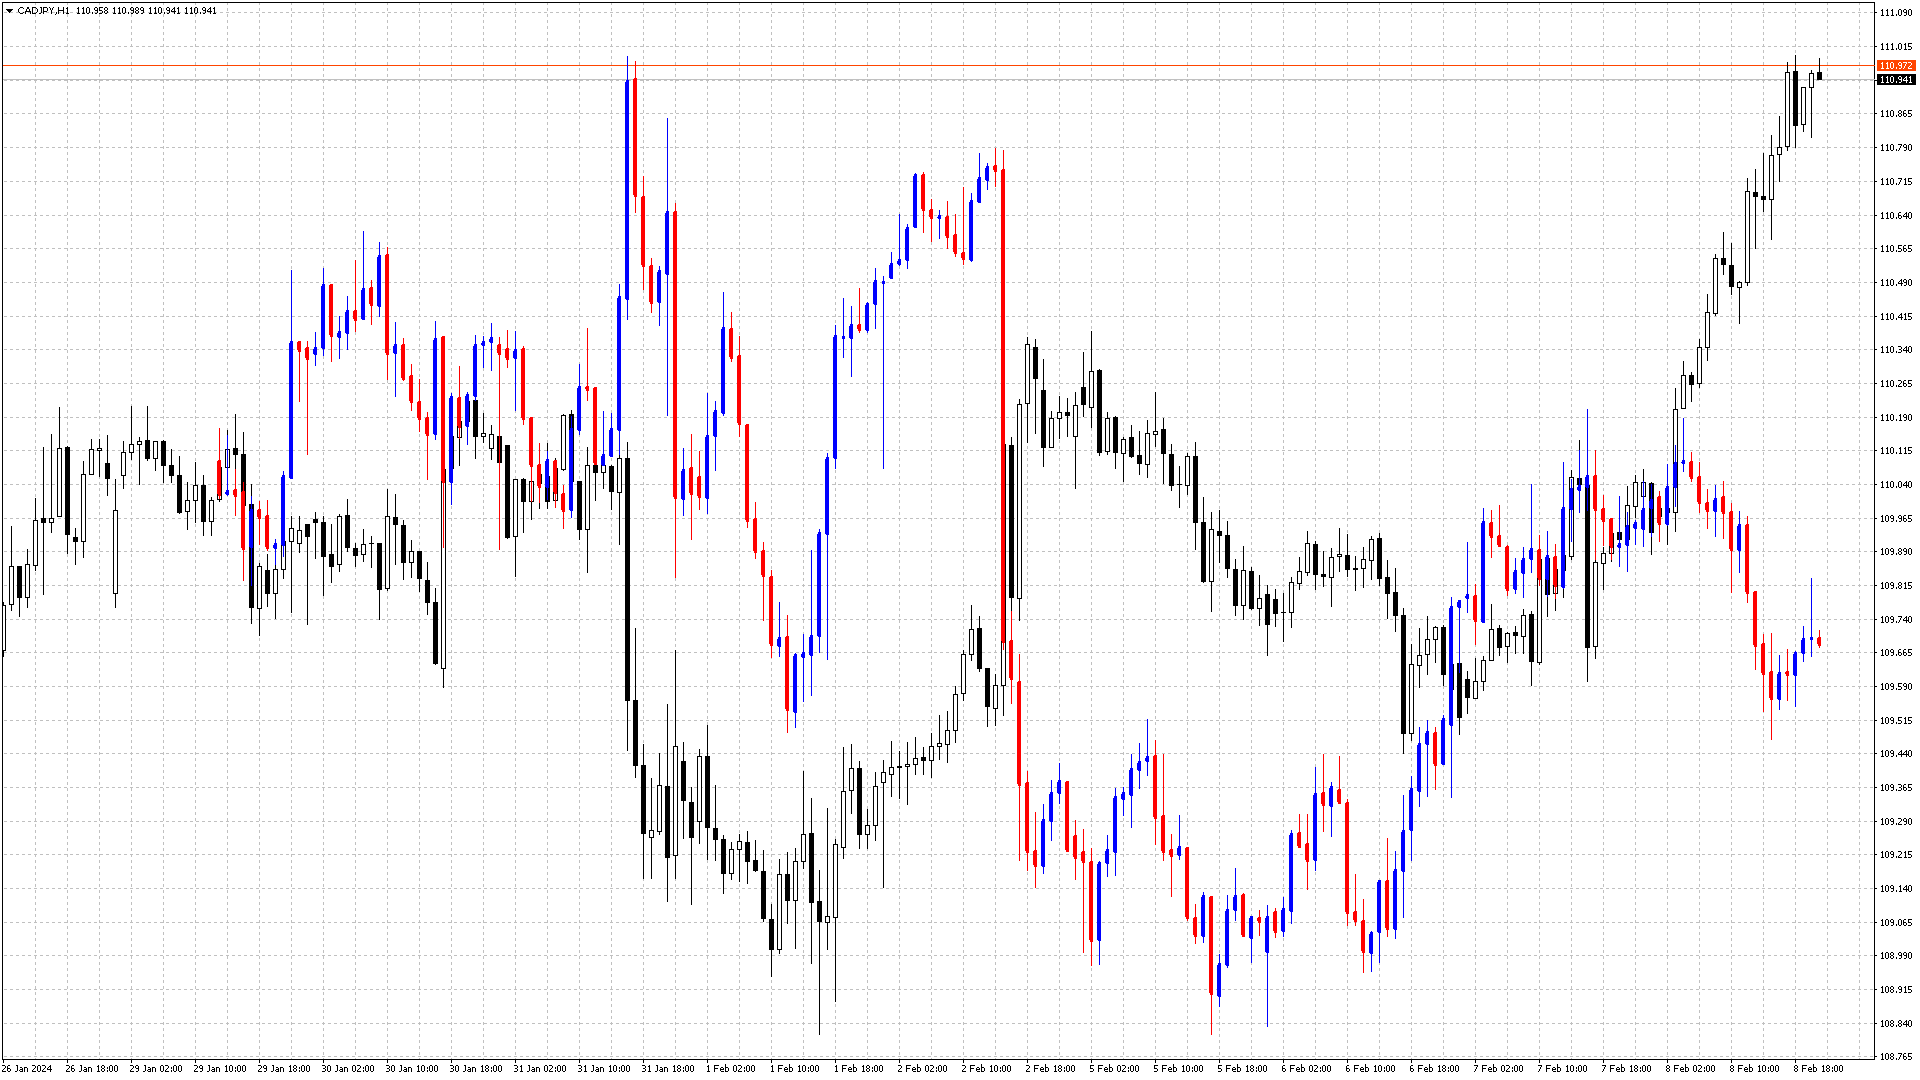
Der Indikator " Compare Graphs" ist ein Analysewerkzeug, das es Händlern ermöglicht, zwei oder mehr Diagramme im selben Chartfenster zu vergleichen. Dieser Indikator wird häufig in Handelsplattformen wie MetaTrader verwendet und ermöglicht einen klareren Vergleich verschiedener Finanzinstrumente oder Zeitrahmen.
Der Indikator Compare Graphs kann folgende Funktionen haben:
- Auswahl der Charts: Der Händler kann die Charts auswählen, die er vergleichen möchte, z. B. Kurscharts verschiedener Währungspaare oder Indikatoren im selben Chart.
- Einstellungen: Der Indikator kann verschiedene Einstellungen vornehmen, um sich an die Bedürfnisse des Händlers anzupassen, z. B. die Auswahl von Farben, Linientypen usw.
- Dynamische Analyse: Mit diesem Indikator können Händler die Dynamik von Veränderungen zwischen Charts analysieren und Ähnlichkeiten oder Unterschiede in der Bewegung von Preisen oder anderen Indikatoren erkennen.
- Zoomen und Verschieben: Der Indikator bietet Zoom- und Verschiebeoptionen für Charts, um Daten besser vergleichen zu können.
Der Indikator "Compare Graphs" kann ein nützliches Werkzeug für Händler sein, die eine tiefer gehende Analyse des Marktes durchführen und verschiedene Aspekte der Preisbewegung oder andere Faktoren, die den Handel beeinflussen, vergleichen möchten. Der Vergleich von Charts auf dem Devisenmarkt ist ein wichtiges Instrument für die Analyse und Entscheidungsfindung von Händlern. Der Vergleich von Charts hilft Händlern, fundiertere Entscheidungen über das Eingehen von Geschäften, das Risikomanagement und das Verlassen von Positionen auf dem Forex-Markt zu treffen.