Angle High Low MT5
- Indikatoren
- Version: 1.30
- Aktualisiert: 10 Juni 2020

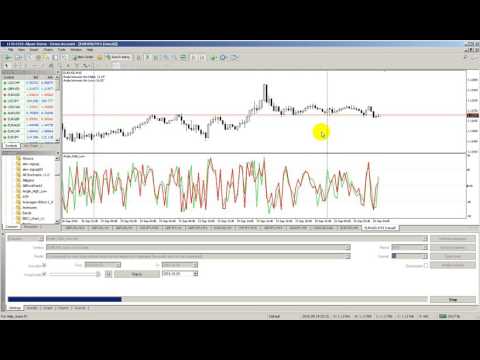
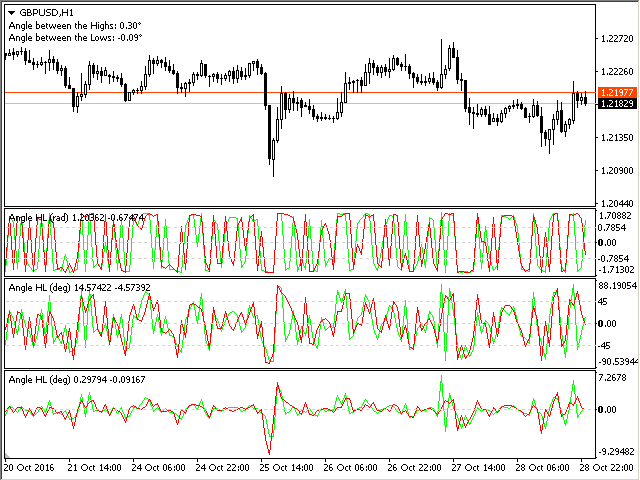
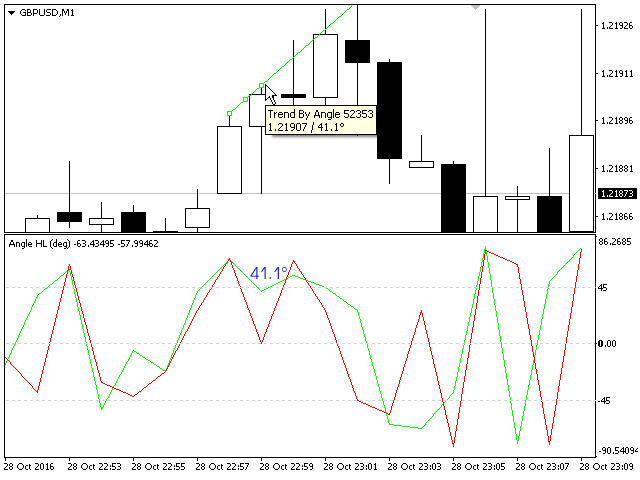
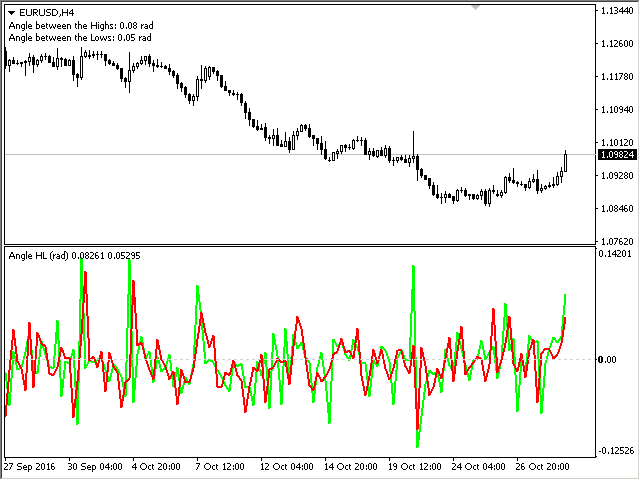
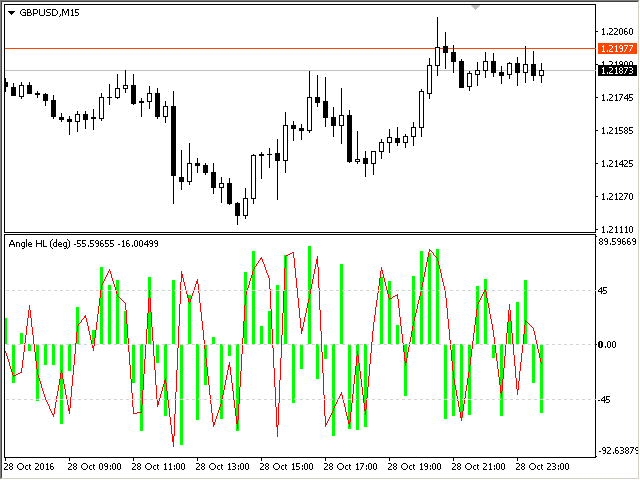
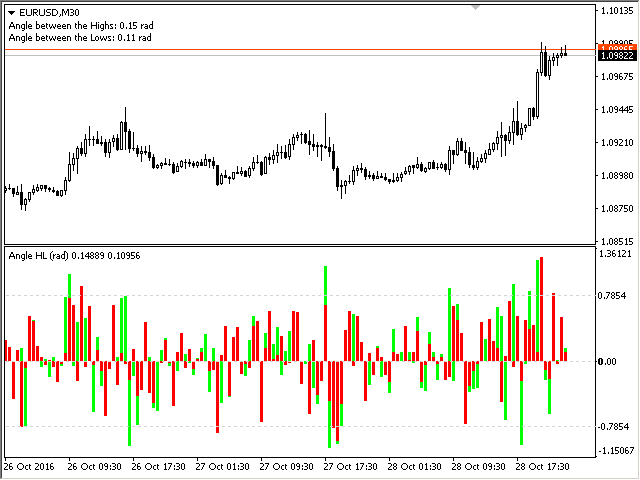
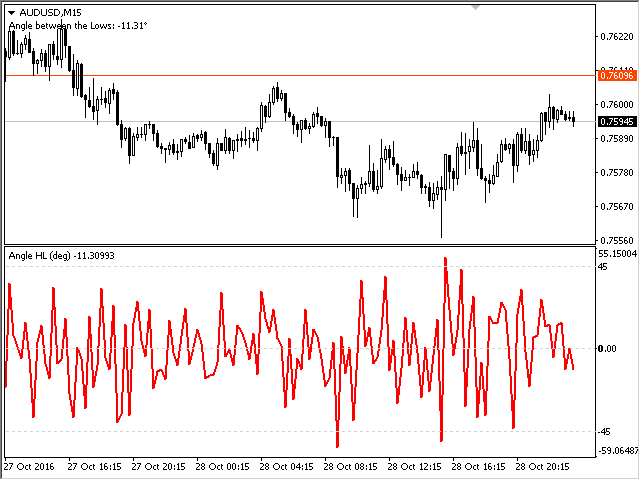
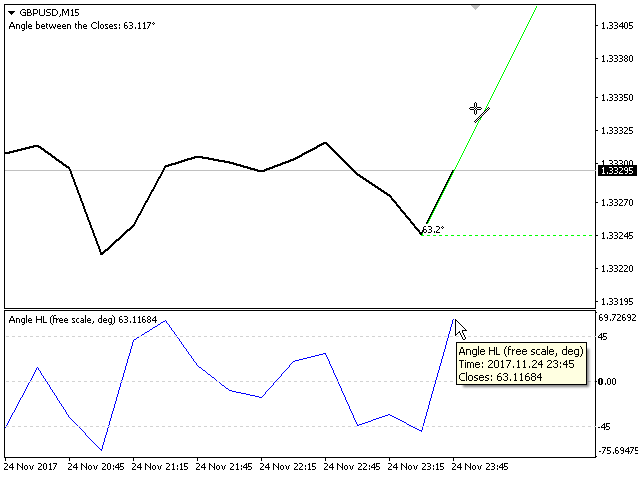
Der Indikator berechnet den Neigungswinkel zwischen den Hochs, Tiefs und Schlusskursen benachbarter Balken. Der Winkel kann in Grad oder Radiant gemessen werden. Ein lineares Diagramm oder ein Histogramm wird in einem Unterfenster gezeichnet. Sie können die Skala für die Berechnung festlegen - gleitend oder fest.
Für die Verwendung in Expert Advisors oder Indikatoren müssen Sie eine feste Skala angeben.
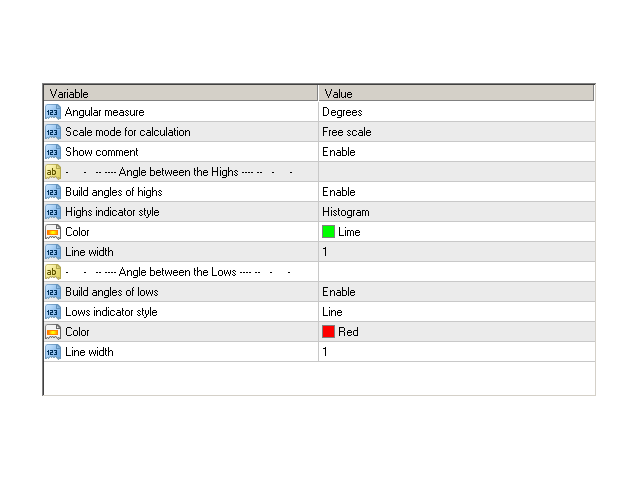
Parameter
- Winkelmaß - Grad oder Radiant.
- Maßstabsmodus für die Berechnung - Skalierungsmodus. Freier Maßstab - freie Transformation, der Indikator berechnet die Werte jedes Mal, wenn der Maßstab des Charts geändert wird. Fester Maßstab 1:1 - fester Maßstab (die Daten werden nicht geändert, wenn sich der Maßstab des Diagramms ändert), die Berechnungen werden im Maßstab 1:1 des Diagramms durchgeführt. Fest 1:10 - fester Maßstab 1:10, 1 Einheit entlang der Y-Achse wird verzehnfacht. Weitere Maßstäbe ändern sich entsprechend.
- Kommentar anzeigen - zeigt die aktuellen Daten in einem Kommentar an.
- Indikatorebene 1 - Wert 1 für die Indikatorebene.
- Indikatorstufe 2 - Wert 2 für die Indikatorstufe.
- Indikatorstufe 3 - Wert 3 für die Indikatorstufe.
- Winkel von Closes erstellen - ermöglicht das Plotten von Winkeln auf der Basis von Closes.
- Stil - Zeichenstil für Closes: Linie oder Histogramm.
- Farbe - die Farbe der Close-Linien.
- Linienbreite - die Breite der Close-Linien.
- Winkel von Highs bilden - aktiviert das Plotten von Winkeln auf der Basis von Highs.
- Stil - Zeichenstil für Highs: Linie oder Histogramm.
- Farbe - die Farbe der High-Linien.
- Linienbreite - die Breite der High-Linien.
- Build angles of Lows - aktiviert das Plotten von Winkeln auf der Basis von Lows.
- Stil - Zeichenstil für Lows: Linie oder Histogramm.
- Farbe - die Farbe der Low-Linien.
- Linienbreite - die Breite der Low-Linien.
Die feste Skala in MT5 unterscheidet sich um das 10-fache von der gleichen Skala in MT4.
Für die Verwendung im EA müssen Sie eine feste Skala angeben.


Der Benutzer hat keinen Kommentar hinterlassen