Heikin Ashi Dashboard MT5
- Indikatoren
- Version: 2.80
- Aktualisiert: 19 Juli 2026
- Aktivierungen: 10

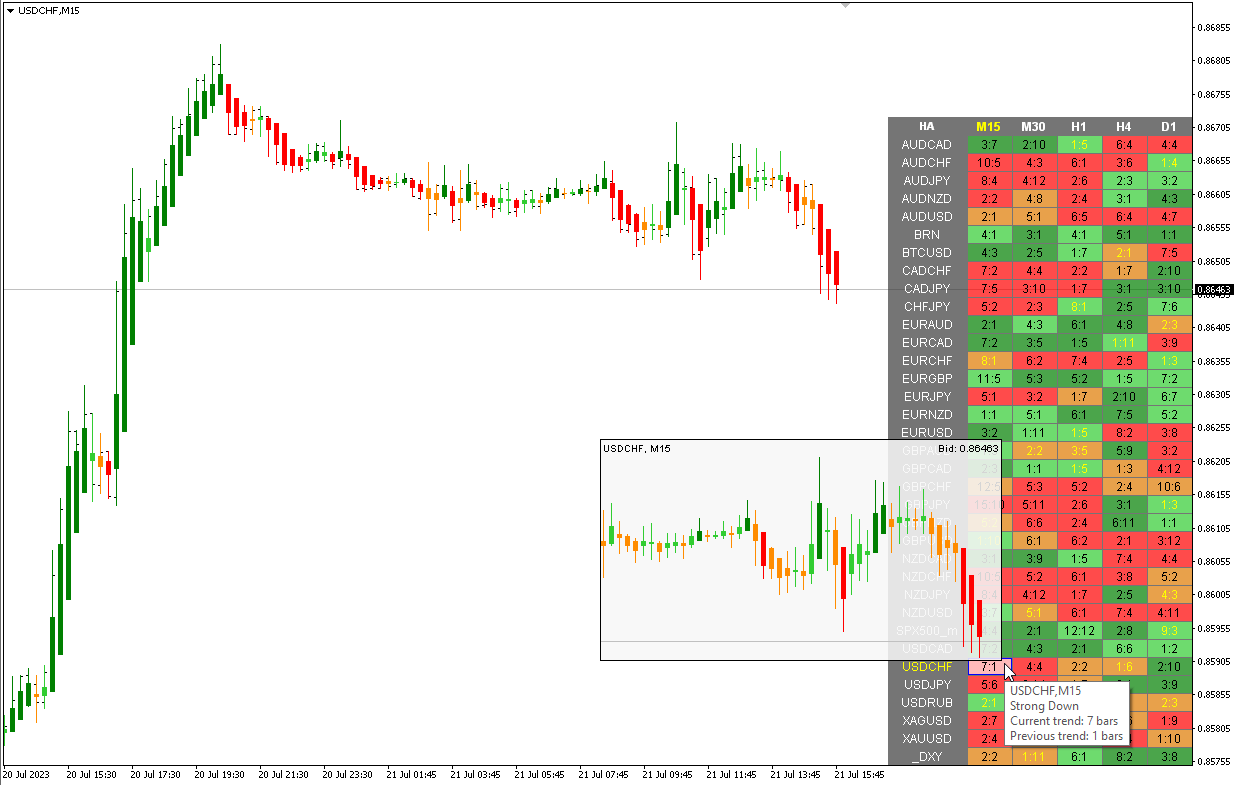
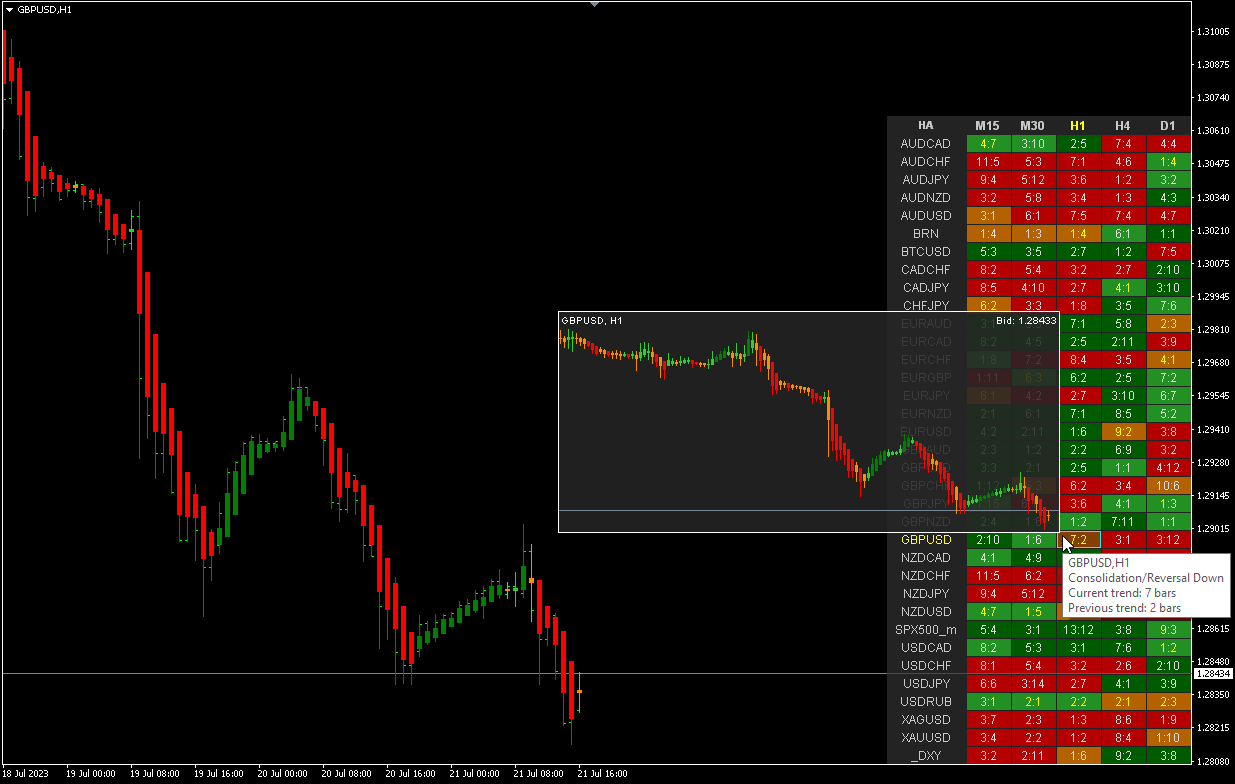
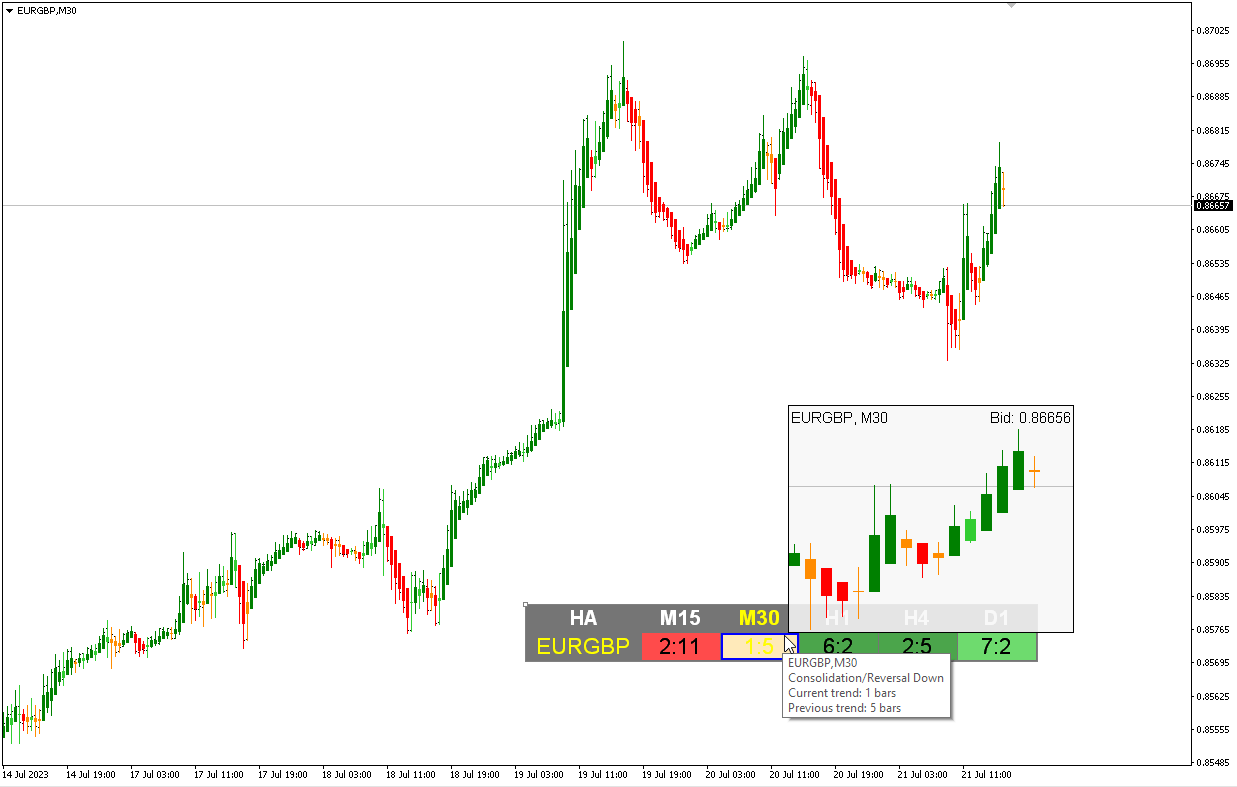
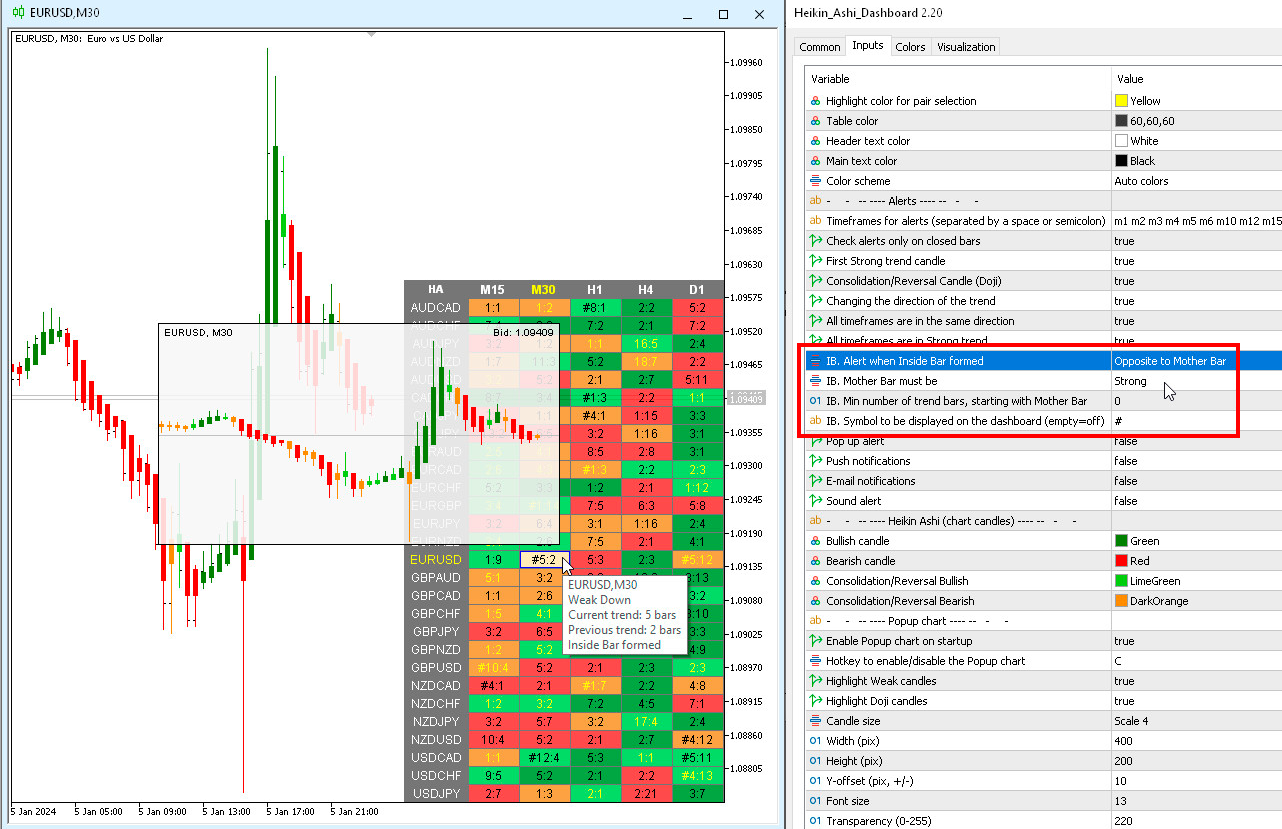
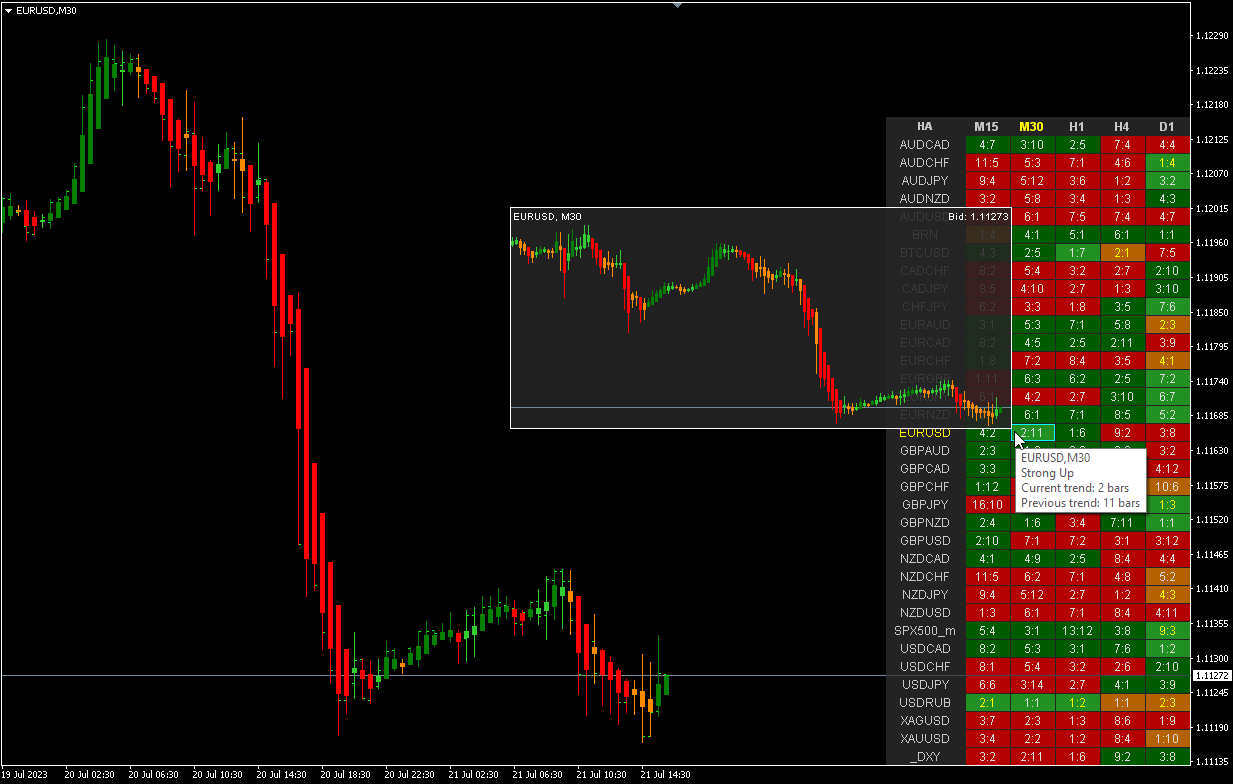
Heikin-Ashi-Indikator für mehrere Währungen und Zeitrahmen. Zeigt den aktuellen Zustand des Marktes an. Im Scanner-Bereich sehen Sie die Richtung, die Stärke und die Anzahl der Balken des aktuellen Trends. Die Konsolidierungs- und Umkehrkerzen werden ebenfalls farblich hervorgehoben. In den Parametern können Sie beliebige Währungen und Zeiträume festlegen. Außerdem kann der Indikator Benachrichtigungen senden, wenn sich der Trend ändert oder wenn Umkehr- und Konsolidierungskerzen (Doji) erscheinen. Durch Klicken auf eine Zelle werden dieses Symbol und der entsprechende Zeitraum geöffnet. Dies ist der MTF-Scanner – HA-Dashboard
Heikin-Ashi is a Japanese trading indicator and financial chart that means "average pace". Heikin-Ashi charts resemble candlestick charts, but have a smoother appearance as they track a range of price movements, rather than tracking every price movement as with candlesticks. Heikin-Ashi was created in the 1700s by Munehisa Homma, who also created the candlestick chart. These charts are used by traders and investors to help determine and predict price movements.
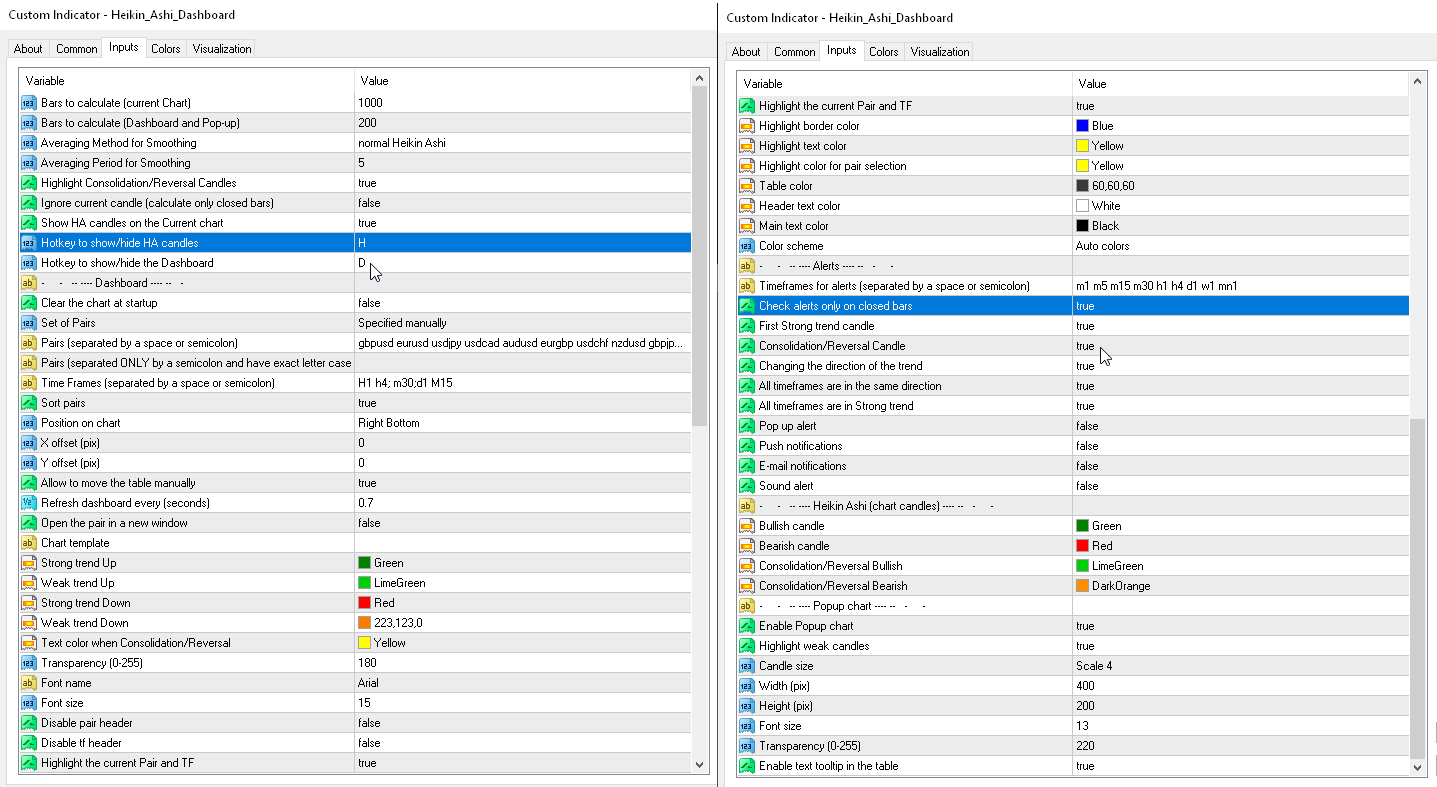
Parameter
- Mittelwertbildungsmethode zur Glättung – Auswahl einer Methode zur Glättung der Kerzenkurse.
— Einfacher gleitender Durchschnitt (MA)
— Exponentieller gleitender Durchschnitt (MA)
— Geglätteter gleitender Durchschnitt (MA)
— Linear gewichteter gleitender Durchschnitt (MA)
— Normaler Heikin Ashi
- Durchschnittszeitraum für die Glättung — Auswahl des Zeitraums für die Glättung
- Aktuelle Kerze ignorieren (nur geschlossene Kerzen berechnen) — Deaktiviert die Anzeige der aktuellen (noch nicht geschlossenen) Kerze.
- HA-Kerzen im aktuellen Chart anzeigen — Heiken-Ashi-Kerzen werden im aktuellen Chart dargestellt.
- Konsolidierungs-/Umkehrkerzen (Doji) anzeigen.
- Doji. Verhältnis der Körperlänge zur Kerzenlänge, % (Körper <= %) — Der Parameter legt die Größe des Kerzenkörpers als Prozentsatz im Verhältnis zur Größe der gesamten Kerze fest. Der Körper sollte <= diesem Prozentsatz sein.
- Doji. Verhältnis von Dochtlänge zur Kerzenlänge, % (jeder Docht >= %) – Dieser Parameter legt die Größe des oberen und unteren Dochtes als Prozentsatz im Verhältnis zur Größe der gesamten Kerze fest. Jeder Docht muss mindestens diesen Prozentsatz betragen.
- Tastenkombination zum Ein- und Ausblenden der HA-Kerzen.
- Hotkey zum Ein- und Ausblenden des Dashboards.
Symbolauswahl — Auswahlan Symbolen
— Marktüberwachung — Paare aus der „Marktüberwachung“ des MT.— Manuell festgelegt — manuell festgelegte Währungspaare in den Parametern „Pairs“.— Aktuelles Paar — nur das aktuelle Paar anzeigen.
Paare (durch Leerzeichen oder Semikolon getrennt) — Liste von Symbolen, die durch Leerzeichen oder Semikolons getrennt sind. Die Währungsbezeichnungen sollten genau wie beim Broker geschrieben werden, wobei Groß- und Kleinschreibung sowie Präfixe und Suffixe beibehalten werden müssen.
Zeitrahmen (durch Leerzeichen oder Semikolon getrennt) — Liste von Zeitrahmen, die durch Leerzeichen oder Semikolons getrennt sind (mehrere Zeitrahmen).
Paare sortieren — Sortierung der Liste der Paare.
Position im Chart — Ecke, an der das Panel im Chart angezeigt werden soll.
X-Versatz (Pixel) — Verschiebung des Fensters entlang der X-Achse;
Y-Versatz (Pixel) — Verschiebung des Fensters entlang der Y-Achse;
Dashboard alle (Sekunden) aktualisieren — Aktualisierungsintervall für alle Paare und Zeitrahmen.
Paar in einem neuen Fenster öffnen — Ein Symbol durch Anklicken in einem neuen Chartfenster öffnen.
Chartvorlage — der Name der Vorlage für das Chart, falls das Chart in einem neuen Fenster geöffnet wird.
Starker Aufwärtstrend — Farbe für einen starken Aufwärtstrend.
Schwacher Aufwärtstrend — Farbe für einen schwachen Aufwärtstrend.
Starker Abwärtstrend — Farbe für einen starken Abwärtstrend.
Schwacher Abwärtstrend — Farbe für einen schwachen Abwärtstrend.
Textfarbe bei Konsolidierung/Trendwende — Hervorhebungsfarbe (und Kerzen im Chart) für Konsolidierungs-/Trendwende-Balken.
Transparenz (0–255).
Schriftart.
Schriftgröße.
Benachrichtigungen nur prüfen, wenn die Kerze geschlossen ist.
Alle Zeitrahmen befinden sich in einem starken Trend – Diese Benachrichtigungen werden einmal pro Balken entsprechend dem minimalen Zeitrahmen im Dashboard gesendet. Der Parameter „Zeitrahmen für Benachrichtigungen“ wird dabei nicht berücksichtigt.
Alle Zeitrahmen weisen dieselbe Richtung auf – Diese Benachrichtigungen werden einmal pro Balken entsprechend dem im Dashboard festgelegten Mindestzeitrahmen gesendet. Der Parameter „Zeitrahmen für Benachrichtigungen“ wird dabei nicht berücksichtigt.

Very good Indicator