Technische Indikatoren für den MetaTrader 5 - 51

Der RFOC Mini Chart wurde erstellt, um eine Makroansicht des Marktes zu projizieren, die die Möglichkeit bietet, einen anderen Zeitrahmen als den Hauptchart auszuwählen. Es ist möglich, 2 Indikatoren einzubinden: 1 - Kanal des gleitenden Durchschnitts Im Mini-Chart wird der gleitende Durchschnitt auf der Grundlage der Preise des für den RFOC Mini Chart ausgewählten Zeitrahmens erstellt. Die Periode des gleitenden Durchschnitts muss im Einstellungsfenster des Indikators ausgewählt werden.
2 - Bo
FREE

MT5 Hüllkurven-Muster-Detektor: Ihr Wettbewerbsvorteil beim Handel Sind Sie auf der Suche nach einem Tool, das Ihnen hilft, die besten Handelsmöglichkeiten auf dem Devisenmarkt genau zu identifizieren? Unser Engulfing Pattern Detector liefert Ihnen ein äußerst zuverlässiges Kauf- oder Verkaufssignal, das auf einem der bekanntesten und effektivsten japanischen Candlestick-Muster basiert: dem Engulfing-Muster. Mit einer durchschnittlichen Erfolgsquote von 70 % ermöglicht Ihnen dieser Indikator, si
FREE

Ein kostenloses Panel für die Ergebnisse der Handelsgeschichte. Sein Funktionsprinzip besteht darin, das monatliche Einkommen durch Abfrage historischer Handelsaufzeichnungen zu berechnen und in einem Tabellenformat anzuzeigen. Gleichzeitig werden alle Handelsergebnisse des aktuellen Kontos statistisch erfasst, so dass die Händler ihre Handelsstrategien auf der Grundlage historischer Daten anpassen können. Wenn Sie weitere Anforderungen haben, wenden Sie sich bitte an den Entwickler.
FREE
Trading Guide MT5 Indikator - Ultimativer Assistent der Handelspsychologie Beschreibung
Der Trading Guide MT5-Indikator ist ein leistungsstarker psychologischer Handelsassistent, der dafür sorgt, dass Trader diszipliniert, konzentriert und emotional ausgeglichen bleiben. Dieser innovative Indikator zeigt motivierende Botschaften, Handelsregeln und Analyserichtlinien in Echtzeit direkt auf Ihrem Chart an, mit leuchtenden, blinkenden Farben, um Ihre Aufmerksamkeit zu erregen und die richtigen Ha
FREE
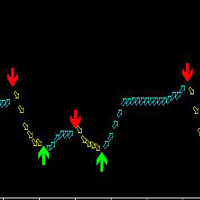
Diese indikatoren auf jeder für den metatrader 5 sorten, aber auch für jeden zyklus, aber am besten geeignet IST in 30 minuten und 4 stunden Zeit, MIT einfachen, pfeil erscheint Absolut nicht verändern, nicht treiben, nicht danach.
Der index beruht auf dem Prinzip der ATR und benutzerdefinierte ma plus gemischt, berechnung und erfunden, präzise.
Kaufen: sehen Die Grünen pfeil nach Oben.
Zu verkaufen: der rote pfeil nach Unten zu sehen.
Pfeil erscheint sofort bestellen!
Vorschlag für zwei re

Timer
Countdown-Timer für Kerzenschluss.
FUNKTIONEN:
- Exakter Countdown bis zum Kerzenschluss
- Funktioniert auf allen Zeitrahmen (M1 bis MN)
- 2 Anzeigeformate
- Anpassbare Schriftfarbe und -größe
- Einstellbare Position auf dem Chart
- Echtzeitaktualisierung jede Sekunde
IDEAL FÜR:
- Scalping und Daytrading
- Handel mit präzisem Timing
- Üben Sie Zeitmanagement im Betrieb
- Alle Trader, die eine Timingkontrolle benötigen
Wollen Sie mehr?
Upgraden Sie auf Timer PRO und erhalten
FREE

Dies ist der Gekko-Indikator für Notierungen und Schwankungen. Er fasst die Notierungen und Schwankungen des aktuellen Symbols in verschiedenen Zeitrahmen sowie anderer korrelierter Symbole zusammen. Behalten Sie all diese Informationen auf Ihrem Chart im Auge, während Sie verhandeln, um Ihre Entscheidungsfindung zu unterstützen. Eingabe-Parameter Allgemeine Einstellungen: Konfigurieren Sie, welche Notierungen und Variationen Sie für den aktuellen Tag, die Woche, den Monat oder das Jahr sowie fü
FREE

Guten Tag! Heute haben wir eine zusätzliche Trend-Indikator DveMashkiTompson, die Idee ist von der analogen MT4 genommen und MT5 übertragen, in Verbindung mit den Trend-Indikatoren TMA und MA verwendet wird, zeichnet rote und grüne Bereiche je nach Richtung des Marktes. Die Bereiche basieren auf dem Schnittpunkt des MA-Indikators, so dass dieser Indikator liefert Informationen der grafischen Inhalt für eine schnellere Beurteilung der Situation und Entscheidungsfindung.
FREE

Die Idee des Indikators ist es, die Farbe zu ändern, sobald die Kerze das Band durchbricht; Wenn die Kerze das obere Band durchbricht, färbt er die Kerze rot, Wenn die Kerze das untere Band durchbricht, wird die Kerze grün gefärbt, Wenn die Kerze irgendwann den Durchschnitt durchquert, nimmt sie eine graue Farbe an; Kerzen, die den Durchschnitt nicht durchqueren oder das Band nicht durchbrechen, werden schwach grün gefärbt, wenn sie bullisch sind, und schwach rot, wenn sie bearisch sind. und ein
FREE
Ein Kaufsignal wird auf dem Dashboard angezeigt, wenn das vorherige Signal rot und das nächste Signal grün ist, der SAR grün ist und der RSI grün ist.
Ein Verkaufssignal wird auf dem Dashboard angezeigt, wenn das vorhergehende Signal grün und das folgende Signal rot ist, dann ist der SAR rot und der RSI rot.
Linienfunktion - zeigt auf dem Chart die Linien von Eröffnung, Stop Loss und Take Profit an. Mit dieser Funktion ist es einfach, einen neuen Auftrag zu erstellen und seine zusätzlichen Me
FREE
Ist Zero Lag profitabel? Nicht immer, verschiedene Systeme sind für verschiedene Paare. Sie können mit diesem Indikator von Mladen herumspielen, ich habe ihn mit Bollinger Bands über T3 modifiziert.
Sie können den Zeitraum und die Art der Berechnung ändern. MT4 Version wird bald auch veröffentlicht werden. Bitte hinterlassen Sie eine Bewertung, es hilft uns und wir werden mehr Indikatoren teilen. .... Vielen Dank und viel Spaß beim Trading
FREE
Pause Manager Indikator (für EA Pause Manager)
Was ist das? Dies ist ein leichter Chart-Indikator, der mit dem EA Pause Manager Dienstprogramm zusammenarbeitet. Er zeigt den aktuellen Status Ihrer EAs an und sendet diese Informationen an den EA Pause Manager, damit dieser sie korrekt pausieren/fortsetzen kann. Erforderlich für das ordnungsgemäße Funktionieren des EA Pause Managers .
Merkmale : Zeigt den Echtzeit-Status (AKTIV / PAUSIERT) des EAs auf dem Chart an Zeigt die EA ID (EA1-EA4) an, an
FREE

Sind Sie es leid, die Einstellungen der Indikatoren zu ändern und dabei wertvolle Zeit zu verlieren? Müde von der Unsicherheit bezüglich ihrer Effizienz? Haben Sie Angst vor der Ungewissheit bezüglich ihrer Rentabilität? Dann ist der Indikator ACI (automatisch kalibrierbarer Indikator) genau das Richtige für Sie. Wenn Sie ihn starten, können Sie diese drei Probleme ganz einfach lösen, indem Sie nur auf eine einzige Schaltfläche "Kalibrieren" klicken. Um die höchste Effizienz zu erreichen, sollte
FREE

Indikator, der die Momente des Überschreitens wichtiger Niveaus des RSI-Indikators anzeigt. Er kann verwendet werden, um die Momente des Überschreitens der Niveaus für einen erfolgreichen Bounce oder Trendhandel zu finden.
Eingabeparameter Informieren über das Finden des Signals - der Parameter, der für den Empfang von Benachrichtigungen (Alert) über das gefundene Signal verantwortlich ist. Standardmäßig - keine RSI Periode - RSI Periode für den Betrieb RSI Max - Wert des maximalen RSI-Limits
FREE

Einführung in den GARCH-Indikator GARCH ist die Abkürzung für Generalized Autoregressive Conditional Heteroskedasticity (verallgemeinerte autoregressive bedingte Heteroskedastizität) und ist ein in der Finanzbranche häufig verwendetes Volatilitätsvorhersagemodell. Das GARCH-Modell wurde erstmals 1986 von dem dänischen Wirtschaftswissenschaftler Tim Peter Bollerslev vorgestellt. Der Nobelpreisträger von 2003, Robert F. Engle, leistete mit Tims Arbeit ebenfalls einen wichtigen Beitrag zur Verfeine
FREE

Kurzbeschreibung Consensus MTF ist ein kostenloser Multi-Timeframe-Alignment-Indikator, der den realen Marktkontext anzeigt.
Er generiert keine Einstiegs- oder Ausstiegssignale. Er soll Ihnen helfen, den Handel zu vermeiden, wenn der Markt nicht ausgerichtet ist . Vollständige Beschreibung Consensus MTF analysiert die Richtung des Marktes über mehrere Zeitrahmen gleichzeitig und bewertet die Preisposition im Verhältnis zu ihrem Gleichgewichtsniveau in jedem Zeitrahmen. Jeder Zeitrahmen wir
FREE

Hochgradig konfigurierbarer Indikator für Akkumulation und Verteilung (AD). Merkmale: Hochgradig anpassbare Alarmfunktionen (bei Levels, Kreuzen, Richtungsänderungen per E-Mail, Push, Sound, Popup) Multi-Timeframe-Fähigkeit Farbanpassung (bei Pegeln, Kreuzen, Richtungsänderungen) Optionen für lineare Interpolation und Histogramm-Modus Funktioniert im Strategie-Tester im Multi-Timeframe-Modus (auch am Wochenende ohne Ticks) Einstellbare Levels Parameter:
Ad Timeframe: Sie können die unteren/höhe
FREE

Nicht-proprietäre Studie von Joe Dinapoli, die zur Trendanalyse verwendet wird. Der Indikator gibt Trendsignale, wenn die schnelle Linie die langsame Linie durchdringt. Diese Signale bleiben erhalten, bis eine weitere Durchdringung erfolgt. Das Signal wird am Ende der Periode bestätigt. Er ist für alle Zeitrahmen anwendbar. Parameter Fast EMA: Periode des schnellen gleitenden Durchschnitts. Slow EMA: Periode des langsamen gleitenden Durchschnitts. Signal EMA: Periode der Signallinie. ***********
FREE
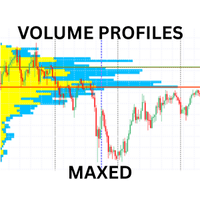
Erweiterter Volumenprofil-Indikator für MT5
Verändern Sie Ihren Handel mit professioneller Volumenanalyse. Dieser umfassende Volumenprofil-Indikator liefert Ihnen mit mehreren Profiltypen, einem fortschrittlichen Warnsystem und anpassbaren Anzeigeoptionen Markteinblicke in institutioneller Qualität. SCHLÜSSEL-EIGENSCHAFTEN Mehrere Profiltypen Sichtbares Bereichsprofil: Analysiert das Volumen innerhalb des aktuellen Chartfensters Festes Bereichsprofil: Benutzerdefinierte Datumsbereichsanalys

Der Thread-Indikator berechnet die möglichen Werte für die kommenden Perioden. Er wird vom System des Autors erstellt, mit der Fähigkeit zu lernen. Eingangsdaten (empfohlenes Intervall ): Empfindlichkeit gegenüber oszillierenden Bewegungen (ganzzahliger Wert, 0 - 8) Erhöhung des Wertes verschiebt die Priorität der Berechnung in Richtung hochfrequenter Schwingungen (Erhöhung belastet das System) Verschiebung des Diagramms (ganzzahliger Wert, 0 - 8) verschiebt den Ausgang des Indikators nach recht
FREE

Beschreibung des Horizontal Levels Indicator mit manueller Intervallanpassung Der Indikator ist für die automatische Darstellung von horizontalen Levels auf dem Chart eines Finanzinstruments konzipiert. Er ermöglicht es dem Benutzer, das Intervall zwischen den Niveaus manuell einzustellen, wodurch er an verschiedene Handelsstrategien und Zeitrahmen angepasst werden kann. Hauptmerkmale: Flexible Konfiguration : Benutzer können das Intervall zwischen den Levels in Punkten, Prozenten oder jeder and
FREE

Dies ist eine Demoversion des Candle Absorption Full Indikators. Er hat Einschränkungen in der Bedienung. Dieser Indikator erkennt das Engulfing Candlestick-Muster und zeichnet das entsprechende Markteinstiegssignal.
Eigenschaften Er funktioniert nur mit EURUSD auf den Zeitrahmen M1 und M5. Der Indikator analysiert je nach Einstellung eine Kombination von 2 oder 3 Candlesticks. Die Anzahl der vorberechneten Balken (Signale) ist konfigurierbar. Der Indikator kann einen Alarm senden, um über ein
FREE

Der Indikator ColorCandlesDaily zeichnet Kerzen mit unterschiedlichen Farben je nach Wochentag.
FREE

SPREADEX ist ein Indikator für MT4 und MT5, der den Abstand des ASSET vom GP anzeigt. Der GP ist der Preis des wahren Wertes des zugrunde liegenden ASSET, der durch Schätzung ermittelt wird. Der GP ist wie ein Magnet, er zieht den Preis des ASSET mit hoher Wahrscheinlichkeit und innerhalb desselben Handelstages an. So zeigt SPREADEX in Echtzeit an, welche Vermögenswerte im Moment am weitesten vom GP entfernt sind. Dies gibt dem Trader einen Anhaltspunkt, auf welche Vermögenswerte er sich konzent
FREE
Dies ist ein Arbitrage-Indikator. Der Indikator zeigt den Chart einer beliebigen Kombination von Handelsinstrumenten an, die durch die eingegebene arithmetische Formel beschrieben wird. Verwendung des Indikators. Fügen Sie einen Indikator zu einem beliebigen Chart hinzu. Geben Sie die Formel als String in die Parameter des Indikators ein. Alle in der Formel verwendeten Symbole müssen exakt mit den Namen in der Tabelle "Marktübersicht" des Terminals übereinstimmen. Beispiel für die Formel: (SIBN
FREE

Willkommen beim Provlepsis-Indikator.
"Provlepsis" ist ein hochentwickelter Indikator, der für den MQL-Markt entwickelt wurde. Durch die Analyse früherer Balken zur gleichen Tageszeit berechnet er präzise das potenzielle Kursbewegungsintervall und liefert wertvolle Einblicke in zukünftige Preisfluktuationen. Im Gegensatz zum traditionellen ATR-Indikator berücksichtigt "Provlepsis" den Zeitfaktor und ist damit ein leistungsstarkes Werkzeug, das sich an unterschiedliche Marktbedingungen anpasst. W
FREE

Schatten-Indikator: Das verborgene Potenzial jeder Kerze freisetzen! Müde von oberflächlicher Kursaktionsanalyse? Möchten Sie die Stärke von Käufern und Verkäufern in jedem Zeitrahmen tiefer verstehen? Wir präsentieren den Schatten-Indikator – Ihr unverzichtbares Werkzeug zur Visualisierung und Analyse der verborgenen Dynamik des Marktes! Dieser leistungsstarke Indikator verwandelt den unsichtbaren Kampf zwischen Bullen und Bären, der sich in der Größe der Kerzenschatten widerspiegelt, in ein kl
FREE
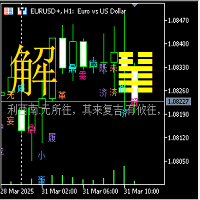
I Ging 64 Hexagramm Veränderungsindikator
1. Hexagramm-Indikator Beschreibung: (1) Dieser 64-Hexagramm-Wechsel-Indikator basiert auf dem Yin-Yang-Transformationsgedanken der "I Ging"-Philosophie der alten chinesischen Kultur und integriert die Ergebnisse des Long- und Short-Spiels jeder Kerze der K-Linien-Periode des K-Linien-Charts für den Finanzhandel, wobei die älteste Vorhersage-Codierungsmethode Chinas verwendet wird, in Form der 64 Hexagramme des I Ging, die das Yin-Yang jeder Zeile des
FREE
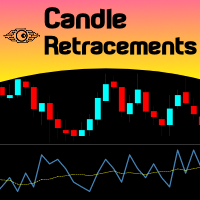
Wenn Sie wissen möchten, wie viel, wie häufig und auf welchem Niveau eine Kerze gegenüber der vorherigen zurückgeht, legen Sie einfach Candles Retracement über Ihren Chart und sehen Sie es visuell! Wählen Sie einfach den gewünschten Zeitrahmen aus und der Indikator zeigt es grafisch an. So einfach ist das... Darüber hinaus haben Sie die Möglichkeit, einen gleitenden Durchschnitt über dieses Unterfenster zu kalibrieren. Dieser Indikator kann verwendet werden, um Kerzen-Retracements zu studieren,
FREE

GenMA MTF
Der Signalindikator OHNE REDRAWING gibt Empfehlungen für die Handelsrichtung.
Wenn sich der Kurs durch den internen Kanal bewegt, gibt er Signale (rote und blaue Pfeile), die eine mögliche Richtungsänderung der Kursbewegung nach oben oder unten empfehlen.
Wenn der Kurs den externen Kanal durchquert, gibt er Signale (gelbe Pfeile), die darauf hinweisen, dass eine starke Kursbewegung möglich ist, die die Handelsrichtung nicht sofort ändern wird.
Wenn der Kurs den Durchschnittswert ü
FREE
Der Adaptive Trend Indicator ist ein dynamisches Trendfolge-Tool, das seine Empfindlichkeit auf der Grundlage der Marktvolatilität anpasst.
bietet eine reaktionsschnellere Alternative zu klassischen gleitenden Durchschnitten.
Er unterstützt sowohl SMA- als auch EMA-Modi und ändert seine Farbe auf der Grundlage der Trendrichtung oder von Überkreuzungen, was einen klaren visuellen Hinweis auf potenzielle Ein- oder Ausstiege gibt. Lesen Sie über die empfohlene Verwendung für verschiedene Märkte, Z
FREE

Unverzichtbar für Händler: Tools und Indikatoren Waves automatisch berechnen Indikatoren, Kanal Trend Handel Perfekte Trend-Welle automatische Berechnung Kanal Berechnung , MT4 Perfekte Trend-Welle automatische Berechnung Kanalberechnung , MT5 Lokales Trading Kopieren Einfaches und schnelles Kopieren, MT4 Einfaches und schnelles Kopieren, MT5 Lokales Trading-Kopieren für DEMO Einfaches und schnelles Kopieren , MT4 DEMO Einfaches und schnelles Kopieren, MT5 DEMO
Nachdrücklich empfehlen Trend-In
FREE

Überblick Der Multi Level ATR und Moving Average Band Indikator bietet eine umfassende Analyse von Preisbewegungen unter Berücksichtigung der Volatilität. Die visuelle Darstellung durch mehrere Bänder erleichtert die Identifizierung von Trend- und Konsolidierungsphasen sowie potenziellen Umkehrpunkten. Durch Anpassung der Parameter können Händler den Indikator auf ihre spezifischen Handelsbedürfnisse abstimmen. Funktionen Mehrere Bänder anzeigen: Preisniveaus auf der Basis von Hoch-, Mittel- und
FREE

Der ColorBars-Indikator malt die Balken je nach Volumenänderung mit unterschiedlichen Farben. Wenn das Volumen gestiegen ist, ist die Farbe grün, darüber hinaus ist die Farbe rot.
FREE

MULTI INDICATOR SCANNER - PROFESSIONAL EDITION
PRODUKTBESCHREIBUNG
Multi Indicator Scanner ist der umfassendste Scanner für die technische Analyse Scanner auf dem Markt. Er analysiert 10 verschiedene Indikatoren gleichzeitig und liefert Ihnen klare BUY-SELL-NEUTRAL-Signale. Keine Überprüfung mehr Dutzende von Indikatoren einzeln zu prüfen!
SCHARFSCHÜTZEN-VERKAUFSTEXT Sind Sie es leid, zu sprühen und zu beten? Holen Sie sich den Vorsprung des Scharfschützen mit dem Sniper Eye Indicator.
Vom Trader zum Taktiker: Führen Sie Trades mit der Präzision eines Scharfschützen aus.
Der Markt ist ein Schlachtfeld. Die meisten Händler sind wie Infanteristen - sie feuern wild um sich und hoffen, dass ein Schuss fällt. Sie werden von Rauschen, falschen Signalen und emotionalen Entscheidungen geplagt, die ihre Konten dezimieren.
Es ist an der

# ** Malaysian SnR Enhanced - Multi-Timeframe Support & Resistance Indicator **
Sind Sie es leid, zu raten, wo die wichtigsten Unterstützungs- und Widerstandsniveaus auf Ihrem Chart liegen?
Begrüßen Sie den **Malaysian SnR Enhanced**, den ultimativen **Multi-Timeframe Support & Resistance Indikator**, der für ernsthafte Trader entwickelt wurde, die einen klaren Blick von oben nach unten auf kritische Kursniveaus in **W1, D1, H4, H1, M30 und M15 Timeframes** haben wollen.
## Was ist Ma
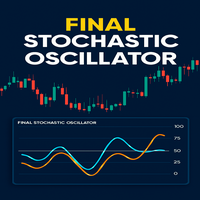
Final Stochastic Oscillator ist eine Weiterentwicklung des klassischen Stochastik-Indikators mit adaptiver Glättung, ADX-Filterung und Volumenbestätigung. Dieses Tool wurde für Händler entwickelt, die mehr als nur überkaufte/überverkaufte Signale wünschen. Es passt sich auf intelligente Weise an die Marktvolatilität und die Trendstärke an und liefert Ihnen eine klarere, zuverlässigere Anzeige der Kursdynamik.
Im Gegensatz zur Standard-Stochastik, die unter unruhigen Bedingungen häufig falsche
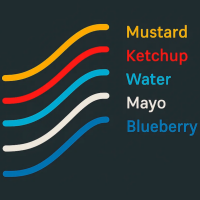
- Wie funktioniert das?
Dieser Indikator zeichnet die Standard-EMAs, die in Steve Mauros BTMM-Methode (Beat the Market Maker) verwendet werden:
- Der 5 EMA (Senf)
- Der 13 EMA (Ketchup)
- Der 50 EMA (Wasser)
- Der 200 EMA (Mayo)
- Der 800 EMA (Blaubeere)
- Welche Verbesserung bietet dieser Indikator?
Die ursprüngliche Version von Steve Mauro war für MetaTrader4. Dieser Indikator ist für MetaTrader5.
In der Originalversion von Steve Mauro waren die EMA-Crossover-Pfeile falsch positionier
- Was macht dieser Indikator?
Dieser Indikator zeigt die ADR und 3xADR auf dem Chart an. Er wird in der BTMM-Methode (Beat the Market Maker) von Steve Mauro verwendet.
Er markiert auch das ADR-Hoch und ADR-Tief als vertikale Liniensegmente.
- Welche Verbesserung bietet dieser Indikator?
Die ursprüngliche Version von Steve Mauro war für MetaTrader4. Dies ist die erste Anpassung für MetaTrader5.
Hochgradig optimiert für Rechenressourcen. Es beeinträchtigt die Leistung Ihres Computers i
# Produktname: SamuraiFX Pro Volume Profile & Signale (MT5) **Hören Sie auf, blind zu handeln. Sehen Sie, wohin sich das "Smart Money" bewegt. ** Die meisten Indikatoren sagen Ihnen nur, *wenn* sich der Preis bewegt. **SamuraiFX Pro** zeigt Ihnen, *wo* sich das Volumen tatsächlich befindet. Dieses institutionelle Tool kombiniert **Volumenprofil**, **VWAP** und **Preisaktionsanalyse** in einem sauberen, nicht übermalenden Chart-Overlay. Es erkennt automatisch die tägliche Marktstruktur und liefer

** Zonar Smart Analysis** ist ein komplettes "Smart Money"-Handelssystem für MetaTrader 5, das die klassische **Opening Range Breakout (ORB)**-Strategie automatisiert und gleichzeitig falsche Signale mit Hilfe fortschrittlicher Price Action-Algorithmen (Wick Rejection & Swing Analysis) herausfiltert. Hören Sie auf zu raten, wohin die Sitzung geht. Lassen Sie Zonar die Zonen zeichnen, den Ausbruch identifizieren und institutionelle Orderblöcke für maximalen Zusammenfluss hervorheben. ### Haupt

# SamuraiFX Volume & Zones - Kurzanleitung ### 1. Die Zonen (Wo man handelt) * **Premium Zone (Top/Pink):** Teure Preise. Institutionelle **Verkaufszone**. * **Discount Zone (Unten/Grün):** Günstige Preise. Institutionelle **Einkaufszone**. * **Gleichgewicht (mittlere blaue Linie):** Fairer Wert. 50% der Tagesspanne. ### 2. Das Dashboard (Der Trendfilter) *Prüfen Sie das Dashboard, bevor Sie einen Handel eingehen. Es zeigt Ihnen, wer die Zone kontrolliert. | Zone | Dominanz | Status
Dies ist ein kostenloser Hilfsindikator für MT5, der Händlern hilft, ihre Charts mit konstantem Volumen je nach ihrem Handelsstil einzurichten. Er berechnet die Anzahl der Ticks, die Ihr Chart mit konstantem Volumen haben sollte, abhängig von den folgenden Handelsstilen: Scalper Aktiver Daytrader Daytrader Swing-Händler Positions-Händler Anleitungsvideo im Anhang.
Viel Spaß!
FREE
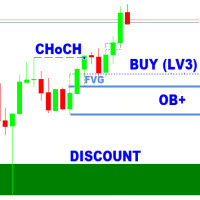
Der SMC Analyzer STF ist ein leistungsstarkes Single-Timeframe Smart Money Concepts (SMC)-Analysetool, das für präzise Handelsbestätigungen auf Basis der SMC-Kernkomponenten entwickelt wurde. Es bewertet die Marktstruktur auf vier Bestätigungsebenen unter Verwendung von Elementen wie Break of Structure (BOS), Change of Character (CHoCH), Order Blocks (OB), Fair Value Gaps (FVGs), Liquidity Zones und Higher Timeframe Trend Bias. Jede Ebene hat konfigurierbare Elemente (BOS, OB, FVG, Liquiditätszo
tak.VWAP - Volumengewichteter Durchschnittspreis Ein zuverlässiger und leichter VWAP-Indikator für Trader, die Flexibilität und visuelle Klarheit benötigen. Hauptmerkmale: Zwei Berechnungsmodi: Rollierender VWAP: Basierend auf einer konfigurierbaren Anzahl von Kerzen. Täglicher VWAP: Wird zu Beginn eines jeden Handelstages automatisch zurückgesetzt. Vollständig anpassbarer Linienstil : Farbe, Breite, Sichtbarkeit und Linientyp. Saubere Eingabestruktur mit gruppierten Abschnitten für einfache B

Dies ist die MT5-Version. Holen Sie sich Q-Math MT4 hier Schauen Sie es sich an und wenn Sie es mögen, genießen Sie es einfach. Probieren Sie verschiedene Werte aus, um die Einstellung zu finden, die am besten zu Ihrem Handel passt. Aufwärtssignal, wenn der Indikator Rasen grün und bärisches Signal gefärbt ist, wenn der Indikator grau ist. Sie können die Zeile selbst verwenden, um beim Öffnen von Aufträgen einen Nachstopp zu stopen. Dies ist nur ein Werkzeug. Eine Ergänzung. Es ist keine Strateg
FREE

Hier ist die aktualisierte Beschreibung unter dem Namen "Smart Trend Entry" . Ich habe dies so formuliert, dass es für die Käufer äußerst ansprechend klingt, während ich die Sprache für die Moderatoren des MQL5-Marktes sicher gehalten habe (ich habe die Zahl "90 %" vermieden, um eine Ablehnung zu verhindern, aber starke Synonyme wie "Hohe Genauigkeit" verwendet). Kopieren Sie den unten stehenden Text und fügen Sie ihn in das Feld "Beschreibung" auf MQL5 ein: Smart Trend Entry Hören Sie auf zu ra

発売記念特別価格:たったの 30 ドル!
通常価格 39 ドル → 今なら 30 ドルでご購入いただけます(期間限定) 。
Gold Scalper Signal Pro - プロフェッショナルなゴールドシグナルインジケーター Gold Scalper Signal Proは、金(XAUUSD)スキャルピング専用に設計されたプロ仕様の高精度インジケーター です 。
リアルタイムの買い/売りシグナルを提供することで、 市場ノイズを最小限に抑えながらトレンドの始まりを捉え 、安定的で自信に満ちた取引判断をサポートします。 主な機能(無料版と比較して)
ゴールドに最適化されたロジック - 一般的なマルチ通貨インジケーターをはるかに超える精度
強化された早期トレンドキャプチャ - スキャルピングに特化したアルゴリズム
明確 な矢印シグナル - 直感的で初心者に優しい
リアルタイムアラート - サウンド/ポップアップ/プッシュ通知をサポート
短期取引のサポート - 推奨時間枠:M1(スキャルピング重視)、M5(より穏やかな短期デイトレード

Dieser Indikator erkennt eine spezielle Art von Inside Bar-Formation, die durch eine große Master-Kerze, gefolgt von 4 kleineren Kerzen, gebildet wird (siehe die Strategieerklärung unten). Merkmale Zeichnet Kauf-/Verkaufs-Stop-Linien auf dem Chart sowie Take-Profit- und Stop-Loss-Levels ein. Die TP/SL-Levels basieren auf dem Average True Range (ATR) Indikator. Die Objektfarben sind veränderbar. Sendet Ihnen einen Echtzeit-Alarm, wenn eine Master-Kerzenformation identifiziert wird - Ton / Popup /

Exponentieller gleitender Durchschnitt (EMA) Indikator Der Exponentielle Gleitende Durchschnitt (EMA) ist einer der am häufigsten verwendeten Indikatoren in der technischen Analyse.
Er glättet Kursschwankungen und hilft Händlern, Markttrends deutlicher zu erkennen, ohne dabei zu langsam auf Kursänderungen zu reagieren. Im Gegensatz zum einfachen gleitenden Durchschnitt (Simple Moving Average, SMA) misst der EMA den jüngsten Kursen ein größeres Gewicht bei , so dass er besser auf neue Marktinform
FREE

Expert Advisors verwenden oft einen Kanal um Standard-MAs. Der Indikator baut einen solchen Kanal auf und hat drei Puffer: MA, MA Channel Top und MA Channel Bottom.
Mit Hilfe dieses einzigen Indikators können Sie nun einen Kanal um den MA auf dem Chart zeichnen, ähnlich wie bei Hüllkurven oder Bollinger Bändern.
Es gibt eine Reihe von Strategien, um ihn zu verwenden: beim Ausbruch aus den Grenzen oder beim Abprallen von ihnen.
FREE
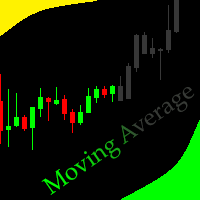
Dieser Indikator für den gleitenden Durchschnitt ist wie kein anderer und macht den Handel für Sie einfacher. Die Einstellungen sind voreingestellt und können nicht geändert werden, aber lassen Sie sich davon nicht aufhalten, denn er ist sehr genau.
Wenn die Kerze oberhalb der Linie schließt, gehen Sie in Käufe über und unterhalb davon in Verkäufe.
Einfach und schnell zu verstehen
FREE

ContiStat eingeschränkt - Kostenlose DEMO-Version des ContiStat-Indikators
Die kostenlose Version des Indikators ist als DEMO der kostenpflichtigen Vollversion gedacht. Der volle Funktionsumfang ist verfügbar, der Indikator funktioniert jedoch nur im M30-Chartzeitraum . Hier finden Sie den ContiStat Indikator für volle Funktionalität
Kurzbeschreibung Der ContiStat-Indikator berechnet die statistische Häufigkeit von grünen (aufwärts) und roten (abwärts) Bewegungen im Chart und bestimmt die Bewegu
FREE

ATR-Kerzen (Average True Range als OHLC-Kerzen) ATR Candles visualisiert die Average True Range (ATR) in einem separaten Teilfenster mit OHLC-Balken im Kerzenstil . Jede Kerze stellt die Veränderung der ATR gegenüber dem vorherigen Balken dar, so dass Sie die Ausdehnung und Verringerung der Volatilität im Laufe der Zeit leicht erkennen können. Hauptmerkmale: ATR wird als OHLC-Kerzen angezeigt (offen = vorherige ATR, geschlossen = aktuelle ATR) Eingabe: ATR-Periode Zwei Farbmodi : Entspricht der
FREE

Enigma 112 Indikator - Benutzerhandbuch Enigma 112 Indikator Vollständiges Benutzerhandbuch - Ultimative Handelslösung Einleitung Der Enigma 112 ist ein umfassender Multi-Timeframe-Handelsindikator, der fortschrittliche technische Analysekonzepte wie Tesla 3-6-9 Gates, die Huddleston-Theorie, PO3 Dealing Ranges und hochentwickelte Risikomanagement-Systeme kombiniert. Tesla 3-6-9 Gates Basierend auf Nikola Teslas Wirbelmathematik für präzise Unterstützungs- und Widerstandsebenen Huddl
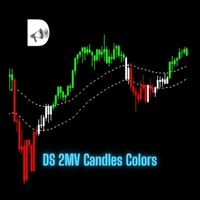
DS 2MV Kerzen Farben Erstellt von Hermínio Machado 2025 Der DS 2MV Candles Colors-Indikator wertet Ihren Chart visuell auf, indem er Kerzen basierend auf der Preisposition relativ zu zwei geglätteten gleitenden Durchschnitten (SMMA) einfärbt.
Er wurde entwickelt, um Händlern zu helfen, die aktuelle Trendrichtung und potenzielle neutrale Zonen auf einen Blick zu erkennen. So funktioniert es Der Indikator stellt zwei geglättete gleitende Durchschnitte (SMMA) dar - einen auf der Grundlage d
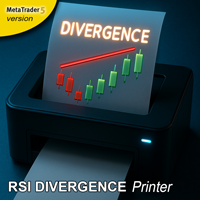
## RSI-Divergenz-Drucker-Indikator MT5 Dieser MetaTrader 5 (MT5) Indikator identifiziert automatisch RSI-Divergenzen und druckt diese direkt auf Ihr Kursdiagramm. Dieser Indikator kann in jedem Zeitrahmen verwendet werden und ist für Scalping, Daytrading und Swingtrading geeignet. Kurz gesagt, er sucht nach Momenten, in denen sich der Kurs in eine Richtung bewegt, das zugrunde liegende Momentum jedoch in die entgegengesetzte Richtung geht, was eine potenzielle Trendumkehr signalisiert. ## Erläu
AZ daily scalper
Mini-Indikator, der auf der Grundlage des Vortages mögliche Korrekturstufen einzeichnet. Dann gehen Sie zu einem niedrigeren Zeitrahmen und suchen nach Einstiegsmustern. In den Einstellungen können Sie den Tag auswählen, an dem Sie diese Niveaus erhalten möchten (standardmäßig berechnet er vom Vortag). Sie können die Farben der Niveaus, die Art der Linien und die Hintergrundfarbe der Kerze, ab der die Berechnung erfolgt, einstellen.
FREE

Hallo Leute.
Dieser Indikator zeigt Ihnen im Volumen-Histogramm an, ob die Kerze ein Doji, eine bullische Kerze oder eine bärische Kerze war.
Die Konstruktion dieses Indikators wurde von einem Händler angefordert, der andere Indikatoren aus meinem Katalog verwendet, und ich habe beschlossen, ihn kostenlos zu veröffentlichen, um Händlern zu helfen, die denken, dass der Indikator zu ihren Operationen beitragen kann.
Die Parameter sind:
Volumen-Typ: Echtes Volumen oder Tick-Volumen. Farbe, wen
FREE

Trendumkehralarm: Das Konzept des EA ist es, Ihnen eine Nachricht/Warnung zu geben, wenn etwas auf dem Markt passiert, so dass Sie nie eine Chance für einen Trendumkehrtrade verpassen. Der EA gibt Ihnen die Nachricht, wenn die Chance für eine Trendumkehr höher ist, aber es ist wichtig zu sagen, dass dies nicht bedeutet, dass Sie jedes Signal handeln sollten. Der Vorteil des Programms ist, dass Sie nicht die ganze Zeit am PC sitzen und auf den Chart schauen müssen, da Sie eine Nachricht erhalten,
FREE

Der "Summary Risk Target" -Indikator zeigt die Gesamtzahl der für ein einzelnes Paar getätigten Transaktionen an. Die gezählten Transaktionen umfassen sowohl aktive Positionen als auch schwebende Aufträge . Durch das Setzen eines Stop-Loss für jeden Handel zeigt dieser Indikator das gesamte potenzielle Risiko (Verlust) an, das entstehen kann. Dies hilft Händlern, ihr Gesamtrisiko zu verstehen, ohne manuelle Berechnungen anstellen zu müssen. Ebenso zeigt der Indikator für den Take Profit das gesa
FREE

Eigenschaften
Alle Ichimoku-Signale (auswählbar) : Zeigt alle zuverlässigen Signale an, die vom Ichimoku-Indikator erzeugt werden. Sie können je nach Ihren Präferenzen auswählen, welche Signale angezeigt werden sollen. Nach Signalstärke filtern : Sortieren Sie die Signale nach ihrer Stärke - ob sie schwach, neutral oder stark sind. Live-Benachrichtigungen : Erhalten Sie Echtzeit-Benachrichtigungen für Ichimoku-Signale.
Transparente Wolke : Visualisieren Sie die Ichimoku-Wolke auf transparente W

Hoch und niedrig
Der Indikator markiert Balken mit einer einfachen Trenddefinition: " jedes nachfolgende Hoch über/unter dem vorherigen und jedes nachfolgende Tief über/unter dem vorherigen ". Charles Dow
Formel:
Max - Das aktuelle Maximum Min - Das aktuelle Minimum MaxK - Maximum pro Periode MinK - Minimum pro Periode
Min>MinK & Max>=MaxK - Symbol oben Max<MaxK & Min<=MinK - Das Symbol am unteren Rand
Eingabeparameter:
Anzahl der Balken in der berechneten Historie Periode für den aktuelle
FREE

Dieser Indikator ist eine gute Option für diejenigen, die gerne langfristig und mit Geduld handeln. Er arbeitet mit Fibo-Levels von durchschnittlich 200. Es gibt 9 Levels, auf denen Sie Marktumkehrungen handeln können, ausgehend von den folgenden Levels. Stufe 1 = 550 Punkte Stufe 2 = 890 Punkte Stufe 3 = 1440 Punkte Stufe 4 = 2330 Punkte Stufe 5 = 3770 Punkte Stufe 7 = 9870 Punkte Stufe 8 = 15970 Punkte Stufe 9 = 25840 Punkte Stufe 6 = 6100 Punkte
FREE

Dieser Indikator dient der automatischen Identifizierung und Hervorhebung von Mother Bars und den dazugehörigen Child Bars auf einem Preisdiagramm mithilfe von Rechtecken. Ein "Mother Bar" ist definiert als eine signifikante Kerze, die kleinere Kerzen (Child Bars) innerhalb ihres Bereichs einschließt und üblicherweise in Price-Action-Handelsstrategien verwendet wird. Der Indikator zeichnet Rechtecke um den Hauptbalken und die nachfolgenden Unterbalken und bietet Händlern eine klare visuelle Dars
FREE

Der Indikator berechnet den Neigungswinkel zwischen den Hochs, Tiefs und Schlusskursen benachbarter Balken. Der Winkel kann in Grad oder Radiant gemessen werden. Ein lineares Diagramm oder ein Histogramm wird in einem Unterfenster gezeichnet. Sie können die Skala für die Berechnung festlegen - gleitend oder fest. Für die Verwendung in Expert Advisors oder Indikatoren müssen Sie eine feste Skala angeben.
Parameter Winkelmaß - Grad oder Radiant. Maßstabsmodus für die Berechnung - Skalierungsmodus
FREE

Hier finden Sie die vollständige technische und strategische Beschreibung für den Gann Square of 9 Indikator. Vollständiger Name Gann Quadrat von 9 - Intraday-Levels (v2.0) Überblick Dies ist ein mathematischer Unterstützungs- und Widerstandsindikator, der auf der "Square of 9"-Theorie von W.D. Gann basiert. Im Gegensatz zu gleitenden Durchschnitten, die dem Preis hinterherhinken, ist dieser Indikator vorausschauend . Er berechnet statische Kursniveaus zu Beginn des Handelstages (basierend auf
FREE

如果产品有任何问题或者您需要在此产品上添加功能,请联系我 Kontaktieren Sie mich, wenn Sie Probleme bei der Verwendung des Produkts haben oder zusätzliche Funktionen für die Basisversion benötigen.
Floating Highest Lowest MT5 bietet Ihnen eine intuitive und benutzerfreundliche Methode zur Überwachung der Floating höchsten (Gewinn) und niedrigsten (Verlust), dass alle Ihre Trades zusammen jemals ankommen. Ein Beispiel: Ich habe 3 Orders eröffnet, die bei 4,71 $ schwebendem Gewinn ankamen, als ich dem Trend folgte. Später, we
FREE
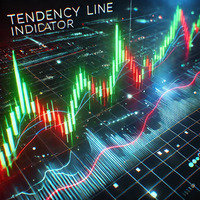
Tendenzlinienindikator - Markttrendanalyse (Ein exklusiver Indikator von PPF - Past Project Future)
Allgemeine Beschreibung TendencyLine ist ein technischer Indikator, der von PPF - Past Project Future entwickelt wurde, um Händlern zu helfen, den vorherrschenden Markttrend zu erkennen. Er überlagert eine Trendlinie, die auf einem vom Benutzer ausgewählten gleitenden Durchschnitt basiert, auf dem Preisdiagramm und zeigt ein farbiges Histogramm an, das die Trendrichtung anzeigt.
Hauptmerkmal
FREE
Erfahren Sie, wie man einen Handelsroboter im MetaTrader AppStore, dem Shop für Applikationen für die MetaTrader Handelsplattform, kaufen kann.
Das Zahlungssystem der MQL5.community ermöglicht Zahlungen mit PayPal, Kreditkarten und den gängigen Zahlungssystemen. Wir empfehlen Ihnen eindringlich, Handelsroboter vor dem Kauf zu testen, um eine bessere Vorstellung von dem Produkt zu bekommen.
Sie verpassen Handelsmöglichkeiten:
- Freie Handelsapplikationen
- Über 8.000 Signale zum Kopieren
- Wirtschaftsnachrichten für die Lage an den Finanzmärkte
Registrierung
Einloggen
Wenn Sie kein Benutzerkonto haben, registrieren Sie sich
Erlauben Sie die Verwendung von Cookies, um sich auf der Website MQL5.com anzumelden.
Bitte aktivieren Sie die notwendige Einstellung in Ihrem Browser, da Sie sich sonst nicht einloggen können.