Gekko Variation Marks
- Indikatoren
- Version: 1.11
- Aktualisiert: 17 Februar 2023

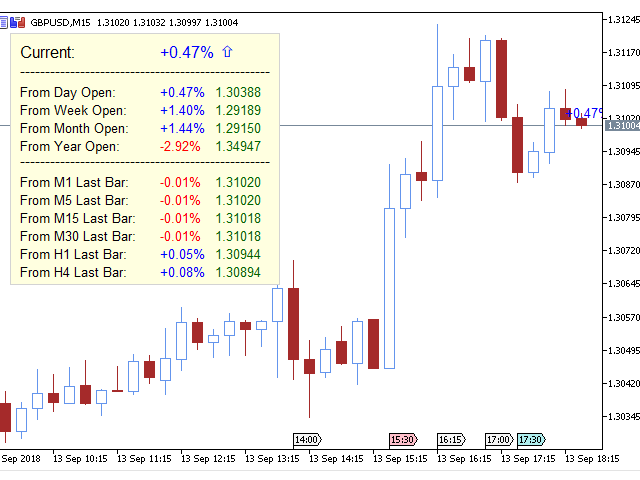
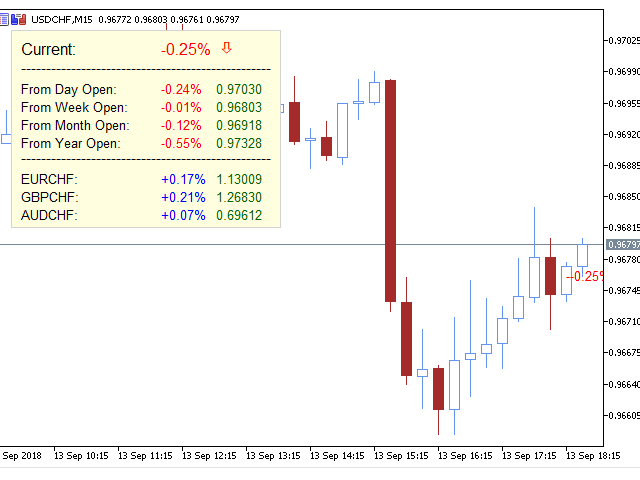
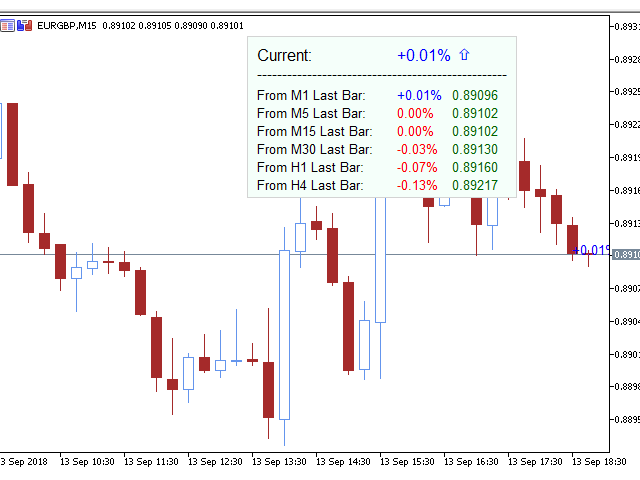
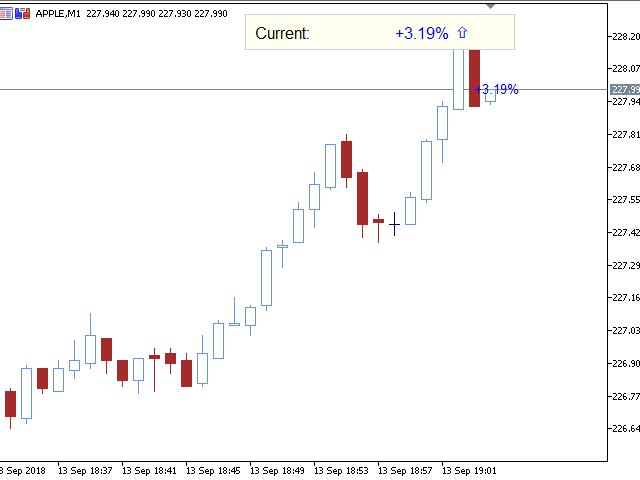
Dies ist der Gekko-Indikator für Notierungen und Schwankungen. Er fasst die Notierungen und Schwankungen des aktuellen Symbols in verschiedenen Zeitrahmen sowie anderer korrelierter Symbole zusammen. Behalten Sie all diese Informationen auf Ihrem Chart im Auge, während Sie verhandeln, um Ihre Entscheidungsfindung zu unterstützen.
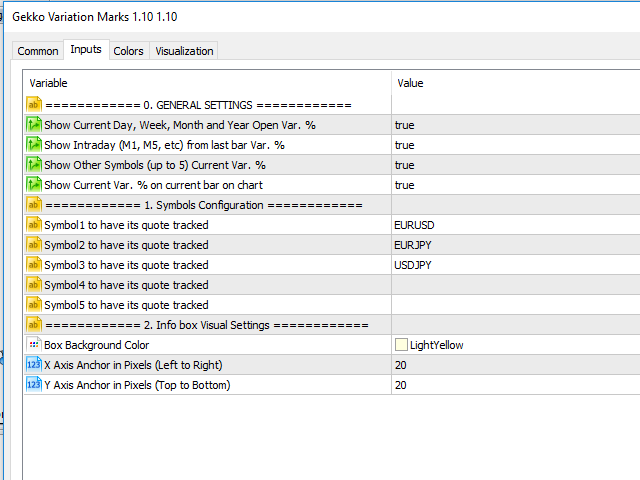
Eingabe-Parameter
- Allgemeine Einstellungen: Konfigurieren Sie, welche Notierungen und Variationen Sie für den aktuellen Tag, die Woche, den Monat oder das Jahr sowie für M1-, M5-, M15-, M30-, H1- und H4-Charts verfolgen möchten;
- Symbolkonfiguration: Fügen Sie bis zu 5 verschiedene Symbole hinzu, um deren Notierungen und Schwankungen zu verfolgen, während Sie auf Ihrem Hauptsymbolchart handeln;
- Visuelle Einstellungen: Passen Sie die Hintergrundfarbe und die Position der Infobox auf Ihrem Chartbildschirm an.
Gute Trades!
Spenden Sie einen Teil Ihres Gewinns für gute Zwecke und humanitäre Einrichtungen Ihrer Wahl. "Geld gibt es nur, wenn es einen Grund gibt, es zu verdienen".


adv : very useful thought and application, give me new ideas cons : I think "OnDeinit" function is not working