Technische Indikatoren für den MetaTrader 5 - 56

Dieser Indikator funktioniert für alle Währungspaare und Zeitrahmen (TF). Ein Eingabeparameter: nPeriod - Anzahl der Balken für die Histogrammberechnung. Ich empfehle, den nPeriod-Wert für jeden TF zu optimieren. Wenn grüne Histogrammpole die Nulllinie von unten kreuzen, kann eine Long-Position eröffnet werden. Wenn rote Histogrammpole die Nulllinie von oben kreuzen, dann kann eine Long-Position eröffnet werden.

Dieser Indikator ist nur für die Zeitrahmen H1 und H4 (TF) konzipiert. Keine Eingabeparameter, da er auf diese beiden TF abgestimmt ist. Er zeichnet zwei stufenförmige Linien: eine silberne Hauptlinie und eine rote Signallinie. Diese beiden Linien werden so berechnet, dass sie die Filterung des Marktrauschens verbessern. Kaufen Sie , wenn die Hauptlinie über die Signallinie steigt. Verkaufen Sie , wenn die Hauptlinie unter die Signallinie fällt.

Pivot Points MT5 ist ein universeller farbiger Multiwährungs-/Multisymbol-Indikator des Pivot Points Level Systems. Sie können eine der drei Versionen wählen: Standard Alt, Standard Neu und Fibo . Er zeigt die Pivot-Levels für Finanzinstrumente in einem separaten Fenster an. Das System berechnet den Pivot-Punkt automatisch auf der Grundlage der Marktdaten des Vortages (PERIOD_D1 ) und des Systems der Unterstützungs- und Widerstandsniveaus, jeweils drei an der Zahl. Der Benutzer kann die Farben f

Dieser Indikator ermöglicht die Analyse der Tick-Volumen-Deltas. Er berechnet die Tick-Volumina für Käufe und Verkäufe separat sowie deren Delta für jeden Balken und zeigt die Volumina nach Preisclustern (Zellen) innerhalb eines bestimmten Balkens (normalerweise der letzte) an. Dies ist ein begrenzter Ersatz für die Markt-Delta-Analyse, die auf realen Volumina basiert, die auf dem Forex nicht verfügbar sind. Der Indikator zeigt die folgenden Daten in seinem Unterfenster an: hellblaues Histogramm

Einführung in Smart Renko Die Hauptmerkmale von Renko Charting betreffen die Preisbewegung. Um Ihnen eine Vorstellung von seinem Funktionsprinzip zu geben, wird das Renko-Chart so konstruiert, dass ein Ziegelstein über oder unter dem Chart platziert wird, wenn der Kurs eine Bewegung über einen vordefinierten Bereich, die sogenannte Ziegelsteinhöhe, hinaus macht. Daher kann man natürlich eine klare Preisbewegung mit weniger Rauschen als bei anderen Charttypen sehen. Das Renko-Charting kann eine v

Der Indikator MilkyWay rechnet und zeichnet ein blaues oder rotes Band als Trend und als Filter. Wenn sich der Preis innerhalb des Bandes bewegt, sollten Sie nicht in den Markt einsteigen. Wenn Sie einen blauen Trend sehen und der aktuelle Kurs oberhalb des blauen Bandes liegt, ist dies ein guter Zeitpunkt, um Long zu gehen. Wenn Sie einen roten Trend sehen und der aktuelle Preis unterhalb des roten Bandes liegt, ist dies ein guter Zeitpunkt, um zu verkaufen. Nur 1 Eingabeparameter: nBars = 500;
Dieser Indikator und seine Verwendung wurde vom brasilianischen Händler und Analysten Odir Andrade Aguiar (Spitzname Didi) von Doji Star entwickelt.
Verwendung Er basiert auf dem Verhältnis der gleitenden Durchschnitte mit den Perioden 3 (FAST) und 20 (SLOW) durch die 8-Perioden gleitend, die Standardeinstellungen sind. Wenn SLOW und FAST sehr nahe beieinander liegen und sich der 1,0-Linie (weiße Mittellinie) nähern, können sie ein Kauf- oder Verkaufssignal für die nächste Kerze anzeigen. Ein s

Dieser Indikator basiert auf dem klassischen Indikator RSI (Relative Strength Index) und wird für diejenigen hilfreich sein, die es lieben und wissen, wie man nicht eine visuelle, sondern eine digitale Darstellung des Indikators verwendet. Alle MT5 TimeFrames RSI-Indikator zeigt Werte aus jedem Zeitrahmen: M1, M2, M3, M4, M5, M6, M10, M12, M15, M20, M30, H1, H2, H3, H4, H6, H8, H12, D1, W1, UND MN1. Sie können die wichtigsten Eingabeparameter für jeden RSI für jeden TF ändern.
Beispiel für M1 s

Dieser Indikator basiert auf dem klassischen Indikator CCI (Commodity Channel Index) und wird für diejenigen hilfreich sein, die nicht nur eine visuelle, sondern auch eine digitale Darstellung des Indikators lieben und zu nutzen wissen. Alle MT5 TimeFrames CCI Indikator zeigt Werte aus jedem Zeitrahmen: M1, M2, M3, M4, M5, M6, M10, M12, M15, M20, M30, H1, H2, H3, H4, H6, H8, H12, D1, W1, UND MN1. Sie können die wichtigsten Eingabeparameter für jeden CCI für jeden TF ändern.
Beispiel für M1 sTF1

Dieser Indikator basiert auf dem klassischen Stochastik-Indikator und wird für diejenigen hilfreich sein, die nicht nur eine visuelle, sondern auch eine digitale Darstellung des Indikators lieben und zu nutzen wissen. Alle MT5 TimeFrames Stochastik-Indikator zeigt Werte von jedem Zeitrahmen: M1, M2, M3, M4, M5, M6, M10, M12, M15, M20, M30, H1, H2, H3, H4, H6, H8, H12, D1, W1, UND MN1. Sie können die wichtigsten Eingabeparameter für jeden Indikator für jede TF ändern. Die erste Datenzeile stellt

Dieser Indikator basiert auf dem klassischen Indikator Parabolic SAR und wird für diejenigen hilfreich sein, die es lieben und wissen, wie man nicht eine visuelle, sondern eine digitale Darstellung des Indikators verwendet. Alle MT5 TimeFrames PSAR-Indikator zeigt Werte aus jedem Zeitrahmen: M1, M2, M3, M4, M5, M6, M10, M12, M15, M20, M30, H1, H2, H3, H4, H6, H8, H12, D1, W1, UND MN1. Sie können die wichtigsten Eingabeparameter für jeden CCI für jeden TF ändern.
Beispiel für M1 sTF1___ = "M1";

Dieser Indikator basiert auf dem klassischen Indikator ADX (Average Directional Index) und wird für diejenigen hilfreich sein, die es lieben und wissen, wie man nicht eine visuelle, sondern eine digitale Darstellung des Indikators verwendet. Alle MT5 TimeFrames ADX-Indikator zeigt Werte aus jedem Zeitrahmen: M1, M2, M3, M4, M5, M6, M10, M12, M15, M20, M30, H1, H2, H3, H4, H6, H8, H12, D1, W1, und MN1. Sie können die wichtigsten Eingabeparameter für jeden ADX für jeden TF ändern.
Beispiel für M1
Dieser Indikator basiert auf dem klassischen Indikator RSI (Relative Strength Index) und wird für diejenigen hilfreich sein, die es lieben und wissen, wie man nicht eine visuelle, sondern eine digitale Darstellung des Indikators verwendet. Alle MT5 TimeFrames RSI-Indikator zeigt Werte aus jedem Zeitrahmen: M1, M2, M3, M4, M5, M6, M10, M12, M15, M20, M30, H1, H2, H3, H4, H6, H8, H12, D1, W1, UND MN1. Sie können die Haupteingabeparameter für jeden RSI für jeden TF ändern und Sie haben die Wahl, we
Viele Indikatoren basieren auf dem klassischen Indikator Moving Average . Der Indikator All_MT5_MA_FX zeigt die Korrelation zwischen 2 MA (schnell und langsam) aus jedem MT5 TimeFrames . Sie können die wichtigsten Eingabeparameter für jeden MA für jeden TF ändern. Beispiel für M1 TF: TF_M1 = wahr Zeitraum1_schnell = 5 Methode1_schnell = MODE_EMA Preis1_schnell = PRICE_CLOSE Zeitraum1_langsam = 21 Methode1_langsam = MODE_SMA Preis1_langsam = PRICE_TYPICAL
Scanner PriceAction ist ein praktischer Indikator zur Verfolgung von PriceAction-Mustern bei ausgewählten Symbolen auf Zeitrahmen von M15 bis Weekly. Sie werden nie einen profitablen Handel auslassen. Sie müssen sich nicht durch zahlreiche Charts wühlen, um ein passendes Muster zu finden. Scanner PriceAction zeigt Ihnen einen Chart und einen Zeitraum an, in dem sich das eine oder andere PriceAction-Set gebildet hat. Sie müssen nur noch zu einem bestimmten Symbol wechseln, die Situation einschätz
Dieser Indikator basiert auf dem klassischen Indikator Parabolic SAR und wird für diejenigen hilfreich sein, die es lieben und wissen, wie man nicht eine visuelle, sondern eine digitale Darstellung des Indikators verwendet. Alle MT5 TimeFrames PSAR-Indikator zeigt Werte aus jedem Zeitrahmen: M1, M2, M3, M4, M5, M6, M10, M12, M15, M20, M30, H1, H2, H3, H4, H6, H8, H12, D1, W1, UND MN1. Sie können die Haupteingabeparameter für jeden PSAR für jede TF ändern und Sie haben die Wahl, welche TFs Sie se
Dieser Indikator basiert auf dem klassischen Indikator Average Directional Index (ADX) und wird für diejenigen hilfreich sein, die es lieben und wissen, wie man nicht eine visuelle, sondern eine digitale Darstellung des Indikators verwendet. ADX MT5-Indikator zeigt Werte aus jedem Zeitrahmen: M1, M2, M3, M4, M5, M6, M10, M12, M15, M20, M30, H1, H2, H3, H4, H6, H8, H12, D1, W1, UND MN1. Sie können die Haupteingabeparameter für jeden ADX für jeden TF ändern und Sie haben die Wahl, welchen TF Sie s

Der Währungsindex-Indikator ermöglicht es Händlern, einen beliebigen Index der acht wichtigsten Währungen anzuzeigen. Er verwendet eine spezielle Berechnung, die bestimmte Währungspaare und deren Gewichte berücksichtigt.
Die Standardgewichte basieren auf den Ergebnissen der dreijährlichen Zentralbankumfrage der BIZ. Dank dieses Vorteils kann der Händler die wahre Stärke und Schwäche jeder Währung erkennen.
Hinweis: Wenn der Indikator im Strategy Tester (Demoversion) verwendet wird, beachten S
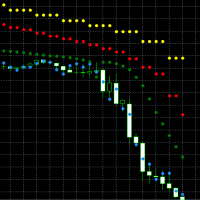
Dieser Indikator basiert auf dem klassischen Indikator Parabolic SAR. Sie können bis zu 4 verschiedene Timeframes beobachten , wobei alle MT5 TimeFrames unterstützt werden. Es ist möglich, niedrigere oder höhere Zeitrahmen als den aktuellen Chart-Zeitrahmen zu verwenden . Eingabe-Parameter: Für jeden der 4 Timeframes können Sie konfigurieren: Die spezifische Periode (ENUM_TIMEFRAMES ) Die Verwendung des PSAR-Wertes ("sichtbar und relevant für das Signal", "sichtbar und nicht relevant für das Sig

Der Indikator generiert Frühsignale auf der Grundlage von ADX-Messdaten in Kombination mit Elementen von Preismustern. Funktioniert auf allen Symbolen und Zeitrahmen. Der Indikator zeichnet seine Signale nicht neu. Sie sehen dasselbe in der Historie und in Echtzeit. Zur besseren visuellen Wahrnehmung werden die Signale als Pfeile angezeigt (um das Diagramm nicht zu überladen).
Merkmale Die besten Ergebnisse werden erzielt, wenn der Indikator auf zwei Zeitrahmen arbeitet. Zum Beispiel: M30 - der

Der Pairs Cross-Indikator ist ein einzigartiges Instrument für negativ korrelierte Handelsinstrumente, wie z.B. die Währungspaare EURUSD und USDCHF. Er basiert auf einem Konzept, das als Pairs Trading (oder Spread Trading) bezeichnet wird. Unser Indikator vergleicht die Stärke von zwei Währungspaaren, die umgekehrt korreliert sind, und zeigt Ihnen schnell an, wann es an der Zeit ist, das erste Paar zu kaufen und ein zweites Paar zu verkaufen und umgekehrt. Dies ist ein unkomplizierter Ansatz für

Der Pairs Spread Indikator wurde für die beliebte Strategie des Pairs Trading, Spread Trading oder der statistischen Arbitrage entwickelt. Dieser Indikator misst den Abstand (Spread) zwischen den Preisen von zwei direkt (positiv) korrelierten Instrumenten und zeigt das Ergebnis als Kurve mit Standardabweichungen an. So können Händler schnell erkennen, wann die Instrumente zu weit auseinander liegen und diese Information für Handelsmöglichkeiten nutzen.
So verwenden Sie den Pairs Spread Indikato

Dieser Indikator basiert auf dem klassischen Stochastik-Oszillator und wird für diejenigen hilfreich sein, die nicht nur eine visuelle, sondern auch eine digitale Darstellung des Indikators lieben und zu nutzen wissen. Stochastik MT5 Indikator zeigt Werte aus jedem Zeitrahmen: M1, M2, M3, M4, M5, M6, M10, M12, M15, M20, M30, H1, H2, H3, H4, H6, H8, H12, D1, W1, UND MN1. Sie können die Haupteingabeparameter für jede Stochastik für jeden TF ändern und Sie haben die Wahl, welche TFs Sie sehen möcht

Dies ist ein bekannter ZigZag-Indikator. Er unterscheidet sich jedoch durch die Tatsache, dass seine Darstellung auf den Werten der Mittellinie basiert, die vom Benutzer festgelegt wird. Er kann Andrews' Pitchfork und Standard- oder Bobokus-Fibo-Levels anzeigen. KEIN REPAINTING.
Parameter Zeitraum МА - Zeitraum der Mittellinie. Standardwert ist 34. Der Minimalwert ist 4, der Maximalwert wird nach Ihrem Ermessen festgelegt. Zur Preisberechnung verwendet - Art des Preises, der für die Berechnung

Der Indikator zeigt bullische, bärische und Doji-Kerzen an. Außerdem wird die Anzahl der Kerzen (bullish, bearish und doji) für die letzten N Tage berechnet. Sie können die Farben sowohl für den Kerzenkörper als auch für den Kerzenschatten auswählen und auch die Einfärbung nur des Kerzenkörpers aktivieren МetaТrader 4 Version: https: // www.mql5.com/en/market/product/11624 Parameter Farbe Bullen = Farbe der bullischen Kerzenkörper Farbe Schatten Bullen = Farbe der bullischen Kerzenschatten Farbe

Der "Five Candle Pattern"-Indikator ist eine neue Art, den Markt zu sehen, denn mit ihm können wir die Ausbildung oder das Muster der letzten 4 oder 5 Kerzen vergleichen und/oder suchen und sie in derselben Grafik identifizieren, um Ihr Verhalten zu einem früheren Zeitpunkt zu sehen. Der Indikator erstellt ein Muster aus diesen 4 oder 5 Kerzen und sucht rückwärts, identifiziert und markiert die gleiche Formation oder das gleiche Muster. Anhand dieser Informationen können Sie die derzeitige Strat

Wenn man sich die Informationen des On Balance Volume Indikators ansieht, stellt sich die Frage, ob es sich um eine starke oder schwache Bewegung handelt. Sollte sie mit den vorangegangenen Tagen verglichen werden? Diese Daten sollten normalisiert werden, um immer eine Referenz zu haben.
Dieser Indikator weist folgende Parameter auf: Normalisierungszeitraum (Max-Mins absolut) Glättungszeitraum (-1 off) Tick/Reales Volumen Maximale Anzahl der zu berechnenden Balken (-1 off) Normalisierung des ob
Dieser Indikator funktioniert nur 5 Ziffern Brokers. Es ist unmöglich, über die Studie des Forex-Marktes oder eines anderen Marktes zu sprechen, ohne die Marktstatistiken zu berücksichtigen. In diesem Fall, unser Indikator "Preis-Statistiken" haben wir einen neuen Weg, um unser Diagramm zu studieren, so dass Informationen über den Preis in einem Bereich von Pips, die Sie zum Beispiel studieren wollen, können wir wissen, wie oft der Preis schließt oder öffnet sich in Räume 10, 20, 30, 50, 100 Pip

Der Indikator ist ähnlich wie https://www.mql5.com/en/market/product/12330. Er berücksichtigt jedoch die Merkmale der MQL5-Plattform. Höchst- und Tiefststände werden ausschließlich auf der Grundlage externer Balken berechnet. Nachdem sich ein Swing gebildet hat, zeichnet der Indikator nicht neu , was Händlern, die an Durchbrüchen auf horizontaler Ebene arbeiten, Möglichkeiten bietet. Der Datenverkehr kann reduziert werden, indem die Anzahl der berechneten Balken in der Variable MinBars geändert
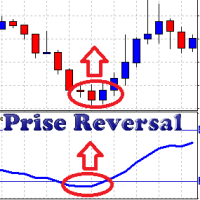
Der Oszillator verwendet Daten von Standardindikatoren und einige Muster der Preisbewegung. Anhand dieser Daten bildet er seine eigenen (genaueren) Signale für eine Änderung der Richtung der Preisbewegung. Prise Reversal hilft bei der Identifizierung von Umkehrpunkten während eines Flats und von Preisextremen während eines Trends. An diesen Punkten können Sie mit einer kurzen Gewinnmitnahme in den Gegentrend einsteigen. Außerdem zeigt er Zeitintervalle an, in denen es zu spät ist, ein trendfolge

Der Indikator basiert auf dem Zwei-Puffer-Schema und erfordert keine zusätzlichen Einstellungen. Er kann für jedes Finanzinstrument ohne Einschränkungen verwendet werden. Der Indikator ist ein bekannter ZigZag, der jedoch nicht neu gezeichnet wird . Der Indikator ermöglicht die einfache Erkennung signifikanter Niveaus auf dem Preisdiagramm und zeigt die Fähigkeit, die wahrscheinliche Richtung einer Preisbewegung zu bestimmen. Die Berechnungen basieren auf den Schlusskursen der Kerzen, wodurch di
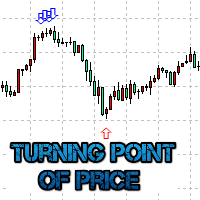
Der Preiswendepunkt-Indikator zeigt angenommene Preiswendepunkte auf dem Chart an. Er basiert auf den Daten des Prise Reversal Oszillators und des Standard-ADX. Wenn sich der Wert des Prise Reversal Oszillators in einem überkauften oder überverkauften Bereich befindet (die Größe des Bereichs wird vom Benutzer festgelegt) und der Wert der ADX-Hauptlinie den voreingestellten Wert überschreitet, zeichnet der Indikator für den Wendepunkt des Preises einen Pfeil, der auf die weitere angenommene Preis
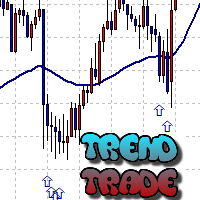
Der Trend-Trade-Indikator zeigt angenommene Wendepunkte des Preises auf dem Diagramm in Richtung des Trends nach der Korrektur an. Er basiert auf den Daten des Prise Reversal Oszillators mit der Periode 6 und Indikatoren, die die Stärke und Verfügbarkeit des Trends charakterisieren. Wenn sich der Wert des Prise Reversal Oszillators im überkauften oder überverkauften Bereich befindet (die Größe des Bereichs wird vom Benutzer festgelegt) und der aktuelle Trend bestätigt wird, zeichnet der Trend Tr

Dieser Oszillator wurde 2015 exklusiv von xCalper entwickelt und basiert auf Berechnungen gleitender Durchschnitte, um überverkaufte und überkaufte Niveaus anzuzeigen und vorherzusagen. Die schnelle Linie (standardmäßig weiß) oszilliert grundsätzlich zwischen den Werten -0,5 (überverkauft) und +0,5 (überkauft). Immer wenn diese Linie den Wert -0,5 nach oben kreuzt, bedeutet dies ein überkauftes Kursniveau. Wenn sie den Wert +0,5 nach unten kreuzt, bedeutet dies ein überkauftes Preisniveau. Wenn
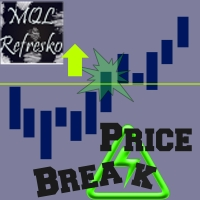
Der "Price Break"-Indikator ist ein mächtiges Werkzeug für jeden Händler. Wenn der Kurs die vom Indikator angezeigten Niveaus durchbricht, besteht eine etwa 77%ige Chance, dass er sich in dieselbe Richtung bewegt. Wenn er die blaue Linie überschreitet, gibt es viele Möglichkeiten für einen Kursanstieg. Wenn er hingegen die rote Linie unterschreitet, besteht eine hohe Wahrscheinlichkeit, dass der Kurs fällt. Wir sollten immer das letzte Signal des Indikators berücksichtigen, d.h. wir sollten uns
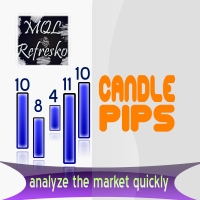
Der "Candle Pips MT5"-Indikator ist ein Werkzeug, das uns hilft, die Größe der Kerzen auf unserer Plattform schnell zu sehen; dies ist nicht nur eine große Hilfe für jeden Händler, der den Markt gründlich studieren will, sondern auch für verschiedene Strategien, die auf der Größe der Kerzen basieren. Der Indikator zeigt den Wert in Pips jeder Kerze in unserem aktuellen Diagramm an, gerundet auf eine ganze Zahl.
Der Indikator zeigt die Informationen auch als Histogramm am unteren Rand des Diagra
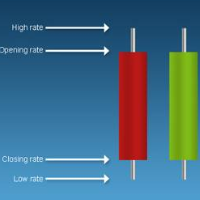
Der Indikator 'Info Körper und Schattenkerzen' färbt die Kerzenkörper und -schatten entsprechend den Einstellungen. Wenn der Parameter "Kerzenkörpergröße" beispielsweise 10 ist, sucht der Indikator nach Kerzen, die eine Körpergröße von 10 oder mehr haben. Die Kerzenschatten werden auf die gleiche Weise berechnet. Erkannte Kerzen können eingefärbt werden (Körperfarbe, Schattenfarbe). Der Indikator kann sowohl für vier- als auch für fünfstellige Notierungen eingestellt werden. МetaТrader 4 Versio
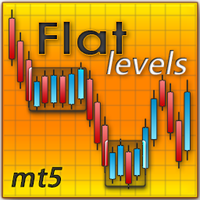
Der Indikator sucht nach flachen Zonen, in denen sich der Preis über einen längeren Zeitraum innerhalb einer bestimmten Spanne bewegt.
Einstellungen History - Historie für die Berechnung/Anzeige in Balken FlatBars - Breite des flachen Bereichs in Balken FlatRange - Höhe des flachen Bereichs in Pips IncludeSmallBar - Berechnung mit internen Flat Bars CalcFlatType - Berechnung der Flat-Zonen nach (HIGH_LOW/OPEN_CLOSE) DistanceForCheck - Abstand (in Pips) vom Flat-Level, bei dem die Prüfung aktivi

Jeder Indikator hat seine Vor- und Nachteile. Trendindikatoren zeigen gute Signale während eines Trends, hinken aber während eines Tiefs hinterher. Flache Indikatoren gedeihen in der Flaute, sterben aber ab, sobald ein Trend einsetzt. All dies wäre kein Problem, wenn es einfach wäre, vorherzusagen, wann eine Flaute in einen Trend und wann ein Trend in eine Flaute übergeht, aber in der Praxis ist dies eine äußerst schwierige Aufgabe. Was wäre, wenn man einen solchen Algorithmus entwickeln würde,

Der Correct Entry-Indikator zeigt bestimmte relativ korrekte Punkte für potenzielle Markteintritte auf dem Chart an. Er basiert auf der Hypothese der Nichtlinearität der Kursbewegungen, nach der sich der Kurs in Wellen bewegt. Der Indikator zeigt die angegebenen Punkte auf der Grundlage bestimmter Preisbewegungsmodelle und technischer Daten an.
Eingangsparameter des Indikators: Сorrectness - Der Parameter charakterisiert den Grad der Genauigkeit der Einstiegssignale. Er kann von 0 bis 100 varii

Dieser Indikator zeigt die Zeit bis zur Eröffnung des nächsten Balkens oder der nächsten Kerze an. Beispiele für die verbleibende Zeit bis zur Eröffnung eines neuen Balkens: Beispiel für den Zeitrahmen М1: 05 = 05 Sekunden. Beispiel für den Н1-Zeitrahmen: 56:05 = 56 Minuten, 05 Sekunden. Beispiel für den Zeitrahmen D1: 12:56:05 = 12 Stunden, 56 Minuten, 05 Sekunden. Beispiel für den Zeitrahmen W1: W1(06): 12:56:05 = 6 Tage, 12 Stunden, 56 Minuten, 05 Sekunden. МetaТrader 5 Version: https: // www

Der Indikator zeigt die Richtung und Nachhaltigkeit des Trends sowie seine Umkehrungen an. Verwenden Sie den Indikator, um nach erfolgreichen Einstiegen zu suchen, die Performance-Engpässe zu minimieren und die Zeit bis zum Ausstieg aus Geschäften. Der Indikator wird nie neu gezeichnet . Er ist ein einfach einzurichtendes visuelles Hilfsmittel für Anfänger und erfahrene Händler und passt zu jedem Handelsstil. Der Indikator wird sofort bei der Eröffnung einer Kerze als zwei Linien angezeigt: ROAD

HiLo Activator ist einer der am häufigsten verwendeten Indikatoren zur Trendbestimmung. Hier finden Sie ihn mit der Möglichkeit, den Zeitraum und die Farben anzupassen. Dieser Indikator zeichnet auch Auf- und Abwärtspfeile, wenn es eine Trendänderung gibt, die sehr starke Einstiegs- und Ausstiegspunkte anzeigen. HiLo passt gut zu verschiedenen Arten von Perioden für den Daytrading. Sie können leicht erkennen, wann es Zeit ist, zu kaufen oder zu verkaufen. Er eignet sich auch für andere Zeiträume

Der Indikator zeigt Spitzenwerte der Aktivität an, die durch das maximale Volumen gebildet werden, und verfolgt die Korrelation der Kerzen auf allen Zeitrahmen (vom höchsten bis zum niedrigsten). Jedes Volumenniveau ist eine Art Schlüsselaktivität für den Handel. Das wichtigste Cluster befindet sich innerhalb eines Monats, einer Woche, eines Tages, einer Stunde, etc.
Merkmale des Indikatorbetriebs Ein Volumenlevel erhält den Status "Nachfrage", wenn das nächstgelegene Volumenlevel links und dar

IceFX VelocityMeter Mini ist ein einzigartiger Indikator auf der MetaTrader 4 Plattform, der die Geschwindigkeit des Forex-Marktes misst. Es handelt sich nicht um einen normalen Volumen- oder anderen Messindikator, weil IceFX VelocityMeter Mini in der Lage ist, die in den Ticks versteckten Bewegungen des Marktes zu verstehen, und diese wertvollen Informationen können nicht auf gewöhnliche Weise aus den Kerzen gelesen werden. Die Software überwacht die empfangenen Ticks (Häufigkeit, Ausmaß der Ve

MetaCOT 2 ist ein Satz von Indikatoren und spezialisierten Dienstprogrammen für die Analyse der Berichte der U.S. Commodity Futures Trading Commission. Dank der von der Kommission herausgegebenen Berichte ist es möglich, den Umfang und die Richtung der Positionen der wichtigsten Marktteilnehmer zu analysieren, was die Genauigkeit der langfristigen Preisvorhersage auf ein neues, höherwertiges Niveau bringt, das den meisten Händlern nicht zugänglich ist. Diese Indikatoren, die mit der Fundamentala

MetaCOT 2 ist ein Satz von Indikatoren und spezialisierten Dienstprogrammen für die Analyse der Berichte der U.S. Commodity Futures Trading Commission. Dank der von der Kommission herausgegebenen Berichte ist es möglich, den Umfang und die Richtung der Positionen der wichtigsten Marktteilnehmer zu analysieren, was die Genauigkeit der langfristigen Preisvorhersage auf ein neues, höherwertiges Niveau bringt, das den meisten Händlern nicht zugänglich ist. Diese Indikatoren, die mit der Fundamentala

Der Indikator erkennt Divergenzsignale - die Abweichungen zwischen den Kursspitzen und den Werten des MACD-Oszillators. Die Signale werden als Pfeile im Zusatzfenster angezeigt und werden durch Meldungen in einem Pop-up-Fenster, E-Mails und Push-Benachrichtigungen aufrechterhalten. Die Bedingungen, die das Signal gebildet haben, werden durch Linien auf dem Chart und im Indikatorfenster angezeigt.
Die Parameter des Indikators MacdFast - schnelle MACD-Linienperiode MacdSlow - langsamer MACD-Linie

Der Indikator zeichnet drei aufeinanderfolgende Kanäle von Schlusskursen auf und prüft, ob sie dem in den Screenshots gezeigten Schema entsprechen. Die Länge der einzelnen Kanäle ist nicht festgelegt und wird vom Programm innerhalb des Bereichs ChMin und ChMax gewählt. Wenn die Übereinstimmung gefunden wird, wird ein Signal gebildet (ein entsprechend gefärbter Pfeil). Ein mögliches Stop-Loss-Niveau wird als Raute angezeigt. Ein Signal kann durch ein Pop-up-Fenster, eine Push-Benachrichtigung und

Der Indikator erkennt und zeigt М. Gartley's Butterfly-Muster. Das Muster wird durch die Extremwerte des ZigZag-Indikators gezeichnet (in den Ressourcen enthalten, muss nicht installiert werden). Nach der Erkennung des Musters benachrichtigt der Indikator über ein Pop-up-Fenster, eine mobile Benachrichtigung und eine E-Mail. Das Muster und die Wellenparameter werden auf den Screenshots angezeigt. Die Standardparameter werden nur zu Demonstrationszwecken verwendet, um die Anzahl der erkannten Mus

Two Dragon ist ein fortschrittlicher Indikator zur Erkennung von Trends, der komplexe mathematische Algorithmen verwendet. Er funktioniert in jedem Zeitrahmen und Symbol. Der Indikator wurde mit der Möglichkeit entwickelt, alle Parameter nach Ihren Anforderungen anzupassen. Jede Funktion kann aktiviert oder deaktiviert werden. Wenn sich ein Kauf-/Verkaufstrend ändert, benachrichtigt der Indikator mit Hilfe von Benachrichtigungen: Warnung, Tonsignal, E-Mail, Push. Produktbewertungen sind willkomm

Einführung in den Support Resistance Indicator Unterstützung und Widerstand sind wichtige Kursniveaus, auf die man während des Intraday-Marktes achten sollte. Diese Preisniveaus werden oft vor der Entwicklung eines neuen Trends getestet oder stoppen den bestehenden Trend, was zu einer Trendumkehr an diesem Punkt führt. Hochpräzise Unterstützungen und Widerstände sind für erfahrene Händler unverzichtbar. Viele typische Handelsstrategien wie Ausbrüche oder Trendumkehr können gut um diese Unterstüt

Das Hauptziel dieses Indikators ist es, Ein- und Ausstiegspunkte zu bestimmen. Deshalb zeichnet ExactArrow nichts anderes als Pfeile, die Ein- und Ausstiegspunkte anzeigen. Trotz der scheinbaren Einfachheit des Indikators verfügt er über komplizierte analytische Algorithmen, die die Einstiegs- und Ausstiegspunkte bestimmen. Der Indikator erzeugt genaue und rechtzeitige Ein- und Ausstiegssignale, die auf der aktuellen Kerze erscheinen. Der Indikator generiert im Durchschnitt 1-2 Kerzen früher als

Der Indikator für Angebots- und Nachfragezonen ist eines der besten Tools, die wir je entwickelt haben. Dieses großartige Tool zeichnet automatisch Angebots- und Nachfragezonen, die besten Orte für die Eröffnung und Schließung von Positionen. Er verfügt über viele fortschrittliche Funktionen, wie die Unterstützung von Zonen mit mehreren Zeitrahmen, die Anzeige der Breite der Zonen, Warnmeldungen für retuschierte Zonen und vieles mehr. Aufgrund der Fraktalität des Marktes kann dieser Indikator fü
Dieser innovative technische Indikator wurde entwickelt, um ruhige Marktphasen zu erkennen, bevor ein Markt mit hoher Volatilität einsetzt. Wie viele gute technische Indikatoren ist auch der Market Activity Index sehr stabil und kann ohne allzu große Einschränkungen auf viele Finanz- und Nicht-Finanzinstrumente angewendet werden. Der Marktaktivitätsindex eignet sich am besten, um die abwechselnde Form von Märkten mit niedriger und hoher Volatilität sichtbar zu machen. Er ist ein sehr nützliches

Trendindikator. Entwickelt für den langfristigen Handel. Es wird empfohlen, ihn auf einem Chart mit einem Zeitrahmen von M30 oder höher zu verwenden. Wenn die rote Linie die grüne Linie unterhalb der Nulllinie kreuzt, bzw. die grüne Linie sich von oben kreuzt, handelt es sich um ein Kaufsignal. Wenn die grüne Linie die rote Linie oberhalb der Nulllinie kreuzt, bzw. die rote Linie von oben kreuzt, handelt es sich um ein Verkaufssignal.
Parameter Indikatorperiode - Periode des Indikators. (Je grö

Der Indikator zeigt Punkte an, die einen Symboltrend anzeigen. Bullische (blaue) Punkte bedeuten Kaufsignale. Bärenhafte (rote) Punkte bedeuten Verkaufssignale. Ich empfehle, den Indikator in Verbindung mit anderen zu verwenden. Zeitrahmen: M30 und höher. Einfache Strategie: Kaufen Sie, wenn zwei blaue Punkte auf dem Chart zu sehen sind. Verkaufen, wenn zwei rote Punkte auf dem Chart zu sehen sind.
Parameter Trendpunkte-Periode - Die Hauptperiode des Indikators; Periode des wahren Bereichs - Di

Trend-Indikator. Zeigt eine zweifarbige Linie im Diagramm an, die die Marktrichtung angibt. Die blaue Farbe zeigt den Aufwärtstrend an. Die rote Linie zeigt den Abwärtstrend an. Es wird empfohlen, ihn auf Charts mit dem Zeitrahmen M30 oder höher zu verwenden. Einfache Strategie: Wenn die Linie ihre Farbe zu blau ändert, kaufen Sie. Wenn sie sich rot färbt, verkaufen Sie.
Parameter Trend Uncover Periode - Periode des Indikators;

Der Pionier der Trend-Erkennung! Ein leistungsfähiger Indikator, der Ausschläge und unsichere Marktgeräusche vermeidet. Funktioniert hauptsächlich als Filter, um Ihnen zu helfen, in Richtung des Trends zu handeln. Er funktioniert in jedem Paar und Zeitrahmen.
Merkmale Fortgeschrittene Trenderkennungssoftware mit komplexen Algorithmen, die als unterstützendes Werkzeug oder System verwendet werden kann. Einzigartige Trenderkennung, die "Whipsaws" und unsichere Marktgeräusche vermeidet Analysiert

Pipfinite entwickelt einzigartige, qualitativ hochwertige und erschwingliche Trading-Tools. Unsere Tools können für Sie funktionieren oder auch nicht, daher empfehlen wir Ihnen dringend, zuerst die Demo-Version für MT4 auszuprobieren. Bitte testen Sie den Indikator vor dem Kauf, um festzustellen, ob er für Sie funktioniert. Wir wollen Ihre guten Bewertungen, also beeilen Sie sich und testen Sie ihn kostenlos...wir hoffen, dass Sie ihn nützlich finden.
Kombi Energiestrahl mit Swing Control Strat

Pipfinite entwickelt einzigartige, qualitativ hochwertige und erschwingliche Trading-Tools. Unsere Tools können für Sie funktionieren oder auch nicht, daher empfehlen wir Ihnen dringend, zuerst die Demo-Version für MT4 auszuprobieren. Bitte testen Sie den Indikator vor dem Kauf, um festzustellen, ob er für Sie funktioniert. Wir wollen Ihre guten Bewertungen, also beeilen Sie sich und testen Sie ihn kostenlos...wir hoffen, dass Sie ihn nützlich finden.
Kombi Razor Scalper mit Trend Laser Strateg
Pipfinite entwickelt einzigartige, qualitativ hochwertige und erschwingliche Trading-Tools. Unsere Tools können für Sie funktionieren oder auch nicht, daher empfehlen wir Ihnen dringend, zuerst die Demo-Version für MT4 auszuprobieren. Bitte testen Sie den Indikator vor dem Kauf, um festzustellen, ob er für Sie funktioniert. Wir wollen Ihre guten Bewertungen, also beeilen Sie sich und testen Sie ihn kostenlos...wir hoffen, dass Sie ihn nützlich finden.
Achtung Dieses Trading-Tool wurde speziell

Der bewährte und getestete Breakout-Indikator! Breakout Analyzer verwendet einen fortschrittlichen Algorithmus, der auf hochwahrscheinlichen Preismustern basiert. Jeder Handel wird im Statistik-Panel analysiert, um Ihnen zu helfen, die besten Breakout-Setups zu bewerten.
Bonus-Strategie 1
Breakout Analyzer mit Volumen-Kritik Video ansehen: (Hier klicken)
Bonus-Strategie 2
Breakout Analyzer mit Stärkeanzeige
Video ansehen: (Hier klicken)
Eigenschaften Universelle Kompatibilität zu verschieden
Hatten Sie einen gewinnbringenden Handel, der sich plötzlich umkehrte? Der Ausstieg aus einem Handel ist genauso wichtig wie der Einstieg! Exit Scope hilft Ihnen dabei, Ihren aktuellen Handelsgewinn zu maximieren und zu vermeiden, dass aus erfolgreichen Geschäften Verlierer werden.
Achtung Ausstiegssignale dürfen NICHT für den Einstieg in einen Handel verwendet werden! Exit bedeutet, dass Sie Ihre Trades schließen, um Korrekturen/Umkehrungen zu vermeiden, die bestehende Gewinne zunichte machen

Pipfinite entwickelt einzigartige, qualitativ hochwertige und erschwingliche Trading-Tools. Unsere Tools können für Sie funktionieren oder auch nicht, daher empfehlen wir Ihnen dringend, zuerst die Demo-Version für MT4 auszuprobieren. Bitte testen Sie den Indikator vor dem Kauf, um festzustellen, ob er für Sie funktioniert. Wir wollen Ihre guten Bewertungen, also beeilen Sie sich und testen Sie ihn kostenlos...wir hoffen, dass Sie ihn nützlich finden.
Kombi Channel Flow mit Stärkeanzeige Strate
Pipfinite entwickelt einzigartige, qualitativ hochwertige und erschwingliche Trading-Tools. Unsere Tools können für Sie funktionieren oder auch nicht, daher empfehlen wir Ihnen dringend, zuerst die Demo-Version für MT4 auszuprobieren. Bitte testen Sie den Indikator vor dem Kauf, um festzustellen, ob er für Sie funktioniert. Wir wollen Ihre guten Bewertungen, also beeilen Sie sich und testen Sie ihn kostenlos...wir hoffen, dass Sie ihn nützlich finden.
Kombi Schwungkontrolle mit Energiestrahl St
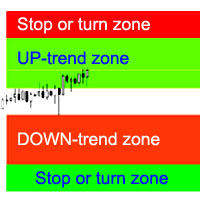
Der Indikator berechnet die wahrscheinlichsten Zonen von Trendstopp/-umkehr, Zonen zuversichtlicher Trendbewegungen.
Dabei werden berücksichtigt:
die Rate der Preisänderung; relativer Abweichungswinkel des Graphen; durchschnittliche Bandbreite der Preisbewegung; der Preis verlässt seine "Komfortzone"; ATR-Indikatorwerte. Der Indikator kann einen Alarm signalisieren, wenn der Preis in die Stopp-/Umkehrzonen eintritt.
Einstellungen Die gesamte Länge zeichnen? - Zonen bis zum Ende des Diagramms

Es handelt sich um einen Trendfolgeindikator, der beim langfristigen Handel am effizientesten ist. Er erfordert keine tiefgreifenden Kenntnisse, um beim Handel eingesetzt zu werden. Er verfügt über einen einzigen Eingabeparameter, der die Anwendung erleichtert. Der Indikator zeigt Linien und Punkte sowie Signale an, die den Trader über den Beginn eines Aufwärts- oder Abwärtstrends informieren.
Parameter Indikator_Periode - Indikatorperiode (je größer, desto langfristiger die Signale).

Alan Hulls gleitender Durchschnitt, reagiert empfindlicher auf die aktuelle Preisaktivität als der normale MA. Reagiert schneller auf Trendänderungen, zeigt die Preisbewegung deutlicher an. Wenn sich die Farbe des Indikators ändert, sendet er eine Push-Benachrichtigung an das mobile Gerät, eine Nachricht an die E-Mail und zeigt einen Pop-up-Alarm an.
Parameter Periode - Glättungsperiode, empfohlene Werte liegen zwischen 9 und 64. Je größer die Periode, desto glatter der Indikator. Methode - Glä
Dieser Indikator analysiert, wie effizient die aktuelle Marktbewegung ist, basierend auf dem tatsächlichen High-Low-Verhältnis einer bestimmten Anzahl von Balken. [ Installationsanleitung | Update-Anleitung | Fehlerbehebung | FAQ | Alle Produkte ] Das Verhältnis ist die Effektivität der Marktbewegung Ein Verhältnis unter 1 bedeutet, dass der Markt nirgendwo hinführt Ein Verhältnis über 1 bedeutet, dass der Markt beginnt, Direktionalität zu zeigen Ein Verhältnis über 2 bedeutet, dass der Markt e
Der MetaTrader Market ist die beste Plattform für den Verkauf von Handelsroboter und technischen Indikatoren.
Sie brauchen nur ein gefragtes Programm für die MetaTrader Plattform schreiben und schön gestalten sowie eine Beschreibung hinzufügen. Wir helfen Ihnen, das Produkt im Market Service zu veröffentlichen, wo Millionen von MetaTrader Benutzern es kaufen können. Konzentrieren Sie sich auf dem Wesentlichen - schreiben Sie Programme für Autotrading.
Sie verpassen Handelsmöglichkeiten:
- Freie Handelsapplikationen
- Über 8.000 Signale zum Kopieren
- Wirtschaftsnachrichten für die Lage an den Finanzmärkte
Registrierung
Einloggen
Wenn Sie kein Benutzerkonto haben, registrieren Sie sich
Erlauben Sie die Verwendung von Cookies, um sich auf der Website MQL5.com anzumelden.
Bitte aktivieren Sie die notwendige Einstellung in Ihrem Browser, da Sie sich sonst nicht einloggen können.