ACI Bollinger Bands
- Indikatoren
- Version: 1.1
- Aktualisiert: 5 Dezember 2021
Sind Sie es leid, die Einstellungen der Indikatoren zu ändern und dabei wertvolle Zeit zu verlieren? Müde von der Unsicherheit bezüglich ihrer Effizienz? Haben Sie Angst vor der Ungewissheit bezüglich ihrer Rentabilität? Dann ist der Indikator ACI (automatisch kalibrierbarer Indikator) genau das Richtige für Sie. Wenn Sie ihn starten, können Sie diese drei Probleme ganz einfach lösen, indem Sie nur auf eine einzige Schaltfläche "Kalibrieren" klicken. Um die höchste Effizienz zu erreichen, sollten Sie noch eine weitere Aktion durchführen: Schieben Sie den Leistungsschieberegler auf das Maximum.
ACI spart Ihnen viel Zeit, die Sie für nützlichere Dinge verwenden können, z. B. für Ihren Urlaub, und die Effizienz wird um ein Vielfaches gesteigert. Darüber hinaus können Sie dank der separaten grafischen Oberfläche die Einstellungen des Indikators nicht nur beobachten, sondern auch ganz einfach im laufenden Betrieb ändern, indem Sie die Kalibrierungsbereiche visuell im Diagramm auswählen.
Nützliche Informationen
Wenn Sie mehr Informationen über einen ähnlichen Indikator erhalten möchten, bevor Sie einen Kauf tätigen, klicken Sie auf den Link, um den einfachsten Indikator der ACI-Serie kostenlos zu testen. Dort finden Sie auch ein Demonstrationsvideo.
Indikator zum Kalibrieren
Der standardmäßig eingebaute gleitende Durchschnitt wird als kalibrierter Indikator verwendet. Die folgenden Eigenschaften werden als kalibrierte Eigenschaften verwendet:
- Zeitraum für die Berechnung der Durchschnittslinie.
- Anzahl der Standardabweichungen (Bonuseigenschaft).
- Verschiebung des Indikators relativ zum Preisdiagramm.
- Art der Glättung:
- Einfache Mittelwertbildung,
- Exponentielle Mittelwertbildung,
- Geglättete Mittelwertbildung,
- Linear gewichtete Mittelwertbildung.
- Der verwendete Preis:
- Schlusskurs,
- Eröffnungskurs,
- Der Höchstkurs für den Zeitraum,
- Der Mindestpreis für den Zeitraum,
- Medianpreis,
- Typischer Preis,
- Durchschnittspreis.
Zur Berechnung der Qualität (Rentabilität) werden Standard-Eingangs-/Ausgangssignale verwendet:
Wenn der Preis unter dem unteren Niveau des Indikators liegt, wird das Signal als Kaufsignal betrachtet. Wenn der Preis das höhere Niveau des Indikators überschreitet, wird das Signal als Verkaufssignal betrachtet.
ACI
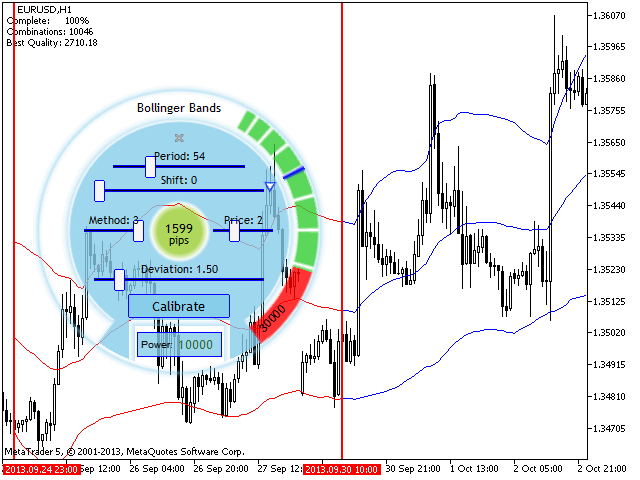
Der automatische Kalibrator und der kalibrierte Indikator können über die grafische ACI-Schnittstelle gesteuert werden, die die Anzahl der von Ihnen auszuführenden Aktionen auf ein Minimum reduziert. Um den Kalibrierungsprozess zu starten, klicken Sie auf die Schaltfläche Kalibrieren. Wenn die Kalibrierleistung die angegebene Marke erreicht, wird die Kalibrierung gestoppt oder kann durch einen weiteren Klick beendet werden.
Neben der Kalibrierung kann ACI auch schnell die Qualität (Rentabilität) der ausgewählten Parameter des kalibrierten Indikators in einem bestimmten Zeitintervall eines Diagramms berechnen und anzeigen. Die Berechnung erfolgt nach der in den Einstellungen angegebenen Methode (Parameter "Kriterium für die Kalibrierung"). Das Zeitintervall im Chart kann mit Hilfe der Ebenen geändert werden. Bewegen Sie dazu den Cursor auf den oberen oder unteren Teil der Ebene, markieren Sie ihn mit einem Klick und beginnen Sie mit der Änderung.
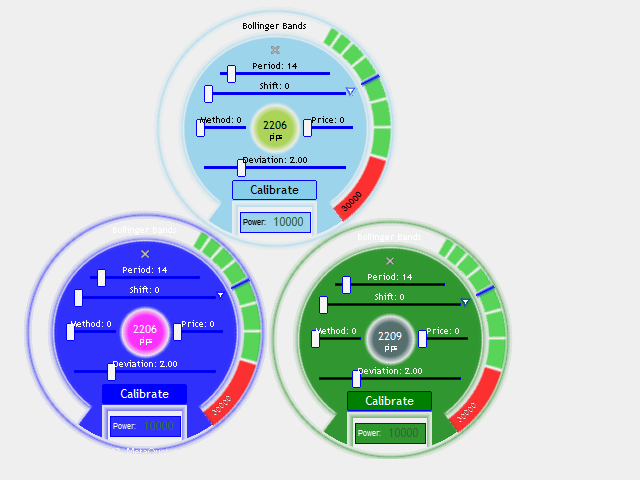
Falls erforderlich, können Sie die Leistung (Power) des Kalibrators erhöhen oder verringern, indem Sie den Schieberegler im bzw. gegen den Uhrzeigersinn bewegen. Der transparente Bereich des Schiebereglers ermöglicht die Einstellung von 0% bis 20% der Gesamtleistung, der grüne Bereich von 20% bis 50% und der rote Bereich von 50% bis 100%. Falls erforderlich, können Sie mit mehreren Kopien dieses Indikators auf demselben Diagramm arbeiten.
Einstellungen
Der Indikator verfügt über mehrere Einstellungen, die von kalibrierten Indikatorparametern bis hin zu denen der grafischen ACI-Schnittstelle reichen.
| Name der Eigenschaft | Beschreibung |
|---|---|
| Bollinger Bands Standardeinstellungen | |
| Standard BB Periode | Periode für die Berechnung der Durchschnittslinie, Standard. |
| Standard BB Abweichung | Anzahl der Standardabweichungen, Voreinstellung. |
| Voreinstellung BB Verschiebung | Verschiebung des Indikators relativ zum Preisdiagramm, Voreinstellung. |
| Vorgabe BB-Methode | Art der Glättung, Voreinstellung. |
| Voreinstellung BB Preis | Der verwendete Preis, Voreinstellung. |
| Leistung | |
| Standardleistung | Die Standardleistung, die während der Kalibrierung erreicht werden soll. |
| Maximale Leistung | Maximal mögliche Leistung. |
| Kriterium | |
| Kriterium für die Kalibrierung | Kriterium für die Kalibrierung. Methode zur Berechnung der Qualität (Rentabilität). |
| Ausgewähltes Intervall des Charts | |
| Startbalken | Der Balken, der den Beginn des Zeitintervalls angibt. |
| Endbalken | Der Balken, der das Ende des Zeitintervalls angibt. |
| Einstellungen des Bollinger Bands Reglers | |
| Minimale BB-Periode | Mindestzeitraum für die Berechnung der Durchschnittslinie. |
| Minimale BB-Abweichung | Anzahl der Standardabweichungen, Minimum. |
| Minimale BB-Verschiebung | Verschiebung des Indikators relativ zum Preisdiagramm, Minimum. |
| Minimum BB Methode | Art der Glättung, Minimum. |
| Minimum BB Preis | Der verwendete Preis, Minimum. |
| Maximum BB Zeitraum | Zeitraum für die Berechnung der Durchschnittslinie, maximal. |
| Maximale BB-Abweichung | Anzahl der Standardabweichungen, maximal. |
| Maximale BB-Verschiebung | Verschiebung des Indikators relativ zum Preisdiagramm, maximal. |
| Maximale BB-Methode | Art der Glättung, Maximum. |
| Maximaler BB-Preis | Der verwendete Preis, maximal. |
| Einstellungen des UI-Panels | |
| Panel-Größe | Größe des Panels (in Pixel). 0 - automatische Größenberechnung. |
| Panel Transparent | Transparentes Niveau des Panels. 0 - vollständig sichtbar, 100 - vollständig verborgen. |
| Panel-Farbe | Allgemeine Farbe des Panels. |
| Schriftfarbe des Panels | Farbe der Panel-Schriftarten. |
| Farbe der Qualität | Farbe der Qualität (Rentabilität). |


Super