Technische Indikatoren für den MetaTrader 5 - 55

RCCMA ist ein allgemeiner gleitender Durchschnittsindikator, der mit ReviewCandleChart funktioniert. Das Original ist "Custom Moving Average", bereitgestellt von MetaQuotes Software Corp. Basierend auf diesem Quellcode, habe ich ReviewCandleChart angepasst.
Vorteile Wenn ReviewCandleChart eingeschaltet ist, wird rechts von der vertikalen Referenzlinie keine Linie angezeigt. Wenn ReviewCandleChart eingeschaltet ist und Sie eine Taste wie "Z" oder "X" drücken, wird die MA gezeichnet. Wenn ReviewC
FREE

SpreadTimeInfo-Indikator
Multifunktionaler Indikator zur Verfolgung von Sitzungszeit, Spread und Handelsinstrumenten.
Hauptmerkmale Anzeige der Zeit bis zur Eröffnung/Schließung der amerikanischen Sitzung Countdown-Timer bis zum Schließen der aktuellen Kerze Spread-Überwachung mit visueller Warnung Russischsprachige Bezeichnungen von mehr als 100 Handelsinstrumenten Automatische Berücksichtigung von Wochenenden und Feiertagen
Indikator-Einstellungen
### Amerikanische Sitzung - NY-
FREE

Der Martinware Closing Time Alarm Indikator dient dazu, Trader zu warnen, dass die aktuelle Periode (Balken, Kerze) bald enden wird.
Eingabeparameter: Zeitverschiebung: um wie viele Sekunden vor dem Ende der aktuellen Periode der Alarm auslösen muss Warnung mit Ton: informiert, ob die Warnung das Abspielen eines Tons beinhalten soll Soundauswahl: eine Liste der verfügbaren Sounds Benutzerdefinierter Sound: Name der benutzerdefinierten Sounddatei, die verwendet werden soll, falls "benutzerdefi
FREE

Eine verbesserte Version des Standardabweichungsindikators.
Sie ist jetzt eine reaktionsschnelle und geglättete Linie.
Die Einrichtung ist nicht ganz einfach - aber ich hoffe, Sie können es schaffen.
Es ist sehr einfach, die Messwerte dieses Indikators zu verstehen, die Bedeutung ist die gleiche wie die der normalen Standardabweichung.
//////////////////////////////////////////////// ///////////////////////////////////
Ich hoffe, dieser Indikator wird Ihnen beim erfolgreichen Handel sehr n
FREE
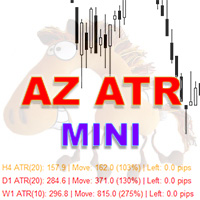
AZ Mini-ATR-Indikator
Auf vielfachen Wunsch habe ich eine Miniaturversion des ATR-Indikators erstellt. Zusätzlich zu den grundlegenden Funktionen, wie der Berechnung der durchschnittlichen ATR auf der Grundlage bestimmter Parameter, kann er die Farbe eines Textbalkens ändern, je nachdem, wie weit sich der Kurs bereits bewegt hat. Hat sich der Kurs um mehr als 110 % seiner durchschnittlichen ATR bewegt, färbt sich der Balken rot; hat er sich um weniger als 80 % bewegt, ist der Balken grün. Die
FREE

Der Indikator hat nur einen Parameter - die Anzahl der Balken für die Analyse. Der Indikator berechnet Statistiken darüber, wann sich der Markt abwärts und wann er sich aufwärts bewegt hat, sowie die Anzahl der Balken für jede Bewegung. Aus diesen Daten wird die durchschnittliche Anzahl der Balken berechnet, die im Indikatorfenster angezeigt wird. Wenn die Indikatorwerte stark abnehmen, bereitet sich der Markt auf eine Aufwärtsbewegung vor. Wenn die Indikatorwerte über einen längeren Zeitraum au
FREE

Der Indikator zeichnet ein farbiges Histogramm aus Vergleichen der Stärken von Bullen und Bären.
Er funktioniert folgendermaßen:
Die Werte der beiden Indikatoren Bären und Bullen werden genommen, wer auf der Kerze stärker ist, wird verglichen, die Spalte wird ausgefüllt. Das war's schon.
.
FREE

Kritischer Handel, Omni-Channel Mit diesem Indikator können Sie einen einzigartigen Kanal aus einem Basistyp und einem Bereichstyp erstellen. Kanäle eignen sich hervorragend zum Aufspüren von Übertreibungen oder dem Beginn neuer Trends. In einem sich ständig verändernden Markt ist es wichtig, sich einen eigenen Vorteil zu verschaffen, den sonst niemand hat. Lassen Sie Omni-Channel zu Ihrer einzigartigen Handelsstrategie beitragen. Bitte wenden Sie sich an criticaltrading@outlook.com, um weitere
FREE
Der Multicurrency-Indikator zeigt in einem separaten Fenster die Bewegung der Währungspaare in Pips mit Divergenz vom Tagesbeginn an. Während des Betriebs ist es möglich, verschiedene Paare direkt im Chart dynamisch ein- und auszuschalten. Beim ersten Start kann es eine Weile dauern, bis die Historie für die wichtigsten Währungspaare geladen ist. Für die Währungen CAD, CHF, JPY ist der Chart invertiert.
Beim erneuten Öffnen werden alle Indikatoreinstellungen automatisch wiederhergestellt.
FREE

On Off Trade On Off Trade ist ein Indikator für MetaTrader 5, der den Marktstatus und den Zeitplan der Handelssitzung direkt auf dem Chart anzeigt. Merkmale: Zeigt an, ob der Markt jetzt geöffnet ist (STATUS: MARKT OFFEN / GESCHLOSSEN ). Zeigt die aktive Handelssitzung an: Start- und Endzeit. Wenn der Markt geschlossen ist - zeigt an, wann die nächste Sitzung beginnt. Optional können Sie den vollständigen Zeitplan aller Sitzungen für die Woche mit Hervorhebung des aktuellen Tages und der a
FREE

Nicht jeder kann einen Indikator schreiben. Aber jeder kann eine Idee haben. Der Indikator Universal Main Window Free MT5 , der als Eingangsparameter die Formel benötigt, nach der die Indikatorlinie gezeichnet werden soll, hilft bei der Umsetzung. Dieser Indikator ist für die Verwendung im Hauptfenster des Charts vorgesehen.
Alle Indikatoren der Serie Universal :
Hauptfenster Separates Fenster Kostenlos MT4 Universal Hauptfenster Frei MT5 Universelles Hauptfenster Free MT5 MT4 Universal Separat
FREE

Produktkonzept Dieser Indikator wurde entwickelt, um die Stärke eines vorherrschenden Trends zu erkennen und zu bestätigen, indem er die Momentum-Analyse mit statistischen Preisabweichungen kombiniert. Er dient als umfassender Filter zur Unterscheidung zwischen hochwahrscheinlichen Trendfortsetzungen und Markterschöpfungsphasen.
Technische Hauptmerkmale
Adaptive Glättung: Verwendet einen fortschrittlichen mathematischen Algorithmus, um die Verzögerung zu reduzieren, ohne die Signalgenauigkeit z
FREE

Anzeige von Datum, Uhrzeit und Kurs entsprechend der Bewegung des Mauszeigers auf dem Chart Dies ist nützlich für den diskretionären Handel.
Es ist ein unverzichtbares Werkzeug zur Überprüfung und zum Studium vergangener Marktpreise und Geschäfte. Charakteristisch Datum , Zeit und Preis werden angezeigt.
Der Wert folgt der Bewegung der Maus.
Sie können die Farbe des Textes ändern. Bitte sehen Sie sich das Video auf youtube an. Nur für MT5.
FREE

Nicht jeder kann einen Indikator schreiben. Aber jeder kann eine Idee haben. Der Indikator Universal Separate Window Free MT5 , der als Eingangsparameter die Formel nimmt, nach der die Indikatorlinie gezeichnet werden soll, wird bei der Umsetzung helfen. Dieser Indikator ist für die Verwendung im separaten Chartfenster vorgesehen.
Alle Indikatoren der Serie Universal :
Hauptfenster Separates Fenster Kostenlos MT4 Universal Hauptfenster Frei MT5 Universelles Hauptfenster Free MT5 MT4 Universal S
FREE

Einfach. Informativ. Sofort in Ihrem Chart sichtbar. Alwinson Active Trades Info ist ein leichtgewichtiger, benutzerdefinierter Indikator, der eine Echtzeit-Zusammenfassung Ihrer aktuell offenen Trades anzeigt - direkt auf Ihrem Chart. Sie müssen nicht mehr zwischen den Tabs wechseln, um zu sehen, welche Paare aktiv sind und wie viel Lotgröße im Spiel ist.
Alwinson Active Trades Info ist auch für die MetaTrader 4 (MT4) Version verfügbar (bitte schauen Sie sich meine anderen Produkte an) .
Ha
FREE

Der von Charles LeBeau eingeführte Chandelier Exit wird im Buch "Come into My Trading Room" beschrieben.
Er berechnet jeden Stopp einer Long-Position in einem Aufwärtstrend vom höchsten Punkt aus, der während dieser Rallye erreicht wurde, und hat seinen Namen vom Kronleuchter, der vom höchsten Punkt im Raum hängt. Der Chandelier Exit verwendet ein Vielfaches der Average True Range (ATR) und subtrahiert diese vom höchsten Stand seit Beginn des Handels. Es entsteht ein neuer Handel, wenn der vorhe

Eine der wichtigsten Regeln beim Handel lautet: Ziehen Sie Ihre Stopps nie so nach, dass sich Ihr Risiko erhöht. Unsere Stopp-Sequenz zeigt die automatische Verschärfung der Stopps. Sie erscheinen als eine Reihe von Punkten mit abnehmendem Risiko, bis der Handel schließlich gestoppt wird.
Das Problem besteht darin, dass Sie den Stopp möglicherweise zu eng setzen, wenn Sie an einem anderen Punkt als dem Anfangspunkt der Sequenz einsteigen. Stop-Entry-Diagramme zeigen Ihnen den Anfangswert für den

Der von Charles LeBeau eingeführte Chandelier Exit wird im Buch "Come into My Trading Room" beschrieben. Er berechnet jeden Stopp für eine Short-Position in einem Abwärtstrend vom niedrigsten Punkt aus, der während dieses Abwärtstrends erreicht wurde. Der Chandelier Exit verwendet ein Vielfaches der Average True Range (ATR) und addiert es zum tiefsten Stand seit dem Einstieg in den Handel. Es wird immer dann ein neuer Handel eröffnet, wenn der vorherige Handel ausgestoppt wird. Chandelier Stops

Eine der wichtigsten Regeln beim Handel lautet: Ziehen Sie Ihre Stopps nie so nach, dass sich Ihr Risiko erhöht. Unsere Stopp-Sequenz zeigt die automatische Verschärfung der Stopps. Sie erscheinen als eine Reihe von Punkten mit abnehmendem Risiko, bis der Handel schließlich gestoppt wird.
Das Problem besteht darin, dass Sie den Stopp möglicherweise zu eng setzen, wenn Sie an einem anderen Punkt als dem Anfangspunkt der Sequenz einsteigen. Stop-Entry-Diagramme zeigen Ihnen den Anfangswert für den

Der Elder-Ray besteht aus der Macht der Bullen und der Macht der Bären , wie im Buch "Come into my Trading Room" beschrieben. Er verfolgt die relative Macht der Bullen und Bären, indem er misst, wie weit sich das Hoch und das Tief eines jeden Balkens vom Durchschnittspreis entfernen. Elder-ray ist ein von Dr. Elder entwickelter Indikator, der seinen Namen aufgrund seiner Ähnlichkeit mit Röntgenstrahlen erhielt. Er zeigt die Struktur der bullischen und bärischen Kräfte unter der Oberfläche der Mä

Der MACD XOver-Indikator wurde von John Bruns entwickelt, um den Preispunkt vorherzusagen, an dem das MACD-Histogramm die Richtung seiner Steigung umkehren wird.
Der Indikator wird einen Tag in die Zukunft gezeichnet, so dass Sie, wenn Ihre Strategie vom MACD-Histogramm abhängt, dessen Umkehrpunkt für morgen (oder den nächsten Balken in einem beliebigen Zeitrahmen) vorhersagen können. Wenn der morgige Schlusskurs über dem Wert dieses Indikators liegt, wird das MACD-Histogramm nach oben ticken. W

Das Marktthermometer, das im Buch "Come into my Trading Room" beschrieben wird, misst den Grad der Volatilität, der sich in größeren oder kleineren Schwankungen innerhalb eines Tages widerspiegelt. Wenn die Markttemperatur über ihren Durchschnitt hinausgeht oder für eine Reihe von Tagen unter ihrem Durchschnitt bleibt, gibt es Handelssignale, wie im Buch beschrieben. Parameter: Thermometer_EMA_Length (22) - Die Länge des gleitenden Durchschnitts der Markttemperatur. Der Standardwert 22, die durc

SafeZone ist eine Methode zur Festlegung von Stopps auf der Grundlage der jüngsten Volatilität, außerhalb des Marktrauschens. Sie wird im Buch "Come into my Trading Room" beschrieben. In einem Aufwärtstrend definiert SafeZone das Rauschen als den Teil des aktuellen Balkens, der unter dem Tiefpunkt des vorhergehenden Balkens liegt und gegen den vorherrschenden Trend geht. Es bildet den Durchschnitt des Rauschpegels über einen bestimmten Zeitraum und multipliziert ihn mit einem vom Händler gewählt

Eine der wichtigsten Regeln beim Handel lautet: Ziehen Sie Ihre Stopps niemals so nach, dass sich Ihr Risiko erhöht. Unsere Stopp-Sequenz zeigt die automatische Verschärfung der Stopps. Sie erscheinen als eine Reihe von Punkten mit abnehmendem Risiko, bis der Handel schließlich gestoppt wird.
Das Problem besteht darin, dass Sie den Stopp möglicherweise zu eng setzen, wenn Sie an einem anderen Punkt als dem Anfangspunkt der Sequenz einsteigen. Stop-Entry-Diagramme zeigen Ihnen den Anfangswert fü

SafeZone ist eine Methode zum Setzen von Stopps auf der Grundlage der jüngsten Volatilität, außerhalb des Marktrauschens. Sie wird im Buch "Come into my Trading Room" beschrieben.
In einem Abwärtstrend definiert SafeZone das Rauschen als den Teil des aktuellen Balkens, der über das Hoch des vorherigen Balkens hinausgeht, entgegen dem Abwärtstrend. Es bildet den Durchschnitt des Rauschpegels über einen bestimmten Zeitraum und multipliziert ihn mit einem vom Händler gewählten Faktor. Bei Short-Tr

Eine der wichtigsten Regeln beim Handel lautet: Ziehen Sie Ihre Stopps nie so nach, dass sich Ihr Risiko erhöht. Unsere Stopp-Sequenz zeigt die automatische Verschärfung der Stopps. Sie erscheinen als eine Reihe von Punkten mit abnehmendem Risiko, bis der Handel schließlich gestoppt wird.
Das Problem besteht darin, dass Sie den Stopp möglicherweise zu eng setzen, wenn Sie an einem anderen Punkt als dem Anfangspunkt der Sequenz einsteigen. Stop-Entry-Diagramme zeigen Ihnen den Anfangswert für de

Der Smoothed ROC-Indikator wurde von Fred Schutzman entwickelt und wird im Buch "Trading for a Living" beschrieben. Er wird durch Berechnung der Änderungsrate eines exponentiellen gleitenden Durchschnitts der Schlusskurse erstellt. Wenn er seine Richtung ändert, hilft er bei der Erkennung und Bestätigung von Trendänderungen. Parameter Smoothing_EMA_Length (13) - Die Länge des für die Glättung verwendeten EMA; ROC_Period (21) - Die Länge der Berechnung der Änderungsrate.

Der Reverse-Bar-Indikator malt die Umkehrbalken gemäß der Handelsstrategie, die von Bill Williams in "Trading Chaos. Maximize Profits with Proven Technical Techniques" beschreibt. Der bärische Umkehrbalken hat eine rote oder rosa Farbe (rotes Signal - stärkeres Signal) Der bullishe Umkehrbalken hat eine blaue oder hellblaue Farbe (blau - stärkeres Signal) Es wird empfohlen, ihn auf dem stündlichen Zeitrahmen (H1) und höher zu verwenden.
Dieser Scalper-Indikator zeigt die Momente, in denen Sie mit einem Risiko von nur 2 Punkten sicher 10 Punkte Gewinn erzielen können. Es ermöglicht eine deutliche Erhöhung der Einzahlung im Laufe des Tages, wenn das richtige Geldmanagement verwendet wird.
Der Indikator hat nur einen Eingabeparameter – die Anzahl der Balken, die für die Berechnung des Trends verwendet werden.
Wenn das Signal erscheint, platzieren Sie eine ausstehende Bestellung zum Preis, der 2 Punkte höher als der aktuelle Prei
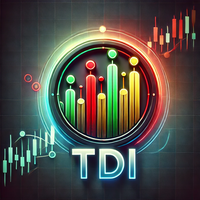
Traders Dynamic Index (TDI) - Übersicht Der Traders Dynamic Index (TDI) ist ein vielseitiger Indikator, der auf dem RSI-Oszillator basiert.
Er hilft Tradern, Marktbedingungen und potenzielle Umkehrungen zu identifizieren.
Der TDI kombiniert mehrere Indikatoren in einem und bietet eine umfassende Sicht auf die Marktdynamik. Komponenten: Grüne Linie: RSI-Preislinie Rote Linie: Handelssignallinie Blaue Füllung: Volatilitätsband Gelbe Linie: Markt-Basislinie Visuelle Signale: Trendrichtung: Kurzfris

Dies ist ein Trendindikator, wie Sie hier sehen können. Wenn die weiße Linie oberhalb der roten Linie liegt, bedeutet dies einen Bullenmarkt. Umgekehrt ist die weiße Linie unterhalb der roten Linie ein Bärenmarkt. Dieser Index eignet sich für den langfristigen Handel und ist für die meisten Handelsarten geeignet. --------------------------------------------------------------------------------------------

Mit diesem Indikator kann der Benutzer Kauf-/Verkaufssignale klar erkennen. Wenn ein Balken geschlossen wird und die Bedingungen erfüllt sind, erscheint ein Pfeilsignal am Schlusskurs, oben ist Kauf und unten ist Verkauf. Er funktioniert auf allen Timeframes. Und Sie können einen akustischen Alarm einstellen, wenn Signale auftauchen.

Dieser Indikator basiert auf einem klassischen gleitenden Durchschnittsindikator . Gleitende Durchschnitte helfen uns erstens, den Trend zu definieren und zweitens, Veränderungen im Trend zu erkennen. Der Multi TimeFrame-Indikator MTF-MA zeigt MA-Daten aus den 4 von Ihnen gewählten Zeitrahmen an. Standardmäßig hat dieser Indikator externe Parameter: TF1 = 1; TimeFrame2b = wahr; TF2 = 5; TimeFrame3b = wahr; TF3 = 15; TimeFrame4b = wahr; TF4 = 60; InpPSARStep = 0,02; InpPSARMMaximum = 0,2; Sie kön

Dieser Indikator basiert auf einem klassischen Commodity Channel Index (CCI) Indikator. Der Multi TimeFrame-Indikator MTF-CCI zeigt CCI-Daten aus den 4 von Ihnen gewählten Zeitrahmen an. Standardmäßig hat dieser Indikator externe Parameter: TF1 = 1; TimeFrame2b = wahr; TF2 = 5; TimeFrame3b = wahr; TF3 = 15; TimeFrame4b = wahr; TF4 = 60; InpPeriod = 13; InpPRICE = 5; Sie können TF1-TF4 in den nächsten Grenzen ändern: TF1 von M1 (1) bis H4 (240) TF2 von M5 (5) auf D1 (1440) TF3 von M15 (15) nach W
Dieser Indikator basiert auf einem klassischen Momentum-Indikator . Der Multi TimeFrame-Indikator MTF-Momentum zeigt Daten aus den 4 Timeframes Ihrer Wahl an. Standardmäßig hat dieser Indikator externe Parameter: TF1 = 1; TimeFrame2b = wahr; TF2 = 5; TimeFrame3b = wahr; TF3 = 15; TimeFrame4b = wahr; TF4 = 60; InpPeriod = 14; InpappPRICE = 0; Sie können TF1-TF4 in den nächsten Grenzen ändern: TF1 von M1 (1) bis H4 (240) TF2 von M5 (5) auf D1 (1440) TF3 von M15 (15) nach W1 (10080) TF4 von M30 (30

Dieser Indikator zeigt das Pin-Bar-Kerzenmuster auf dem Chart an.
Die bärischen Pin Bars haben eine rote Farbe, die bullischen Pin Bars haben eine blaue Farbe. Der Indikator zeigt einen Alarm an, wenn sich ein Pin Bar Candlestick-Muster bildet. Es wird empfohlen, ihn auf den Zeitrahmen H1 und höher zu verwenden. Der beste Zeitpunkt (starkes Signal) ist, wenn sich der Pin Bar in der Nähe des Unterstützungs-/Widerstandsniveaus bildet.
Diese Version von Stochastic bewertet die Wahrscheinlichkeit, den angegebenen Gewinn in Punkten mitzunehmen. Der entsprechende Wert wird in den Parametern eingestellt, und das Produkt zeigt automatisch mögliche Optionen für den Markt an, auf den es gerade angewendet wird. Es gibt viel mehr Optionen und die Informationen sind umfangreicher als bei der herkömmlichen Stochastik (siehe die Screenshots). Signale: Der gelbe Kanal ist nicht vorhanden (flache Bewegung, Markteinstieg wird nicht empfohlen

Spearman-Rank-Korrelationsindikator mit erweiterten Einstiegs- und Umkehrsignalen Jede überkaufte oder überverkaufte Zone kann mit Hilfe von Cross-Buy- oder Cross-Sell-Levels angepasst werden (Option 1 = true; Cross-Buy und Cross-Sell werden vom Benutzer eingestellt, wenn Option 1 = false, bedeutet dies, dass diese Option der Signalerzeugung nicht anwendbar ist). Die Signale können durch das Überschreiten der 0-Ebene generiert werden, dies ist Option 2. Bitte beachten Sie, dass diese Option nich
Der volumengewichtete gleitende Durchschnitt (VW-MA) ist ein nach Volumen gewichteter gleitender Durchschnitt.
Standardmäßige gleitende Durchschnitte verwenden Preise und ignorieren einfach gehandelte Volumina. Darauf reagiert der volumengewichtete gleitende Durchschnitt.
Beachten Sie, dass der Devisenmarkt im Gegensatz zum Aktienmarkt nicht zentralisiert ist. Orders und Volumina werden nicht zwischen Brokern geteilt. Folglich hängen die im volumengewichteten gleitenden Durchschnitt verwendet

Volumengewichteter MACD Der volumengewichtete MACD (VW-MACD) wurde von Buff Dormeier erstellt und in seinem Buch Investieren mit Volumenanalyse beschrieben. Er repräsentiert die Konvergenz und Divergenz volumengewichteter Preistrends.
Durch die Einbeziehung des Volumens ist der VW-MACD im Allgemeinen reaktionsschneller und zuverlässiger als der traditionelle MACD.
Was ist MACD (Moving Average Convergence Divergence)?
Moving Average Convergence Divergence wurde 1979 von Gerald Appel entwic

Dieser Indikator wird verwendet, um die relative Stärke des Handels auf dem Chart mit den anderen ausgewählten Symbolen zu vergleichen.
Durch den Vergleich der Kursbewegung jeder gehandelten Sorte auf der Grundlage desselben Basistages werden mehrere Trendlinien unterschiedlicher Richtungen sichtbar, die die starke und schwache Beziehung zwischen den verschiedenen gehandelten Sorten widerspiegeln, so dass wir ein klareres Verständnis des Markttrends erhalten. Sie können diesen Indikator beispie
Tails ist ein Indikator, der vorhersagt, wo der Kurs in einer Tageskerze abprallen und ankommen wird. Dieser Indikator wird nicht neu gezeichnet und sollte in Zeitrahmen unter D1 verwendet werden. Standardmäßig zeichnet der Indikator zwei Unterstützungs- und zwei Widerstandslinien ein. Bei Bedarf können Sie die erweiterten Ebenen auf "true" setzen, um drei Unterstützungs- und drei Widerstandslinien anzuzeigen. Eingabeparameter Extended_Levels - zeigt erweiterte Levels im Chart an; Clr_Support -

Der Indikator zeigt das Candlestick-Modell "Drei weiße Soldaten und drei schwarze Krähen" auf einem Chart an. Drei weiße Soldaten sind blau eingefärbt. Drei schwarze Krähen sind rot eingefärbt. Eingabeparameter: Max Bars - maximale Anzahl von Bars, die auf dem Chart berechnet werden. Make Signal Alert - Warnung verwenden. Art der Musterregeln - verwenden Sie ein strenges Modell zur Bestimmung des Musters (kurze untere Schatten für die drei Soldaten, kurze obere Schatten für die drei Krähen), ode

Sie haben soeben eine Position eröffnet und der Kurs ist stark in die andere Richtung gegangen... Was tun? Einfach geduldig sein, aussteigen oder stoppen (schließen) und wieder einsteigen, aber schon in die entgegengesetzte Richtung? Was tun... oder vielleicht einfach den Rahm abschöpfen und auf Umkehrimpulse handeln .... wird Ihnen helfen und Sie beraten. Trend- und Umkehrindikator auf Basis der ReversMartinTral Expert Advisor Mustersammlung https://www.mql5.com/ru/market/product/28761.
der

Wenn Sie den Wunsch haben, eine Bewegung, einen Ausbruch bei höchster Volatilität zu handeln, oder einen Expert Advisor-Mediator zu betreiben, um in einem ruhigen Hafen mit niedriger Volatilität seitwärts zu handeln, dann ist dieses Produkt für Sie! Der Indikator analysiert 28 Währungspaare (Haupt- und Nebenwährungen) und zeigt je nach den gewählten Einstellungen die höchste Volatilität (max) oder umgekehrt (min) an. Wie kann man die Volatilität messen? Es gibt 2 Möglichkeiten. Die erste best

Der Indikator zeigt die Muster "Morgenstern" und "Abendstern" in einem Diagramm an.
Der Abendstern wird in Rot oder Rosa angezeigt. Der Morgenstern wird in blau oder hellblau angezeigt.
Eingabeparameter: Max Bars - Anzahl der im Chart berechneten Bars. Make Signal Alert - Alarme verwenden. Push-Benachrichtigung senden - Benachrichtigung an ein mobiles Endgerät senden Typ des Regelmusters - Typ des Modells der Musterbestimmung (Hard - mit der Kontrolle der Länge des Schattens des zweiten Balken

Der Indikator zeigt die Dynamik der Bildung der täglichen Spanne in Form eines Histogramms und die durchschnittliche tägliche Spanne für einen bestimmten Zeitraum an. Der Indikator ist ein nützliches Hilfsmittel für den Intraday-Handel.
Einstellungen N Tag - Zeitraum für die Berechnung des täglichen Range-Wertes. Stufe Unbestimmt - Stufe der Unbestimmtheit. Stufe Konfidenz - Grad der Konfidenz. Level Alert - Alarmstufe. Wenn sie überschritten wird, erscheint der Alarm.

Der Hauptzweck des Indikators ist die Erkennung und Markierung von Handelssignalen auf dem Histogramm des Awesome Oscillator gemäß den Strategien "Trading Chaos, zweite Auflage" und "New Trading Dimensions". Der Indikator erkennt und markiert die folgenden Handelssignale: "Zwei Spitzen" - Divergenz. Das Signal "Second wise-man" - dritter konsequenter Balken des Awesome Oscillators, nachdem seine Farbe geändert wurde. Das Histogramm kreuzt die Nulllinie. Das Signal "Untertasse". Der Indikator ent
Der Twiggs Money Flow Index wurde von Collin Twiggs erstellt. Er wird vom Chaikin Money Flow Index abgeleitet, verwendet jedoch True Ranges anstelle von Hochs minus Tiefs, um Spitzen aufgrund von Kurslücken zu vermeiden. Es verwendet auch einen glättenden exponentiellen gleitenden Durchschnitt, um zu verhindern, dass Volumenspitzen die Ergebnisse verändern. Der exponentielle gleitende Durchschnitt wird von Welles Wilder für viele seiner Indikatoren beschrieben.
Wenn der Twiggs Money Flow Index
Der Money Flow Index ist ein Indikator für mehrere Zeitrahmen, der den Money Flow Index eines beliebigen Zeitrahmens anzeigt.
Es hilft Ihnen, sich auf den langfristigen Geldfluss zu konzentrieren, bevor Sie den Geldfluss des aktuellen Zeitrahmens verwenden.
Sie können beliebig viele Money Flow Index - Mehrere Zeitrahmen hinzufügen. Sehen Sie sich die Screenshots an, um beispielsweise die M30 / H1 / H4 Money Flow-Indizes im selben Fenster zu sehen.

TTMM - "Time To Make Money" - Zeit, in der Trader an den Börsen Geld verdienen Der Indikator ТТММ Handelssitzungen zeigt die folgenden Informationen an: Handelssitzungen: Amerikanisch, europäisch, asiatisch und pazifisch. (Hinweis: Die Sitzungen werden nur für die letzten fünf Tage und den aktuellen Tag angezeigt. Die Anzahl der Tage kann sich je nach den Feiertagen ändern - sie werden in den Terminals nicht angezeigt. Die Sitzungen werden auch nicht am Samstag und Sonntag angezeigt). Die Haupth

Das professionelle Tool für Aktienhändler ist jetzt auf MetaTrader 5 verfügbar. Der Chart-Indikator Actual depth of market visualisiert die Markttiefe in Form eines Histogramms, das auf einem Chart angezeigt wird, der sich in Echtzeit aktualisiert. Treffen Sie auf neue Aktualisierungen entsprechend den Benutzerwünschen!
Jetzt zeigt der Indikator Actual Depth of Market das aktuelle Verhältnis des Volumens der Kauf- und Verkaufsanfragen (B/S ratio) an. Er zeigt den Anteil des Volumens jeder Art v

ACPD - "Auto Candlestick Patterns Detected" - Der Indikator zur automatischen Erkennung von Candlestick-Mustern. Der Indikator für Candlestick-Muster ACPD ist in der Lage: 40 Umkehr-Candlestick-Muster zu ermitteln . Jedes Signal wird mit einem Pfeil angezeigt, wobei die Richtung des Pfeils die voraussichtliche Bewegungsrichtung des Charts angibt. Jede Beschriftung eines Musters gibt an: seinen Namen , die Stärke des Signals "S" (berechnet in Prozent mit Hilfe einer empirischen Formel), die anzei

AABB - Active Analyzer Bulls and Bears wurde entwickelt, um anzuzeigen, inwieweit eine Kerze bullish oder bearish ist. Der Indikator zeigt gute Ergebnisse auf dem EURUSD H4 Chart mit den Standardeinstellungen. Die Strategie des Indikators Wenn die Indikatorlinie die 80%-Marke nach oben kreuzt, kaufen wir. Wenn die Linie des Indikators die 20%-Marke nach unten kreuzt, verkaufen wir. Es ist wichtig, zu kaufen oder zu verkaufen, wenn sich eine Signalkerze bildet. Sie sollten beim ersten Signal kauf
Der Envelopes-Indikator wird mit einem Tick-Chart gezeichnet. Nach dem Start warten Sie, bis genügend Ticks vorhanden sind. Parameter: Averaging period - Zeitraum der Mittelwertbildung. Glättungsart - Art der Glättung. Kann beliebige Werte aus der Aufzählung ENUM_MA_METHOD haben. Optionspreise - zu verwendender Preis. Kann Ask, Bid oder (Ask+Bid)/2 sein. Abweichung der Grenzen von der Mittellinie (in Prozenten) - Abweichung von der Hauptlinie in Prozent. Anzahl der Kursniveaus - Anzahl der angez

Der Relative-Stärke-Index-Indikator wird in einem Tick-Chart gezeichnet. Nach dem Start warten Sie, bis genügend Ticks vorhanden sind. Parameter: RSI Periode - Periode der Mittelwertbildung. overbuying level - überkauftes Niveau. überverkauftes Niveau - überverkauftes Niveau. Berechnete Balken - Anzahl der Balken auf dem Chart für die Berechnung des Indikators. Die folgenden Parameter sind für die Einstellung der Gewichtung der RSI-Signale (von 0 bis 100) bestimmt. Ihre Beschreibung finden Sie i
Der Average Directional Movement Index-Indikator wird mit Hilfe eines Tick-Charts gezeichnet. Nach dem Start warten Sie, bis genügend Ticks vorhanden sind. Parameter: Periode - Periode der Mittelwertbildung. Berechneter Balken - Anzahl der Balken auf dem Chart für die Berechnung des Indikators. Pufferindizes: 0 - MAIN_LINE, 1 - PLUSDI_LINE, 2 - MINUSDI_LINE.
Der Indikator Moving Average Convergence/Divergence (MACD) wird in einem Tick-Chart gezeichnet. Warten Sie nach dem Starten, bis genügend Ticks vorhanden sind. Parameter: Schnelle EMA-Periode - Indikator wird in einem Tick-Chart gezeichnet. Langsame EMA-Periode - langsame Periode der Mittelwertbildung. Signal SMA Periode - Periode der Mittelwertbildung der Signallinie. Berechneter Balken - Anzahl der Balken im Chart für die Berechnung des Indikators. Die folgenden Parameter dienen zur Einstellun
Der Stochastik-Oszillator wird auf dem Tick-Preis-Chart eingezeichnet. Warten Sie nach dem Starten, bis genügend Ticks vorhanden sind. Parameter: K-Periode - Anzahl der einzelnen Perioden, die für die Berechnung des stochastischen Oszillators verwendet werden; D-Periode - Anzahl der einzelnen Perioden, die für die Berechnung der Linie des gleitenden Durchschnitts %K verwendet werden; Verlangsamung - Periode der Verlangsamung von %K; Berechneter Balken - Anzahl der Balken im Diagramm für die Bere
Der Indikator Commodity Channel Index (CCI) wird in einem Tick-Chart gezeichnet. Nach dem Start warten Sie, bis genügend Ticks vorhanden sind. Parameter: period - Anzahl der einzelnen Perioden, die für die Berechnung des Indikators verwendet werden. Berechneter Balken - Anzahl der Balken für die Berechnung des Indikators. Die folgenden Parameter sind für die Einstellung der Gewichtung der CCI-Signale (von 0 bis 100) bestimmt. Ihre Beschreibung finden Sie in der Sektion Signale des Commodity Chan
Der Indikator Gleitender Durchschnitt des Oszillators (OsMA) wird in einem Tick-Chart gezeichnet. Nach dem Start warten Sie, bis genügend Ticks vorhanden sind. Parameter: Schnelle EMA-Periode - schnelle Periode der Mittelwertbildung. Langsame EMA-Periode - langsame Periode der Mittelwertbildung. Signal SMA Periode - Periode der Mittelwertbildung der Signallinie. Berechneter Balken - Anzahl der Balken für die Berechnung des Indikators.
Der Indikator Standardabweichung (StdDev) wird in einem Tick-Chart dargestellt. Nach dem Start warten Sie, bis genügend Ticks vorhanden sind. Parameter: Periode - Zeitraum der Mittelwertbildung. Methode - Methode der Mittelwertbildung. Berechnete Balken - Anzahl der Balken für die Berechnung des Indikators.

Dieser Indikator wird verwendet, um die relative Stärke des Handels auf dem Chart mit den beiden anderen ausgewählten Symbolen zu vergleichen. Durch den Vergleich der Kursbewegung jeder gehandelten Sorte auf der Grundlage desselben Basistages werden drei Trendlinien mit unterschiedlichen Richtungen sichtbar, die die starke und schwache Beziehung zwischen den drei verschiedenen gehandelten Sorten widerspiegeln, so dass wir ein klareres Verständnis des Markttrends erhalten. Sie können diesen Indik

Der Momentum-Indikator wird in einem Tick-Chart gezeichnet. Nach dem Start warten Sie, bis genügend Ticks vorhanden sind. Parameter: period - Periode der Berechnung des Indikators. Anzahl der Levels - Anzahl der angezeigten Levels (bei einem Wert von 0 werden keine Levels angezeigt) calculated bar - Anzahl der Balken für die Berechnung des Indikators.

Die meiste Zeit befindet sich der Markt in einer kleinen Schwingungsamplitude. Der Trade Area-Indikator hilft dem Benutzer, diese Zeit zu erkennen. Es gibt 5 Linien in diesem Indikator: Area_high, Area_middle, Area_Low, SL_high und SL_low. Empfehlungen: Wenn der Preis zwischen Area_high und Area_Low liegt, ist es Zeit zu handeln. Kaufen Sie auf Area_Low-Niveau und verkaufen Sie auf Area_high-Niveau. Die Linien SL_high und SL_low sind die Niveaus für den Stop Loss. Ändern Sie den Parameter Deviat

Dieser Indikator wird verwendet, um die Differenz zwischen dem höchsten und dem niedrigsten Kurs der K-Linie sowie die Differenz zwischen dem Schlusskurs und dem Eröffnungskurs anzuzeigen, so dass die Händler die Länge der K-Linie visuell erkennen können. Die obere Zahl ist die Differenz zwischen Höchst- und Tiefstkurs, die untere Zahl ist die Differenz zwischen Schluss- und Eröffnungskurs. Dieser Indikator bietet eine Filterfunktion, und die Benutzer können nur K-Linien auswählen, die den Krite
Der Bulls-Power-Indikator wird mit Hilfe eines Tick-Charts gezeichnet. Nach dem Start warten Sie, bis genügend Ticks vorhanden sind. Parameter: Periode - Periode der Mittelwertbildung. Anzahl der Ticks zur Bestimmung von Hoch/Tief - Anzahl der einzelnen Ticks zur Bestimmung von Hoch/Tief. Berechneter Balken - Anzahl der Balken für die Berechnung des Indikators. Die folgenden Parameter sind für die Einstellung der Gewichtung der Bulls-Power-Signale bestimmt (von 0 bis 100). Ihre Beschreibung find
Der Bears Power-Indikator wird mit einem Tick-Chart gezeichnet. Nach dem Start warten Sie, bis genügend Ticks vorhanden sind. Parameter: Periode - Periode der Mittelwertbildung. Anzahl der Ticks zur Bestimmung von Hoch/Tief - Anzahl der einzelnen Ticks zur Bestimmung von Hoch/Tief. Berechneter Balken - Anzahl der Balken für die Berechnung des Indikators. Die folgenden Parameter sind für die Einstellung der Gewichtung der Signale von Bears Power bestimmt (von 0 bis 100). Ihre Beschreibung finden
DWMACD - Divergenzwelle MACD . Der Indikator zeigt Divergenzen an, indem er die Farbe des MACD-Histogramms ändert. Der Indikator ist einfach zu bedienen und zu konfigurieren. Für die Berechnung können eine Signallinie oder die Werte des Standard-MACD-Histogramms verwendet werden. Sie können die Berechnung über den Parameter UsedLine ändern. Es ist ratsam, eine Signallinie für die Berechnung zu verwenden, wenn das Histogramm häufig die Richtung ändert und kleine Werte aufweist, die eine Art Flat
Der Heiken Ashi-Indikator wird mit einem Tick-Chart gezeichnet. Er zeichnet synthetische Candlesticks, die eine bestimmte Anzahl von Ticks enthalten. Parameter: Optionspreise - Preis der Option. Er kann Bid, Ask oder (Ask+Bid)/2 sein. Anzahl der zu identifizierenden Ticks Bar - Anzahl der Ticks, die Candlesticks bilden. Anzahl der Kursniveaus - Anzahl der angezeigten Kursniveaus (es werden keine Niveaus angezeigt, wenn sie auf 0 oder einen niedrigeren Wert eingestellt sind). Berechnete Balken -
MetaTrader Market bietet jedem Entwickler eine einfache und bequeme Plattform für den Verkauf von Programmen.
Wir unterstützen Sie bei der Veröffentlichung des Produkts und beraten Sie gerne, wie man eine Beschreibung für den Market vorbereitet. Alle Produkte, die im Market verkauft werden, sind durch eine zusätzliche Verschlüsselung geschützt und können nur auf dem Rechner des Kunden gestartet werden. Illegales Kopieren ist ausgeschlossen.
Sie verpassen Handelsmöglichkeiten:
- Freie Handelsapplikationen
- Über 8.000 Signale zum Kopieren
- Wirtschaftsnachrichten für die Lage an den Finanzmärkte
Registrierung
Einloggen
Wenn Sie kein Benutzerkonto haben, registrieren Sie sich
Erlauben Sie die Verwendung von Cookies, um sich auf der Website MQL5.com anzumelden.
Bitte aktivieren Sie die notwendige Einstellung in Ihrem Browser, da Sie sich sonst nicht einloggen können.