Guarda i video tutorial del Market su YouTube
Come acquistare un Robot di Trading o un indicatore
Esegui il tuo EA
hosting virtuale
hosting virtuale
Prova un indicatore/robot di trading prima di acquistarlo
Vuoi guadagnare nel Market?
Come presentare un prodotto per venderlo con successo
Indicatori tecnici per MetaTrader 4 - 22

The indicator searches for and displays Doji candlesticks on the chart and signals the appearance of such a candle. The direction of the signal depends on the direction of the previous candles, as the Doji signals a reversal or correction. In addition to the possibility of signaling, the power of the reversal is graphically shown (the more green, the more likely growth, the more red, the price will fall). In the indicator settings, you can change the parameters of the Doji candlestick, the closu
FREE

The Donchian channel is an indicator that takes a series of user-defined periods and calculates the upper and lower bands. Draw two lines on the graph according to the Donchian channel formula. This straightforward formula is based on:
The top line is the highest price for the last periods n The bottom line is the lowest price for the last periods n
Trend systems follow periods when support and resistance levels are broken. in this case when the price breaks the upper line or the lower line o
FREE

Indicator overview Trend indicator usage Moving averages. Highest quality alerts that need no introduction. It is completely loyal to the original algorithm and uses other useful features.
Easy to trade Carry out all kinds of notifications It's not a new paint and it's not a back paint. Setting Indicator SMA50 in Time frame H1 for any pair currency and Gold Spot. EMA200 in Time frame H1 for any pair currency and more than EMA250 for Gold spot. Using it for maximum benefit Set up notification
FREE

Session Killzone Indicator
Indicator that helps you to identify the killzone times of both London and NewYork sessions which usually is the most times for high volatility and taking liquidity from the market. Killzone times are configurable through indicator parameters. The indicator adjusts the range of the killzones based on the daily trading range.
FREE

The free version of the Hi Low Last Day MT4 indicator . The Hi Low Levels Last Day MT4 indicator shows the high and low of the last trading day . The ability to change the color of the lines is available . Try the full version of the Hi Low Last Day MT4 indicator , in which additional indicator features are available : Displaying the minimum and maximum of the second last day Displaying the minimum and maximum of the previous week Sound alert when crossing max . and min . levels Selecting an arb
FREE
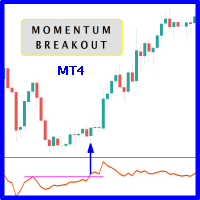
When prices breakout resistance levels are combined with momentum oscillator breaks out its historical resistance levels then probability emerges to record farther prices. It's strongly encouraged to confirm price breakout with oscillator breakout since they have comparable effects to price breaking support and resistance levels; surely, short trades will have the same perception. Concept is based on find swing levels which based on number of bars by each side to confirm peak or trough and in tu
FREE

Volume Footprint Analysis is a precision-engineered, volume-based indicator that transforms raw market volume into an intuitive, color-coded signal system. Built on concepts from Volume Spread Analysis (VSA) and Smart Money principles, this tool removes the guesswork from volume interpretation and gives traders clear, actionable insights on when to buy or sell — on any timeframe and across any trading instrument. MT5 Version - https://www.mql5.com/en/market/product/138565/ Join To Learn Mark
Drawdown Alerts Free ! Meta Trader 4 Indicator. Please leave a review about this product to help other users benefit from it. This Drawdown Alerts indicator shows the drawdown percentage in real time and alerts you when the limit you specify is reached. Calculation of drawdown depends on the amount of the trade balance. You can customize Drawdown Alerts for Corner - Left , Right , Up , Down X Y Color Number of decimal digits Popup messages and sound - Turn on / off notifications Notification
FREE

The Fibonacci indicator automatically displays the Fibonacci retracement levels, representing significant support and resistance. The range for calculating the indicator can be taken from the previous day, week, month, year or user-specified session.
Levels 100 % (High) of the range from the previous session. 0 % (Low) of the range from the previous session. 76,4 % of the range from the previous session. 61,8 % of the range from the previous session. 50 % of the range from the previou
FREE
Rimani al passo con il momentum del mercato con il Pip Movement Alert MT4, un indicatore versatile a più valute progettato per tracciare e avvisare i trader sui movimenti precisi in pip su più simboli, ideale per il trading di forex, azioni, criptovalute e materie prime. Elogiato nelle comunità di trading come Forex Factory e Reddit’s r/Forex, e evidenziato nelle discussioni su Investopedia e TradingView per la sua capacità di rilevare cambiamenti improvvisi del mercato, questo indicatore è indi
FREE

What is the Super Ichi Indicator? Super Ichi is an advanced combination of Ichimoku Kinko Hyo and SuperTrend indicators. This powerful technical analysis tool is designed to identify market trends and generate trading signals. What Does It Do? Dual-Level Trend Analysis : Uses customized versions of Tenkan-sen and Kijun-sen lines Automatic Signal Generation : Displays visual markers (arrows) at crossover points Real-Time Alert System : Provides audio and visual alerts when new signals occur Dynam
FREE

CYCLE WAVE OSCILLATOR indicator is an indicator based on cyclical price fluctuations. This indicator can help you determine overbought and oversold levels, and help you predict price trends within the cycle. MT5 Version here! You can combine it with our indicators below to make your trading decisions more accurate: Supply Demand Ribbon MT4 Basic
Feature: - Three Trend Types: + Zero + Basic + Advanced
FREE

Migliora la precisione del tuo trading con Sessioni di trading WH MT4 indicatore per MetaTrader 4! Questo potente strumento ti aiuta a visualizzare e gestire le sessioni di mercato chiave senza sforzo. Basato su: WH SMC Indicatore MT4
Versione MT5: Sessioni di trading WH MT5 Caratteristiche principali: Pannello GUI interattivo – Seleziona e alterna facilmente tra Asia, Londra e New York sessioni di trading.
Avvisi e impostazioni personalizzabili – A
FREE

The indicator is based on the concept of price channels, which are formed by plotting the highest high and lowest low prices over a specified period of time. The Donchian Channel Indicator consists of three lines: an upper channel line, a lower channel line, and a middle channel line. The upper channel line represents the highest high over a specified period, while the lower channel line represents the lowest low. The middle channel line is the average of the two and can be used as a reference f
FREE

The indicator displays crossing zero level by Moving Average of Oscillator (OsMA) in the form of arrows. The indicator notifies about a signal by means of a pop-up Alert window, or sending notification to e-mail.
Parameters Fast EMA Period - fast EMA. This is an exponential moving average from a price with a short period. Slow EMA Period - slow EMA. This is also an exponential moving average of a market price but with a longer period. Signal SMA Period - MACD SMA. This is a signal line which is
FREE
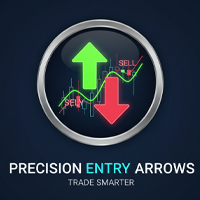
Precision Entry Arrows: Never Miss a High-Probability Trade Again! Stop guessing and start trading with confidence. The Precision Entry Arrows indicator is a sophisticated, all-in-one tool designed to deliver high-quality, non-repainting Buy and Sell signals directly on your chart. It expertly combines the power of MACD , Stochastic , and a unique EMA 5 Cross to pinpoint exact entry moments , then filters everything through a long-term EMA 200 to ensure you are always trading with the major tre
FREE

Unleash Your Trading Potential with the Golden Fractal Cross Are you tired of second-guessing your trades? Do you wish you had a clear, reliable system to guide your decisions? Introducing the Golden Fractal Cross —a powerful and user-friendly indicator designed to help you spot high-probability trading opportunities. This isn't just another average indicator; it's a complete strategy that combines the precision of fractal patterns with the dynamic power of Exponential Moving Averages (EMAs). Th
FREE

O Touch VWAP é um indicador que permite calcular uma Média Ponderada por Volume (VWAP) apenas apertando a tecla 'w' no seu teclado e após clicando no candle do qual deseja realizar o calculo, clicando abaixo do candle é calculada a VWAP baseado na minima dos preços com o volume, clicando sobre o corpo do candle é calculado uma VWAP sobre o preço medio com o volume e clicando acima do candle é calculado uma VWAP baseado na máxima dos preços com o volume, voce tambem tem a opção de remover a VWAP
FREE
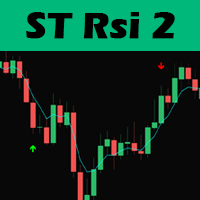
Hello traders, this trading strategy is based on the the Larry Connors RSI-2 strategy, We begin with a 200 periods EMA to find the direction of the market. This is important because we only trade in the main trend direction.
We then look for pull backs using the RSI with a period of 2 to get entry signals. Trades are then exited using the 5 EMA.
Lot size should be calculated using 1% of 1 the ATR value and positions can be added as long as the entry criterion is met.
TRADING IS RISKY AND I D
FREE

Scalping arrows not redraw - an indicator that shows price reversal points on the chart and does not redraw its signals. Also, the indicator sends signals to the trader via Email and Push. The accuracy of the signals of this indicator is approximately 92-94% on the M5 timeframe and more than 95% on the H1 timeframe. Thus, this indicator allows the trader to accurately open trades and predict further price movement. Price reversal points on the chart are indicated using simple and understandable

Spline Searcher MT5 — Indicatore multi-valuta per il rilevamento precoce di spline di prezzo e punti di interesse Strumento ausiliario per il rilevamento e la visualizzazione automatici delle fasi iniziali di formazioni complesse di prezzo. L’indicatore è destinato esclusivamente al trading manuale ed è adatto ai trader che sperimentano il rilevamento precoce di formazioni o trend di mercato più complessi, di cui possono far parte formazioni più semplici. Rileva fino a sei tipi di formazioni in
FREE

Channel Searcher MT5 — Indicatore multi-valuta per il rilevamento di canali di prezzo Strumento ausiliario per il rilevamento e la visualizzazione automatica di canali di prezzo basati su picchi frattali e analisi geometrica. L’indicatore è destinato esclusivamente al trading manuale ed è adatto ai trader che adottano un approccio strutturale al mercato. Identifica i canali in base a molteplici criteri: numero di tocchi, inclinazione, grado di riempimento, profondità della rottura e posizione r
FREE

High-Precision Volatility Notifier V1.10 Developed by: Grazia-system-com Title: Stop Chasing Volatility: Get Notified Only When the Real Breakout Starts. The professional, noise-filtered tool that transforms your MT4/MT5 into a smart, proactive monitoring system. Never miss an institutional-level move again. Why This Detector Is Different (Dual-Layered, Noise-Filtered Intelligence) Most volatility tools use fixed thresholds that fail in dynamic markets. Our Notifier eliminates false signals
FREE

Stop Chasing Trends, Start Sniping Reversals: Introducing Stochastic Sniper Are you tired of trading sideways markets or getting caught by false breakouts? The Stochastic Sniper indicator is engineered for precision entry . It combines the volatility channels of Keltner Bands with the momentum timing of the Stochastic Oscillator to pinpoint extreme price reversals with high accuracy. Think of it as having a sniper scope on the market. It waits for the price to stretch to its maximum, confirms t
FREE

After your purchase, feel free to contact me for more details on how to receive a bonus indicator called VFI, which pairs perfectly with Easy Breakout for enhanced confluence!
Easy Breakout is a powerful price action trading system built on one of the most popular and widely trusted strategies among traders: the Breakout strategy ! This indicator delivers crystal-clear Buy and Sell signals based on breakouts from key support and resistance zones. Unlike typical breakout indicators, it levera
ChartFix – Fixed Scale and Pan Chart Controls for MT4 ChartFix is a lightweight indicator that adds convenient on-chart navigation tools to MetaTrader 4. The controls are designed to offer a chart interaction style that creates an optional switch between MT4 default auto scale feature and a fixed scale chart that can be moved up and down and easily scaled vertically. Main Functions Zoom In / Zoom Out – Adjust the chart scale directly from on-screen buttons. Scale Mode Switch – Toggle between MT4

Donchian channels are a tool in technical analysis used to determine the relative volatility of a market and the potential for price breakouts.
Can help identify potential breakouts and reversals in price, which are the moments when traders are called on to make strategic decisions. These strategies can help you capitalize on price trends while having pre-defined entry and exit points to secure gains or limit losses. Using the Donchian channel can thus be part of a disciplined approach to managi
FREE

This indicator calculates Correlation among currency pairs (Selected by user) to find the least and/or most correlated symbols in real time. Correlation ranges from -100% to +100%, where -100% represents currencies moving in opposite directions (negative correlation) and +100% represents currencies moving in the same direction.
Note The Correlation more than 80 (Adjustable) between two currency pairs, Shows that they are quite similar in the kind of movement and side. The Correlation less than

If you trade or wish to trade the popular HLHB Trend-Catcher System, then this indicator is for you! It detects when the HLHB system entry rules are met and sends out an alert in the form of notifications to your mobile phone and to your pc. By automatically sending you notifications, this indicator lessens your trading work load as you don't have to sit in from of your pc all day checking all the chats for when the entry rules are met. This indicator does all the dirty work for you. When the si
FREE

Fibonacci SR Indicator
This indicator creates support and resistance lines. This indicator is based on Fibonacci Retracement and Extension levels. It will consider many combinations of the Fibonacci levels and draw support/resistance lines based on these. This indicator uses tops and bottoms drawn by the ZigZag indicator in its calculations. The ZigZag can also be drawn on the chart, if necessary. The indicator considers many combinations of past reversal points and Fibonacci ratio levels, and w
FREE

Highlights trading sessions on the chart
The demo version only works on the AUDNZD chart!!! The full version of the product is available at: (*** to be added ***)
Trading Session Indicator displays the starts and ends of four trading sessions: Pacific, Asian, European and American. the ability to customize the start/end of sessions; the ability to display only selected sessions; works on M1-H2 timeframes;
The following parameters can be configured in the indicator:
TIME_CORRECTION = Correct
FREE

Advanced Renko & Point & Figure Indicator with Win/Loss Pattern Analysis This powerful indicator combines two proven strategies—Renko and Point & Figure (P&F)—into one comprehensive tool for trend identification, pattern recognition, and risk management. With dynamic Box Size calculation (Fixed or ATR-based), moving average filters, and win/loss pattern detection, traders can make smarter, data-driven decisions.
Key Features
Hybrid Renko + P&F System Renko: Noise-free price action with fixed
FREE

This indicator show candle time remaining. The remaining time of the candle is calculated every 200 milliseconds. 1. You can set x (horizontal), y (vertical) of text. 2. You can set font, color, size of text. 3. You can remove the text without having to remove the indicator from the chart. The remaining time of the candle depends on the timeframe of the chart with the indicator.
FREE

Volatility Limit Trend Indicator (VLT), an original indicator by this developer, is a trend indicator based on setting a fixed volatility limit as a percentage of price. Volatile price is allowed to wander between two channel lines defining the fixed volatility about a central line. The price crossing one of the channel lines defines an exceeding of the allowed volatility, and ushering in one of two situation : either a continuation or a reversal of trend. The first buffer of the indicator (not
FREE

APP System Signals è un indicatore tecnico progettato per gli utenti attivi nei mercati finanziari. Utilizza una combinazione di medie mobili esponenziali (EMA), medie mobili semplici (SMA) e analisi delle tendenze per generare segnali di acquisto e vendita basati sul comportamento storico dei prezzi e sulla struttura del mercato. Tutti i parametri sono completamente personalizzabili, permettendo agli utenti di adattarlo al proprio stile di analisi e approccio al trading. L'indicatore può essere
FREE
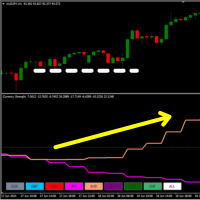
28 mercati in un unico indicatore! Sono disponibili 8 linee e ognuna rappresenta una valuta { EUR - USD - GBP - JPY - AUD - NZD - CAD - CHF }.
Cosa fa? Calcola un oscillatore personalizzato su tutte i 28 cambi del Forex e traccia la forza di ciascuna valuta. In questo modo è possibile analizzare la tendenza e la volatilità su multivaluta. Inoltre, cliccando su due valute diverse, il mercato cambia istantaneamente, quindi è molto utile per navigare i mercati valutari.
Come usarlo? È possibile
FREE

Features:
- Current TF GMMA Cross and Trend (Mandatory Check.. G-Up/G-Down) - HTF GMMA Trend Check (Optional.. slanting arrow) - TDI or NRTR Trend Check (Optional.. diamond)
Read post for detailed description and downloading extra indicators: https://www.mql5.com/en/blogs/post/758264
Scanner:
This is a Dashboard Scanner for finding good trades using the GMMA method as base and TDI method for trend verification. All buttons for all Pairs and Timeframes are clickable and will change the chart f

** All Symbols x All Timeframes scan just by pressing scanner button ** *** Contact me to send you instruction and add you in "ABCD scanner group" for sharing or seeing experiences with other users. Introduction This indicator scans AB=CD retracement patterns in all charts. The ABCD is the basic foundation for all harmonic patterns and highly repetitive with a high success rate . The ABCD Scanner indicator is a scanner reversal ABCD pattern that helps you identify when the price is about to ch

Hello, I need reviews from you guys. Thank you Fractal Swing Detector Pro Indicator is designed to help traders identify key swing points in the market . By combining fractal an d pivot analysis, this indicator provides deeper insights into price movements an d potential reversals. Key Features: Fractal Analysis: Identify high and low fractals with the option to use either 3 or 5 bar fractals . Fractals help detect minor reversal points within trends. Pivot Points: Advance d pivot
FREE
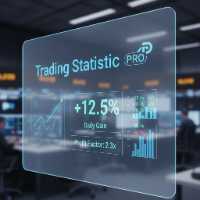
The statistical indicator for the metatrader 5 TradingStatisticPro collects statistical data on your trade, which makes it easier to assess the effectiveness of trading, the profit received and the risks. The indicator is compactly placed in the corner of the main chart of the terminal and displays the following information: 1. The profit earned. 2. Maximum drawdown. 3. The recovery factor. 4. Profit factor. 5. The ratio of profitable and unprofitable transactions (winrate). 6. Average profit a
FREE

Fractals ST Patterns is a modification of Bill Williams' Fractals indicator. Unlike a standard Fractals indicator, Fractals ST Patterns allows setting any number of bars to find a fractal. This simple indicator corresponds to the parameters specified in the ST Patterns Strategy ( https://stpatterns.com/ ) . Structural Target patterns are the market itself, which is consistently divided into components. For the formation of ST Patterns , no trend lines, geometric proportions of the model itself,
FREE

The indicator uses the Chester W. Keltner's channel calculation method, modified by the well-known trader Linda Raschke. Due to the modification, the calculated channel contains a much more complete overview of the price movements, which allows increasing the probability of an accurate prediction of the upcoming price movement. Unlike the classic Keltner method, the base line of the channel is plotted based on the Exponential Moving Average, and the Average True Range is used to calculate the up
FREE

What is a Point of Interest? Traders who follow Smart Money Concepts may call this a Liquidity Point, or where areas of liquidity have been built up by retail traders for for Big Banks to target to create large price movements in the market. As we all know, retail traders that use outdated and unreliable methods of trading like using trendlines, support and resistance, RSI, MACD, and many others to place trades and put their stop losses at keys points in the market. The "Big Banks" know these me

Perché lo stile è importante
So quanto sia fastidioso fare clic ogni volta sulle proprietà per cambiare il colore della candela, lo sfondo chiaro o scuro e inserire o rimuovere la griglia. Ecco la soluzione con un solo clic: Tre pulsanti personalizzabili per scegliere lo stile di candela che gli operatori desiderano. Un pulsante per passare dalla modalità Giorno a quella Notte. Un pulsante per mostrare o nascondere la griglia sui grafici. ***** Nelle impostazioni è possibile scegliere dove vi
FREE

Renko Charts with Heiken Ashi Filter now have the alerts and the Win-rate . Now you can know which signal will give you that edge your trading needs. Risk to Reward Settings Wins versus Losses Count There are four alert types to choose from for notification on screen, email or phone notification. The alert types also have buffers for use with automation. This indicator can be incorporated with any system that requires renko charts. The four (4) alert types are: Three-bar Formation ; Pinbar

This indicator scans for you up to 30 trading instruments and up to 8 timeframes for occurrences of the high probability reversal patterns: Double Tops/Bottoms with fake breakouts . Please read also the blog post " Professional Trading With Double Tops/Bottoms And Divergences! " which explains the concepts behind the ULTIMATE Double Top/Bottom indicator and how you can use a professional top-down approach. This FREE Version of the Scanner scans only EURUSD and GBPUSD. The full version of the sca
FREE

Special offer in honor of the New Year and Christmas!! https://www.mql5.com/ru/users/bossik2810
Trend Filter Pro
Trend filter indicator.
Very good filter for your trading system, I recommend to use it together with - System Trend Pro or Quantum Entry PRO
The indicator no repaint!!!
Settings:
Change the Period parameter for better filtering ( default is 90)
Any questions? Need help?, I am always happy to help, write me in private messages or
In Telegram: https://t.me/Trader35_Admin
FREE
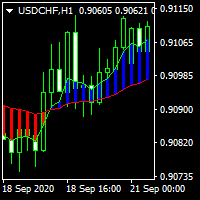
............................................hi................................................ .........................its a simple indicator of movings ............................
.........................a diffrent show of moving averages.......................... ...............can select period , shift , mode and applied price.................. ............many traders use movings for find market movement.................
...........................it can helpfull for finding trends.......
FREE

Future prediction is something any trader would love to know, through this simple prediction algorithm can give a picture of the future. This algorithm is based on past data and the average prices of the data to simulate future candles. This is an indicator that will be redrawn. This indicator is completely free, can be used as a trend reference but absolutely do not use for trading.
FREE

Th3Eng HistoMaster indicator Free Histogram Indicator to detect the current trend direction. The indicator is based on CCI indicator. Also draw arrows when it detect the trend is strong buy or strong sell, with Alerting system (Popup with sound, Email alerting and mobile notification). Also draws a dashboard shows all Time-Frames' current signal.
Requirements
works with all pairs, stocks, CFDs and crypto currencies. works with all Spreads works with all Account types works on all Time-Frames
FREE
Unleash Smarter Trading with the Smart Signal Generator Tired of guesswork in your trading? The Smart Signal Generator is your new essential tool, designed to simplify your strategy and give you a powerful edge. This isn't just another indicator—it's a system built to provide you with high-probability entry signals, saving you time and boosting your confidence. Key Advantages & Features Intelligent Signal Generation : Our system goes beyond basic crossovers. It uses a built-in EMA filter to conf
FREE

QuantumAlert Stoch Navigator is a free indicator available for MT4/MT5 platforms, its work is to provide "alerts" when the market is inside "overbought and oversold" regions in the form of "buy or sell" signals. This indicator comes with many customization options mentioned in the parameter section below, user can customise these parameters as needful. Join our MQL5 group , where we share important news and updates. You are also welcome to join our private channel as well, contact me for the p
FREE
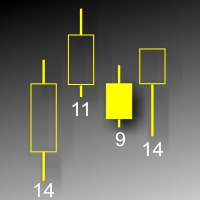
This indicator displays each bar's volume (visible range) in points. The display parameters are customizable. The indicator was developed for personal use (chart analysis). Parameters: ColorL - color of text labels. Position - label position: 0 - below, 1 - above. FontSize - font size. ANGLE - text slope angle.
FREE

Mahdad Candle Timer MT4 — Real‑Time Candle Countdown Mahdad Candle Timer is a lightweight and precise MetaTrader 4 indicator that displays the remaining time until the current candle closes, shown directly beside the latest bar. It is designed for traders who rely on accurate timing — whether scalping, day trading, or waiting for candle confirmation in swing setups. Key Features Accurate Countdown – Remaining time in HH:MM:SS (optional milliseconds) Dynamic Placement – Always aligned with th
FREE

Multi timeframe fractal indicator which shows the higher timeframe's fractal point on lower timeframes.
Parameters Fractal_Timeframe : You can set the higher timeframes for fractals. Maxbar : You can set the maximum number of candles for the calculations. Up_Fractal_Color, Up_Fractal_Symbol, Down_Fractal_Color, Down_Fractal_Symbol : Color and style settings of the fractal points. Extend_Line : Draws a horizontal line from the previous fractal point until a candle closes it over or a user-specif
FREE
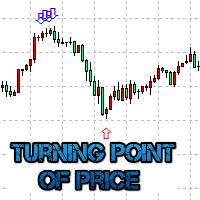
The Turning point of price indicator displays assumed turning points of the price on the chart. It is based on data of the Prise Reversal oscillator and standard ADX. When the value of Prise Reversal is in overbought or oversold area (area size is set by a user), and the value of the ADX main line exceeds the preset value, the Turning point of price indicator draws an arrow pointed to the further assumed price movement. This idea is described in the article Indicator of Price Reversal .
Indicat

Ultimate Market Master Trend Master the Market’s Direction with Precision The Ultimate Market Master Trend indicator is an all-in-one market sentiment analyser designed for traders who demand clarity, accuracy, and confidence in every move.
It combines smart trend detection , multi-timeframe stochastic momentum , and dynamic visual cues to help you identify high-probability entries and exits with ease. Key Features 1. Smart Trend System (Main Chart) Uses a 200-period LWMA baseline to determin
The Currency Strength Lines (CSL) indicator is a very useful tool for both beginners and experienced traders. It is able to calculate the strength of single currencies and show them on a chart, so that you can see the trend and spot trading opportunities.
How does it work? The CSL Indicator will run calculations on all the 28 pairs, resulting in the overall strength across the market of individual currencies at any given moment. You can use this data to spot currencies that are strong, getting
FREE

Necessary for traders: tools and indicators Waves automatically calculate indicators, channel trend trading Perfect trend-wave automatic calculation channel calculation , MT4 Perfect trend-wave automatic calculation channel calculation , MT5 Local Trading copying Easy And Fast Copy , MT4 Easy And Fast Copy , MT5 Local Trading copying For DEMO Easy And Fast Copy , MT4 DEMO Easy And Fast Copy , MT5 DEMO
The homeopathic indicator is also called the CCI indicator. The CCI indicator was proposed
FREE
Shows Kaufman Efficiency Ratio value and smoothed by MA. Calculation is based on movement divided by volatility on a specified period. Levels are adjustable as well as visualization. Parameters: KERPeriod - period for ratio calculation. EMAPeriod - period for moving average. Shift - indicator shift. HigherLevel - low value of the higher zone. LowerLevel - high value of the lower zone. ShowHigherZone - allow higher zone drawing. HigherZoneColor - higher zone color. ShowLowerZone - allow lower zon
FREE

The Hull Moving Average (HMA), developed by Alan Hull from 2005, one of the most fast-moving Average, reduce lag and easy to use to identify Trend for both Short & Long term. This Indicator is built based on exact formula of Hull Moving Average with 3 phases of calculation: Calculate Weighted Moving Average (WMA_01) with period n/2 & (WMA_02) with period n Calculate RAW-HMA: RAW-HMA = 2 * WMA_01(n/2) - WMA_02(n)
Weighted Moving Average with period sqrt(n) of RAW HMA HMA = WMA (RAW-HMA, sqrt(n)
FREE

Smart Reversal Signal is a professional indicator for the MetaTrader 4 platform; it has been developed by a group of professional traders. This indicator is designed for Forex and binary options trading. By purchasing this indicator, you will receive: Excellent indicator signals. Free product support. Regular updates. Various notification options: alert, push, emails. You can use it on any financial instrument (Forex, CFD, options) and timeframe.
Indicator Parameters Perod - indicator calculat

WaPreviousCandleLevels MT4 shows the previous candle levels, it shows the previous candle Open High Low Close levels (OHLC Levels) in different time frame. It's designed to help the trader to analyse the market and pay attention to the previous candle levels in different time frame. We all know that the OHLC Levels in Monthly, Weekly and Daily are really strong and must of the time, the price strongly reacts at those levels. In the technical analysis, the user can use them as a support and res
FREE
The MT4 indicator that we are describing is designed to provide traders with an alert, notification, and email when Fibonacci levels are crossed. The Fibonacci levels are calculated based on the zigzag indicator, which helps to identify potential trend reversals in the market. When the indicator detects that a price has crossed a Fibonacci level, it will trigger an alert and send a notification to the trader's MT4 mobile app. Additionally, the indicator can be configured to send an email to the
FREE

This is an indicator detecting trend direction. It uses the popular Bill Williams Alligator. It shows market state on all timeframes on one chart. As is well known, traders gain the main profit on the Forex market trading by trend, and losses usually occur when the market is flat. So, in order to gain profit a trader should learn to detect trend market and direction of a current trend in a rapid manner. This indicator has been developed for this purpose. MTF Alligator helps to: Profitably trade
FREE

RSI Signal Scanner The primary trend of the stock or asset is an important tool in making sure the indicator's readings are properly understood. For example, some of the technical analysts, have promoted the idea that an oversold reading on the RSI in an uptrend is likely much higher than 30%, and an overbought reading on the RSI during a downtrend is much lower than the 70% level. This indicator notifies you of RSI important levels breakouts (30% and 70%) by searching among the symbols and chec
FREE

Transform your MetaTrader 4 chart into a professional trading cockpit. Apex Dashboard is a high-performance utility designed for serious traders who need complete situational awareness. It moves beyond simple monitoring by providing a comprehensive overview of your account's solvency, performance, and risk exposure in real-time. Unlike standard indicators, Apex Dashboard features a Persistent Data Engine . It records your historical Peak Drawdown to a local file, ensuring your risk metrics remai
FREE
Highly configurable Moving average indicator.
Features: Highly customizable alert functions (at levels, crosses, direction changes via email, push, sound, popup) Multi timeframe ability Color customization (at levels, crosses, direction changes) Linear interpolation option Works on strategy tester in multi timeframe mode (at weekend without ticks also) Parameters:
MA Timeframe: You can set the lower/higher timeframes for Ma. MA Bar Shift: Y ou can set the offset of the line drawing. MA Period,
FREE

Advantages: Based on classic indicators - ATR, Moving Average Determines the trend / flat in the market by coloring the histogram with the appropriate color Arrows indicate confirmed signals It is an excellent filter for channel strategies (by extremes)
Settings:
Наименование Описание настройки Period of Flat Detector Number of bars / candles for analysis Period of EMA Period of EMA (Moving Average) Period of ATR Period of ATR (current timeframe) Coefficient of deviation Coefficient of deviati
FREE

Unisciti al Canale Koala Trading Solution nella comunità MQL5 per scoprire gli ultimi segnali, le notizie su tutti i prodotti Koala. Il link per unirti è il seguente: https://www.mql5.com/en/channels/koalatradingsolution Descrizione:
siamo felici di presentare il nostro nuovo indicatore gratuito basato su uno degli indicatori professionali e popolari nel mercato forex (PSAR) questo indicatore è una nuova modifica sull'indicatore SAR parabolico originale, nell'indicatore pro SAR puoi vedere
FREE
MetaTrader Market - i robot di trading e gli indicatori tecnici per trader sono disponibili nel tuo terminale di trading.
Il sistema di pagamento MQL5.community è disponibile per tutti gli utenti registrati sul sito MQL5.com che effettuano transazioni su MetaTrader Services. Puoi depositare e prelevare denaro usando WebMoney, PayPal o una carta di credito.
Ti stai perdendo delle opportunità di trading:
- App di trading gratuite
- Oltre 8.000 segnali per il copy trading
- Notizie economiche per esplorare i mercati finanziari
Registrazione
Accedi
Se non hai un account, registrati
Consenti l'uso dei cookie per accedere al sito MQL5.com.
Abilita le impostazioni necessarie nel browser, altrimenti non sarà possibile accedere.