RSI vs Envelopes
- Indikatoren
- Version: 1.1
- Aktualisiert: 26 November 2021

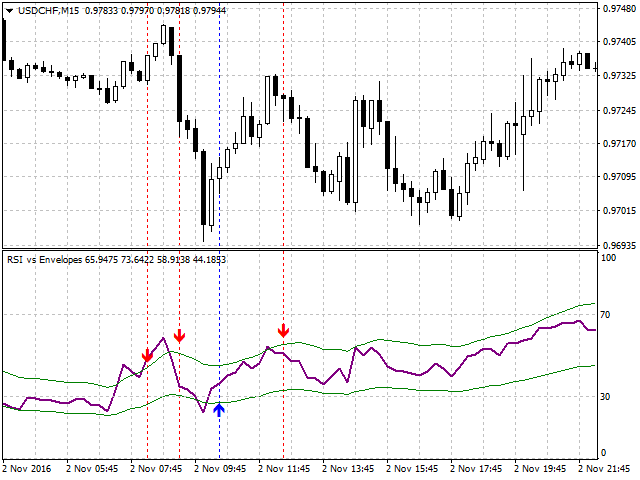
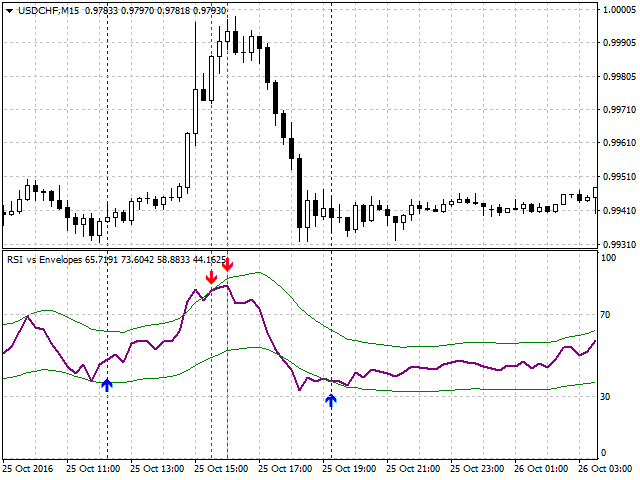
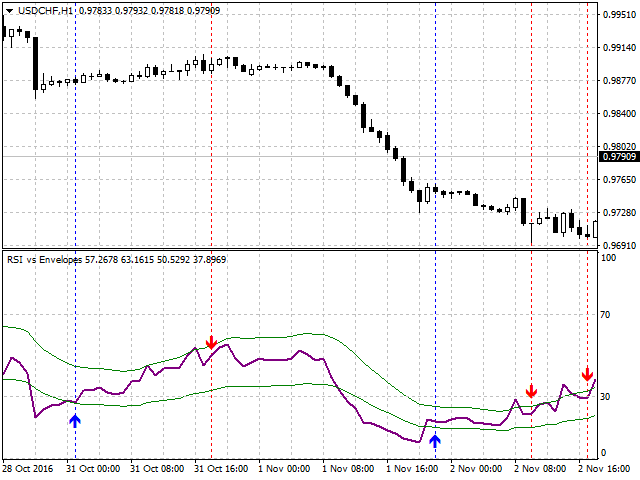
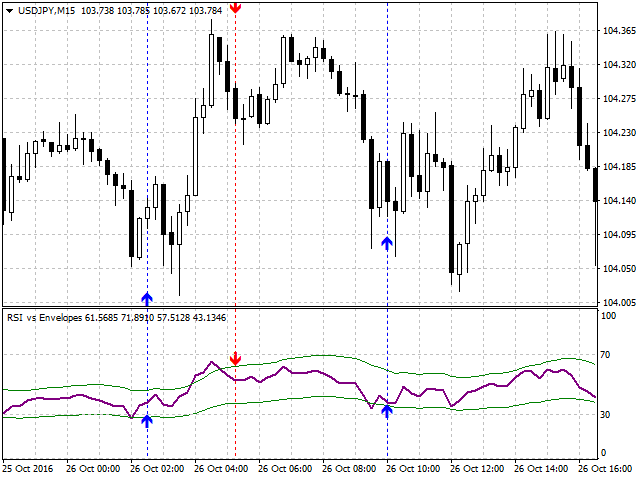
Dieser Semaphor-Indikator basiert auf dem Standard-RSI, der über den Hüllkurven-Indikator angewendet wird, der eine Hüllkurve oder Hüllkurvenschwankungsgrenzen anzeigt. Dies ist eine Version des RSI vs Envelopes Graph, der in einem separaten Fenster gezeichnet wird.
Ein Verkaufssignal entsteht, wenn die obere Hüllkurve/Grenze vom RSI-Indikator von oben nach unten durchbrochen wird.
Ein Kaufsignal entsteht, wenn die untere Hüllkurve/Grenze durch den RSI-Indikator von unten nach oben durchbrochen wird.
Der Indikator kann Pfeile auf den Indikator zeichnen, vertikale Linien ziehen, um zu verfolgen, wo sich der Einstieg auf dem Chart befindet, einen akustischen Alarm bei einem Einstiegssignal abspielen und Push-Benachrichtigungen an Ihr Handy senden.
Wenn Sie nur Signale beim Überschreiten des RSI-Indikators und der Standardsignalpegel benötigen, verwenden Sie den Indikator RSI Alerts.
Einstellungen
- RSI-Periode - Standard-RSI-Periode.
- Hüllkurvenzeitraum - Zeitraum des Indikators.
- Alert on screen - Alarme aktivieren.
- Push senden - Push-Benachrichtigungen an ein Mobiltelefon aktivieren.
- Hüllkurven-Methode - Methode zum Zeichnen von Hüllkurven.
- Angewandter Preis - ерк Preise, die für die Berechnungen des Indikators verwendet werden.
- Hüllkurvenabweichung % - Abweichung in % (Hüllkurvenbreite).
- Shift 0-aktueller Balken, 1-erster Balken - Verschiebung des Signals, wenn =0 - das Signal wird auf einer Nullkerze gesucht, wenn =1 - das Signal wird auf der abgeschlossenen Kerze gesucht, und das Signal wird auf der neuen Kerzeneröffnung erzeugt. Die zweite Methode(=1) ist zuverlässiger.
- Linien zeichnen - aktivieren/deaktivieren.
- RSI-Farbe - Farbe wählen.
- Farbe der Hüllkurven - Farbe wählen.
- Farbe des Kaufpfeils - Farbe wählen.
- Farbe des Verkaufspfeils - wählen Sie die Farbe.
Empfehlungen
Wenn Sie"Shift 0-current bar, 1-first bar" = 0 einstellen, besteht die Möglichkeit, dass das Signal nicht bestätigt wird und neu gezeichnet wird, daher ist der empfohlene Wert = 1.
Manchmal ist es praktisch, zwei Indikatoren RSI vs. Hüllkurven und RSI vs. Hüllkurvendiagramm gleichzeitig auf demselben Chart zu sehen.

Der Benutzer hat keinen Kommentar hinterlassen