Point Of Interest
- Indikatoren
- Version: 1.3
- Aktualisiert: 11 Januar 2025
- Aktivierungen: 5

Was ist ein Point of Interest? Händler, die Smart-Money-Konzepte verfolgen, bezeichnen dies als Liquiditätspunkt oder als Bereiche, in denen von Einzelhändlern Liquidität aufgebaut wurde, auf die die Großbanken abzielen, um große Kursbewegungen auf dem Markt zu erzeugen.
Wie wir alle wissen, verwenden Kleinhändler veraltete und unzuverlässige Handelsmethoden wie Trendlinien, Unterstützung und Widerstand, RSI, MACD und viele andere, um Geschäfte zu platzieren und ihre Stop-Loss-Punkte an Schlüsselstellen des Marktes zu setzen. Die "Big Banks" kennen diese Methoden ebenfalls, um Kleinhändler dazu zu verleiten, ihre Stop-Losses an Schlüsselstellen zu platzieren, um Liquiditätspools aufzubauen, und dann die Kurse nach oben oder unten zu treiben, um diese Geschäfte zu stoppen und sich die Liquidität zu sichern.
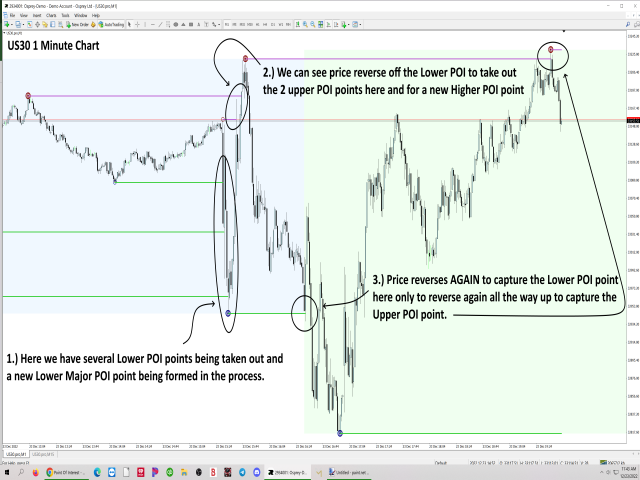
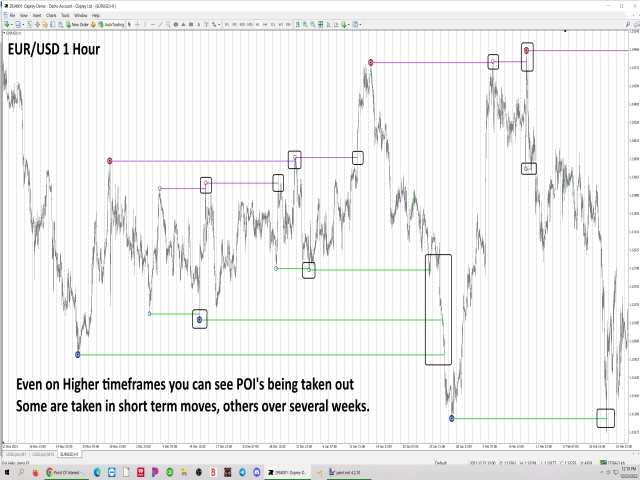
Der Point of Interest-Indikator (im Folgenden als POI bezeichnet) kann Ihnen dabei helfen, die Bereiche zu erkennen, die zur Zielscheibe für die Großbanken werden könnten. Sie müssen wissen, dass es keine Möglichkeit gibt, zu bestimmen, wann oder wie schnell ein POI eingenommen werden kann, aber genau wie mein Indikator für Marktungleichgewicht gezeigt hat, versichere ich Ihnen, dass sie irgendwann kommen werden, sobald sich genügend Liquidität gebildet hat, um sie zu erobern.
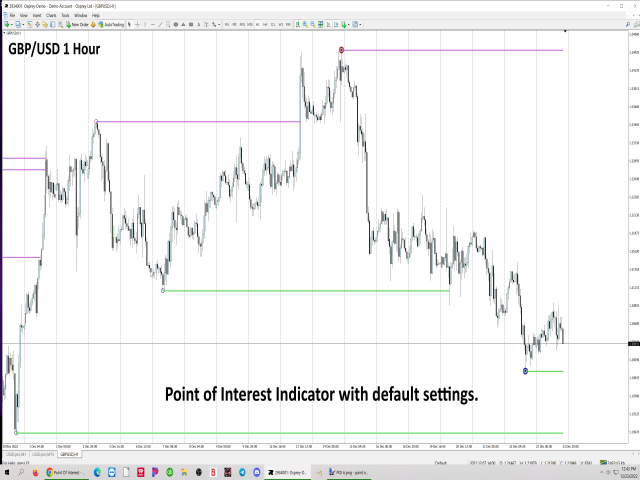
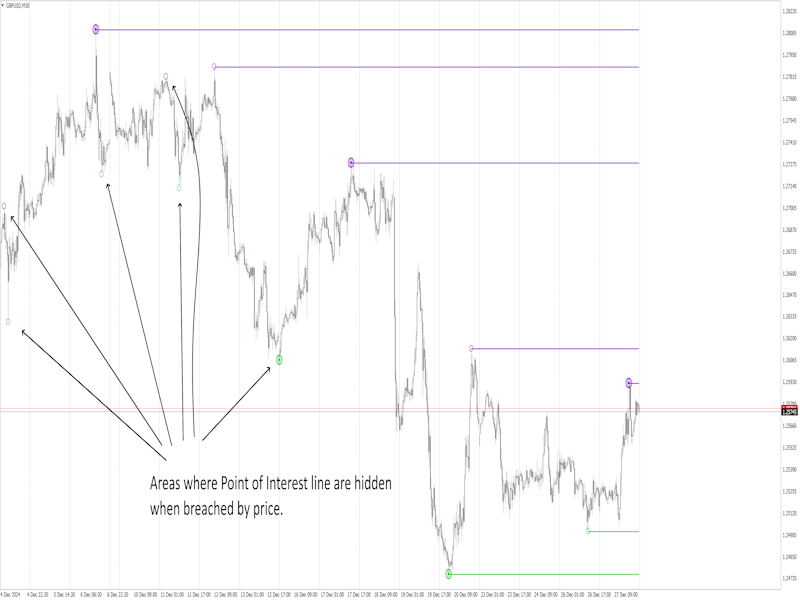
Der POI-Indikator ist ziemlich einfach, wenn Sie ihn auf einem Chart platzieren. Bevor Sie ihn mieten oder kaufen, müssen Sie sich darüber im Klaren sein, dass es sich um einen Indikator zur Wiederholung handelt! Sie müssen ihn als Zielindikator verwenden. Er wurde so konzipiert, weil wir alle wissen, dass sich der Preis nicht einfach auf magische Weise umdreht, sobald ein höheres Hoch oder ein niedrigeres Tief durchbrochen wird. Es gibt noch andere Einflüsse wie Ungleichgewichte, Order-Blöcke in einem höheren Zeitrahmen und vieles mehr, die sich darauf auswirken können, wie weit der Preis gehen wird, bevor eine Umkehr stattfindet. Wenn der Kurs zum Beispiel ein neues Tief erreicht, markiert der POI-Indikator den neuen Tiefpunkt. Wenn der Kurs dann noch tiefer fällt, folgt er dem Kurs und zeichnet das POI-Symbol und die Linie neu, bis sich ein echter Höchststand gebildet hat. Ist dieser Höchststand erreicht, folgt die Linie weiterhin der aktuellen Kerze, bis der Kurs die POI-Linie durchbricht. Wie Sie zu dieser POI-Linie zurück handeln, bleibt dem Händler und seiner Strategie überlassen. Dies ist ein Informationsindikator, ähnlich dem, was mein Market Imbalance-Indikator dem Trader liefert.
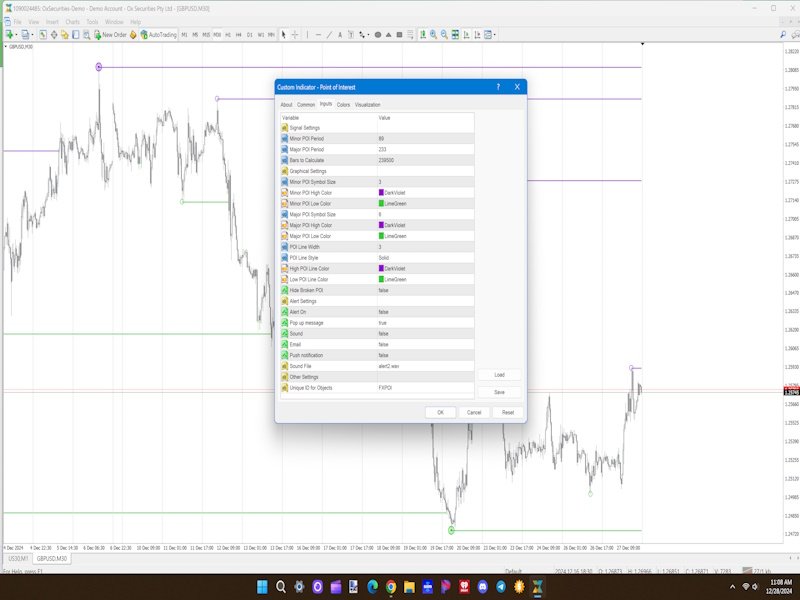
Aktuelle Eingaben (Standardwerte)
Signal-Einstellungen
- Minor POI Period- Dies sind kleinere Punkte, die sich zwischen Major POI's bilden können (89)
- Haupt-POI-Periode - Dies sind die größeren Punkte von Interesse und sind stärkere Umkehrbereiche (233)
- Zu berechnende Balken - Anzahl der zurückliegenden Balken (5000)
Grafische Einstellungen
- Größe des Minor POI-Symbols - Größe des Minor POI, dargestellt durch einen kleinen Kreis (3)
- Minor POI High Color - Farbe des Symbols bei hohen Werten (kastanienbraun)
- Farbe des Symbols bei Tiefstwerten (Marineblau)
- Größe des Haupt-POI-Symbols - Größe des Haupt-POI, dargestellt durch einen Doppelkreis (6)
- Farbe des Haupt-POI-Tiefpunkts - Farbe des Symbols bei Hochpunkten (kastanienbraun)
- Farbe des Haupt-POI-Tiefs - Farbe des Symbols bei Tiefs (Marineblau)
- POI-Linienbreite - Breite der POI-Linien selbst (4)
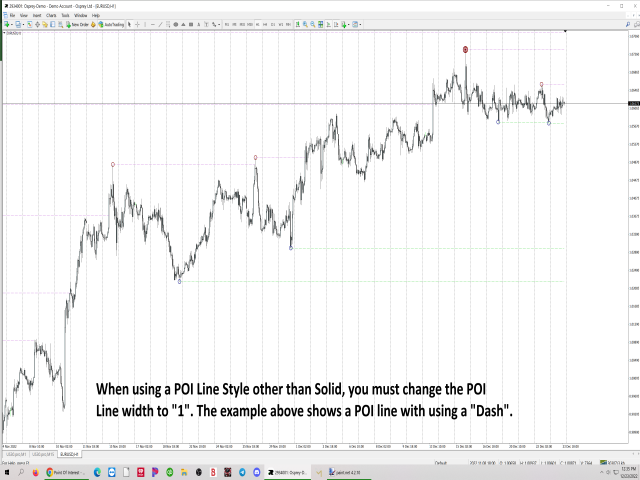
- POI-Linienstil - Stil der POI-Linie (einfarbig)
- Farbe der oberen POI-Linie - Farbe der oberen POI-Linie (MediumOrchid)
- Farbe der unteren POI-Linie - Farbe der unteren POI-Linie (Limonengrün)
- Unterbrochene POI ausblenden - Blendet POI-Linien aus, die vom Preis durchbrochen wurden, damit nur aktive POI im Diagramm angezeigt werden.
Alert-Einstellungen
- Alert On? - Schaltet Alarme ein oder aus (falsch)
- Pop-up-Meldung- Zeigt eine Pop-up-Meldung an, wenn eine POI-Linie durchbrochen wurde (wahr)
- Ton - Gibt einen akustischen Alarm aus (falsch)
- E-Mail- Der Händler erhält eine Benachrichtigung per E-Mail. Damit dies funktioniert, müssen E-Mail-Benachrichtigungen eingerichtet sein. (falsch)
- Push-Benachrichtigung- Hiermit wird eine Push-Benachrichtigung an das Mobilgerät oder Tablet des Händlers gesendet. Damit dies funktioniert, müssen Push-Benachrichtigungen eingerichtet sein. (falsch)
- Tondatei - Tondatei für akustischen Alarm (alert2.wav)
Andere Einstellungen
- Eindeutige ID für Objekte - Diese sollte nicht geändert werden. Wenn Sie jedoch mit dem Mauszeiger über eine POI-Linie fahren, erhalten Sie Informationen darüber, ob der POI gebrochen wurde, um welche Art von POI es sich handelt (Major oder Minor), den aktuellen Preis und die Uhrzeit, wenn er ungebrochen ist, und wenn er gebrochen wurde, die Uhrzeit und den Preis, sobald er gebrochen wurde.
Risiko-Offenlegung
Bitte stellen Sie sicher, dass Sie die Risiken verstehen und Ihre finanzielle Situation und Handelserfahrung sorgfältig abwägen, bevor Sie handeln.
Es besteht die Möglichkeit, dass Sie einen Teil oder die gesamte Anfangsinvestition verlieren können. Daher sollten Sie kein Geld investieren, dessen Verlust Sie sich nicht leisten können!
Keine der auf MQL5.com dargestellten Informationen stellt eine Empfehlung zum Kauf, Verkauf oder Halten von Wertpapieren, Finanzprodukten oder -instrumenten oder zur Anwendung einer bestimmten Anlagestrategie unter Verwendung dieses Produkts dar.
Viel Glück und frohes Handeln!