Tipu Heikin Ashi Panel
- Indikatoren
-
Kaleem Haider
 Please note that I do not do Freelance orders anymore. Please report anyone posing as me as Freelancer
 - Version: 2.10
- Aktualisiert: 5 Februar 2018
Tipu Heikin-Ashi Panel ist die modifizierte Version des ursprünglichen Heiken-Ashi-Indikators, der von MetaQuotes hier veröffentlicht wurde.
Eine professionelle Version dieses Indikators ist hier erhältlich.
Merkmale
- Ein einfach zu bedienendes Panel, das den Heiken Ashi-Trend des ausgewählten Zeitrahmens anzeigt.
- Anpassbare Kauf-/Verkaufswarnungen, Push-Warnungen, E-Mail-Warnungen oder visuelle Warnungen auf dem Bildschirm.
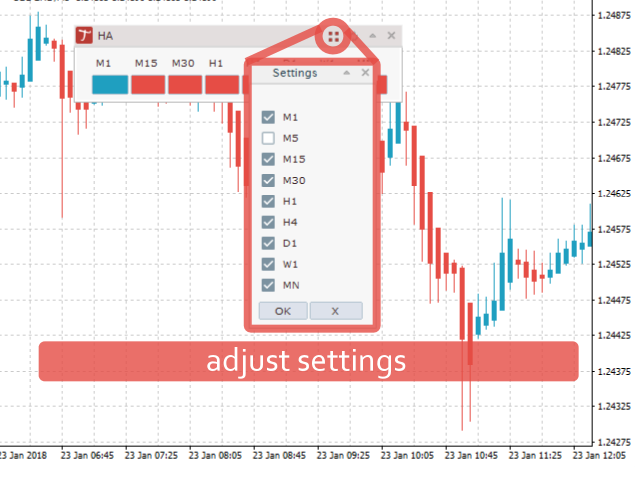
- Anpassbares Panel. Das Panel kann an eine beliebige Stelle im Chart verschoben oder minimiert werden, um mehr Platz zu schaffen.
Heikin bedeutet "der Durchschnitt" und Ashi bedeutet "Fuß" auf Japanisch. Heikin-Ashi ist eine japanische Charttechnik, bei der Durchschnittswerte von Kursen für die Darstellung von Kerzen verwendet werden. Diese Technik glättet ein gewisses Rauschen in den Kerzendiagrammen, um ein besseres Trendbild zu vermitteln. Ein weiteres Beispiel für einen gängigen Glättungsindikator sind gleitende Durchschnitte, die in Verbindung mit Heikin-Ashi verwendet werden können.
Wie man ihn verwendet
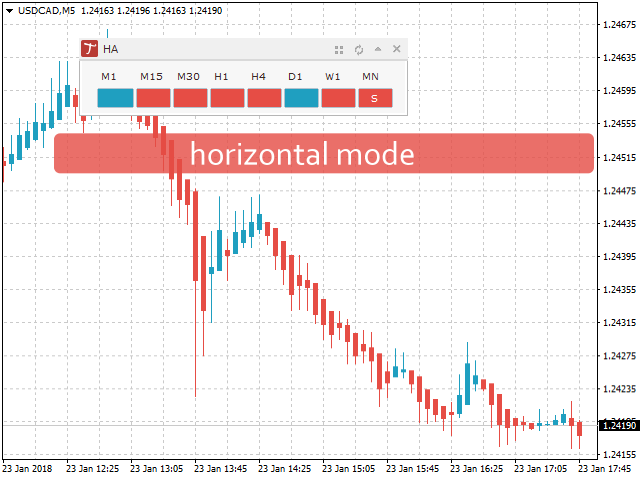
Blaue Kerzen stehen für einen Aufwärtstrend und rote Kerzen für einen Abwärtstrend. Wenn z. B. ein relevanter Zeitraum aufwärts gerichtet ist, wird das Panel für diesen Zeitraum blau angezeigt. Außerdem wird ein visuelles Kaufsignal angezeigt, wenn eine Kerze von rot zu blau wechselt. Es wird empfohlen, Signale von anderen Zeitrahmen und/oder anderen Indikatoren zu berücksichtigen, bevor Sie eine Handelsentscheidung treffen.
Berechnung
Schluss = (Eröffnung+Hoch+Tief+Schluss)/
Open = [Open (vorheriger Balken) + Close (vorheriger Balken)]/2
Hoch = Max (Hoch,Eröffnen,Schließen)
Tief = Min (Tief, Öffnen, Schließen)
Parameter
- Panel anzeigen - Sichtbarkeitseinstellungen, wählen Sie true/false, um das Panel anzuzeigen
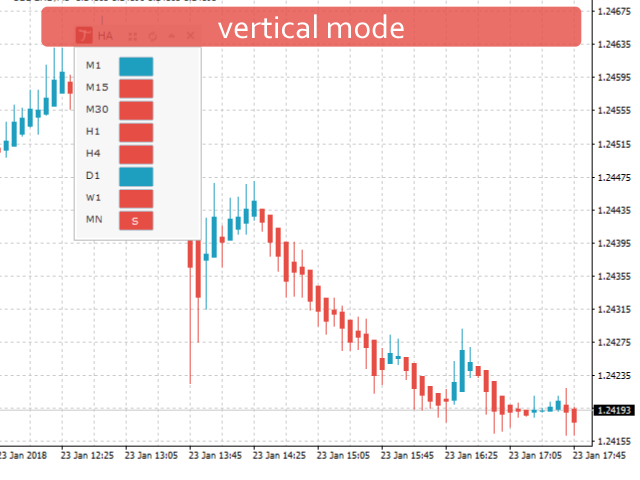
- Dialogmodus - Vertikal/Horizontal - z.B. horizontal stellt die Zeitrahmen horizontal dar.
- Overlay-Indikator - Wählen Sie dies, wenn Sie den Heikin Ashi über Ihrem persönlichen Candlechart, Bar Chart oder Line Chart anzeigen lassen möchten.
- Aufwärtstrendfarbe - Einstellungen für die Aufwärtstrendfarbe auf dem Panel, zum Ändern der Aufwärtstrendkerzenfarbe wählen Sie die Farbeinstellungen neben den Eingabeeinstellungen
- Kaufsignalfarbe - Kaufsignalfarbe auf dem Panel, diese zeigt Kauf/Verkauf bei Änderung der Kerzenfarbe an
- Downtrend Color - Einstellungen für die Farbe des Abwärtstrends auf dem Panel
- Farbe des Verkaufssignals - Farbe des Verkaufssignals auf dem Panel
- Alert Shift - Kerzenverzögerung für das Signal, geben Sie 1 ein, wenn Sie möchten, dass der Alarm nach einer Kerze gesendet wird.
- Alert Mobile - wählen Sie true/false, um eine Push-Benachrichtigung auf Ihrem Gerät zu erhalten, stellen Sie sicher, dass die Geräteeinstellungen hier korrekt sind
- Alert Onscreen - wählen Sie true/false, um eine Benachrichtigung auf dem Terminal zu erhalten, diese wird in einem separaten Fenster angezeigt
- Alert Email - wählen Sie true/false, um E-Mail-Benachrichtigungen zu erhalten. Stellen Sie sicher, dass die E-Mail-Einstellungen hier korrekt sind.
Entwickler
int shift = 1; //Verwenden Sie dies für den Rückblick, 0 bedeutet die aktuellste Kerze, 1 bedeutet die vorherige Kerze

int iSignal = iCustom(_Symbol,_Period,"Market/Tipu Heikin Ashi Panel","",false,0,false,false,false,false,false,false,false,false,false,clrNONE,clrNONE,clrNONE,clrNONE,"",1,false,false,false,4,shift);

int iTrend = iCustom(_Symbol,_Period,"Market/Tipu Heikin Ashi Panel","",false,0,false,false,false,false,false,false,false,false,false,clrNONE,clrNONE,clrNONE,clrNONE,"",1,false,false,false,5,shift); //

if (iSignal == OP_BUY) //dargestellt durch "B" und "S", die auf der Tafel angezeigt werden,
if (iTrend == OP_BUY) //dargestellt durch blau gefärbte Kästchen


Very nice tool