Cross Alert Histogram MT4

  • 指标
  • Mostafa Ghanbari
    Mostafa Ghanbari
    ✅ MGH Products 创始人
    ✅ 软件工程师 | 自定义指标与智能交易系统(EA)开发者
    ✅ MQL5.com 已发表作者
    您好!我是 Mostafa,一名专注的软件工程师,热衷于将复杂的交易策略转化为高性能、可靠的工具。凭借扎实的软件工程学术背景和多年的专业编程经验,我在严谨的软件架构与充满活力的算法交易世界之间架起桥梁。
    🛠 技术专长:
    语言:精通 MQL4/MQL5、C++、Python 及现代软件开发框架。
    算法设计:打造稳健的自定义指标、智能交易系统(EA)和自动化实用工具。
  • 版本: 1.0
  • 激活: 5

Overview

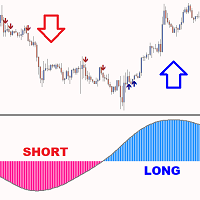
MGH-CrossAlert Histogram is a sub-window histogram indicator for MetaTrader 5. It displays the relationship between any two configurable lines as a color-coded histogram bar by bar, showing which line is dominant, how large the gap between them is, and when a crossover occurs.

The histogram runs in a separate sub-window, keeping the price chart uncluttered.

How It Works

Each bar on the histogram reflects the live relationship between the two selected lines:

  • Green — Line 1 is above Line 2
  • Red — Line 2 is above Line 1
  • Yellow — the two lines are at equal value; a crossover is occurring

Professional Histogram Mode

When this mode is enabled, bars are displayed in two shades. A brighter color indicates that the gap between the lines is widening (momentum building), while a darker shade indicates that the gap is narrowing (momentum fading). This allows traders to observe changes in momentum strength before the actual crossover takes place.

Line Configuration

Both lines are independently configurable. Supported line types include:

  • Ichimoku lines: Tenkan-sen, Kijun-sen, Span A, Span B, Chikou Span
  • Moving Averages: Simple, Exponential, Smoothed, Linear Weighted
  • Trend Lines
  • Raw Price

Each line can reference a different timeframe. For example, an H1 Tenkan-sen can be compared against an H4 Kijun-sen on the same chart. Candle-level shifts are supported on either line for structures such as Tenkan+17. The entire histogram can also be shifted forward or backward for alignment purposes.

Alert System

Alerts can be configured for the following events:

  • Alert On Cross — fires when the two lines cross (color changes between green and red)
  • Alert On Same Value — fires when the lines reach equal value (yellow bar)
  • Candle Number To Check — set to 0 for live candle alerts, or 1 for confirmed closed-candle signals

Delivery options: popup window, sound, email, push notification.

Practical Applications

The indicator can be used in a variety of analysis workflows, including:

  • Tenkan vs Kijun histogram to monitor TK cross strength without chart clutter
  • Span A vs Span B dominance as a histogram for Kumo cloud direction
  • Multi-timeframe MA crossover tracking (for example, H4 SMA 50 vs H1 EMA 9)
  • Price vs moving average relationship bar by bar
  • Professional mode for detecting fading momentum ahead of a crossover

Setup

  1. Select Line 1 — type, period, method, timeframe, shift
  2. Select Line 2 — same options, independently configured
  3. Configure alert conditions and enable Professional Histogram mode if needed

The indicator works on any symbol and any timeframe.

Technical Specifications

  • Platform: MetaTrader 5
  • Display: separate sub-window histogram
  • Line types: Ichimoku, Moving Average, Trend Line, Price
  • Timeframe per line: independently configurable
  • Alerts: popup, sound, email, push notification
  • Repaint control: candle 0 (live) or candle 1 (confirmed)


MT5 Versionhttps://www.mql5.com/en/market/product/177645

评分 24
ali.mo66888
7
ali.mo66888 2026.08.18 13:51 
 

One of the most useful indicators for analyzing market trends.

推荐产品
MT Supply Demand
Issara Seeboonrueang
4 (4)
We provide indicators tailored to better meet your trading requirements.       >>  MT Magical  << MT Supply Demand : It is an indicator created to find supply and demand, which will be important support and resistance levels for the price.  Supply Zone   is a zone where the price has reached, it is often resisted. In other words, when the price reaches this zone, there will be more selling power to push the price back down. Demand Zone   is a zone where the price has reached, it is ofte
FREE
Features: 1- Get OB/OS Levels from Golden MA Levels 2- Wait for Buy/Sell Start Level Cross 3- Optional: Should price cross Mid Level in earlier bars 4- Optional: Crossing bar High/Medium Volume 5- Optional: MA Stacked to check up/down trend for current TF 6- Optional: NRTR higher timeframes aligned Check Detailed blog post explained: https://www.mql5.com/en/blogs/post/758457 Levels with Buffers available here: Golden MA Levels Indicator: https://www.mql5.com/en/market/product/119515 Note: Arr
FREE
Zig Zag 123
Stephen Reynolds
Zig Zag 123 tells us when a reversal or continuation is more likely by looking at the shift in supply and demand. When this happens a signature pattern appears known as 123 (also known ABC) will often break out in direction of higher low or lower high. Stop loss and take profit levels have been added. There is a panel that shows the overall performance of your trades for if you was to use these stop loss and take profit levels.  We get alerted if a pattern 123 appears and also if the price re
FREE
Индикатор реализован для определения классического канала движения цены, который используется на крупных биржевых площадках. Не перерисовывается Синий уровень - это уровень поддержки  Красный уровень - это уровень сопротивления  Белый уровень - является Pivot-уровнем  Настройки Period_SEC  - ввод  значения периода . Примечание:  Индикатор определяет уровни только на пятизначных котировках! Метод торговли:  Открытие позиций осуществляется от уровней , именно на их значениях происходит отскок цены
FREE
Forex Market Profile and Vwap
Lorentzos Roussos
4.86 (7)
外汇市场概况(简称FMP) 这不是什么: FMP 不是经典的字母编码 TPO 显示,不显示整体图表数据配置文件计算,并且不将图表分段并计算它们。 它能做什么 : 最重要的是,FMP 指示器将处理位于用户定义频谱左边缘和用户定义频谱右边缘之间的数据。 用户只需用鼠标拉动指示器的每一端即可定义频谱。 当指标右边缘被拉到实时柱并进一步(到未来)时,指标被认为是“实时的”(它会更新新柱) 该指标将一个“锚点”对象放在它所附加的图表上,然后将该锚点与硬盘驱动器上的文件相关联。 这允许您在图表上运行一个持续的 FMP,您的设置在重新启动时持续存在,直到图表 - 或指标 - 关闭。 FMP 指标可以在一个图表上运行多个自身实例,并且您可以命名它们。(名称在指标数据中显示为半透明,以便您能够区分它们) 指标的数据窗口被快速切换控件包围,当它们的状态发生变化时,这些控件会更新该图表的指标设置的“内存”。 左手柄、右手柄和数据窗口的显示可以自定义。您可以从 13 种不同的样式组合中进行选择,或者选择每个部分的单独样式(从 13 种中选择)。 您可以选择显示与光谱左侧对齐、在中间对称居中、与光谱右侧
FREE
This simple indicator paints with a darker color on the volume bar when the quantity traded is above the average of select number of periods of the volume itself, highlighting the moments when there was a large volume of deals above the average. It is also possible to use a configuration of four colors where the color tone shows a candle volume strength. The indicator defaults to the simple average of 20 periods, but it is possible to change to other types of averages and periods. If you like t
FREE
Our offer also includes a free panel — Indicator Panel — which allows you to show or hide indicators created by BOToBRACIA. High and Low Points is a practical technical analysis indicator that plots levels corresponding to the highs and lows from previous periods (day / week / month) — levels that, in the Smart Money Concepts (SMC) and ICT approach, are treated as liquidity zones, while in classical technical analysis they serve as potential support and resistance levels. Indicator settings: •
FREE
MASi Three Screens
Aleksey Terentev
5 (2)
MASi Three Screens is based on the trading strategy by Dr. Alexander Elder. This indicator is a collection of algorithms. Algorithms are based on the analysis of charts of several timeframes. You can apply any of the provided algorithms. List of versions of algorithms:     ThreeScreens v1.0 - A simple implementation, with analysis of the MACD line;     ThreeScreens v1.1 - A simple implementation, with analysis of the MACD histogram;     ThreeScreens v1.2 - Combines the first two algorithms in
FREE
Shadow Flare MT4
Kestutis Balciunas
Shadow Flare 指标是一款适用于 MetaTrader 4 的 非重绘型趋势与流动性工具 。它基于可配置的移动平均基线(可选 HMA、EMA、SMA 或 RMA),在其外侧包裹一层平均真实波幅(ATR)通道,只在价格收盘有效突破上/下包络带时才切换“黏性”趋势状态。同一套趋势引擎还驱动自动供需区模块,用于检测枢轴高点和枢轴低点,在其周围绘制彩色矩形,并在价格收盘穿透该区域时立即将该区域标记为失效并移除。 买卖信号在趋势状态翻转的那一根 K 线上触发,可选的成交量与 RSI 过滤器帮助交易者屏蔽弱势或逆动能的入场。内置仪表盘会实时显示趋势偏向(Trend Bias)、动能(基于 RSI)以及成交量状态。完整的提醒组件——弹窗、声音、手机推送和电子邮件——在每次信号出现时于收盘触发一次,从而确保实盘交易与回测的信号数量完全一致。 MT5 版本请查看:  Shadow Flare MT5 更多作者产品:   查看所有产 品 想查看实盘示例和最新工具,请访问我的个人主页并发送好友请求,以免错过更新! 工作原理 自适应趋势引擎 指标首先根据用户选择的方法(HMA、EMA、SMA 或
FREE
LT Force MT4
Thiago Duarte
For those who like trend the Force will be a very useful indicator. This is because it is based on the famouse ADX, which measure the strenght of a trend, but without its 3 confusing lines. Force has its very simple interpretation: if the histogram is above zero level the trend is up, otherwise it is down. You can use it to find divergences too, which is very profitable. If you have any doubt or suggestion, please, contact me. Enjoy! MT5 version:  https://www.mql5.com/en/market/product/41928 T
FREE
JONUX FRVP — Fixed Range Volume Profile for MT4 JONUX FRVP is an analytical tool designed to visualize volume distribution within the MetaTrader 4 platform. Unlike standard volume indicators that are statically bound to chart periods, this utility employs an interactive engine to analyze the volume traded at specific price levels over a user-defined custom time range. Concept & Functionality  The indicator calculates a histogram of volume across user-defined price bins and highlights key struc
FREE
Wise Men Indicator demo
Bohdan Kasyanenko
3 (2)
The indicator displays signals according to the strategy of Bill Williams on the chart. Demo version of the indicator has the same features as the paid, except that it can work only on a demo account . Signal "First Wise Man" is formed when there is a divergent bar with angulation.  Bullish divergent bar - with lower minimum and closing price in the upper half. Bearish divergent bar - higher maximum and the closing price at the bottom half. Angulation is formed when all three lines of Alligator
FREE
Colored Candle Time
Saeed Hatam Mahmoudi
Candle Time (MT4) The Candle Time indicator shows the remaining time for the current candle on the active chart timeframe. It adapts automatically to the chart period and updates on every tick. This is a charting utility; it does not provide trading signals and does not guarantee any profit. Main functions Display the time remaining for the current candle on any timeframe (M1 to MN). Color-coded state: green when price is above the open (up), gray when unchanged, and red when below the open (do
FREE
交易实用必备工具指标 波浪自动计算指标,通道趋势交易 完美的趋势-波浪自动计算通道计算 , MT4版本 完美的趋势-波浪自动计算通道计算 , MT5版本 本地跟单复制交易 Easy And Fast Copy , MT4版本 Easy And Fast Copy , MT5版本 本地跟单复制交易 模拟试用 Easy And Fast Copy , MT4 模拟账号运行 Easy And Fast Copy , MT5 模拟账号运行 顺势指标又叫CCI指标,CCI指标是 美国 股市 技术分析   家唐纳德·蓝伯特(Donald Lambert)于20世纪80年代提出的,专门测量股价、外汇或者贵 金属 交易是否已超出常态分布范围。属于超买超卖类指标中较特殊的一种。波动于正无穷大和负无穷大之间。但是,又不需要以0为中轴线,这一点也和波动于正无穷大和负无穷大的指标不同。 相对强弱指标RSI是根据一定时期内上涨点数和下跌点数之和的比率制作出的一种技术曲线。能够反映出市场在一定时期内的景气程度。由威尔斯.威尔德(Welles Wilder)最早应用于期货买卖,后来人们发现在众多的图表技术分析中,
FREE
Extremum Reverse Bar
Yurij Izyumov
2.8 (5)
This indicator has been created for finding the probable reversal points of the symbol price. A small candlestick reversal pattern is used it its operation in conjunction with a filter of extremums. The indicator is not redrawn! If the extremum filter is disabled, the indicator shows all points that have a pattern. If the extremum filter is enabled, the condition works – if the history Previous bars 1 candles back contains higher candles and they are farther than the Previous bars 2 candle, such
FREE
Super Auto Fibonacci
Muhammed Emin Ugur
Discover the power of precision and efficiency in your trading with the " Super Auto Fibonacci " MT4 indicator. This cutting-edge tool is meticulously designed to enhance your technical analysis, providing you with invaluable insights to make informed trading decisions. Key Features: Automated Fibonacci Analysis: Say goodbye to the hassle of manual Fibonacci retracement and extension drawing. "Super Auto Fibonacci" instantly identifies and plots Fibonacci levels on your MT4 chart, saving you tim
FREE
Free automatic fibonacci
Tonny Obare
4.68 (50)
Free automatic Fibonacci is an indicator that automatically plots a Fibonacci retracement based on the number of bars you select on the BarsToScan setting in the indicator. The Fibonacci is automatically updated in real time as new highest and lowest values appears amongst the selected bars. You can select which level values to be displayed in the indicator settings. You can also select the color of the levels thus enabling the trader to be able to attach the indicator several times with differe
FREE
High/Low Daily Levels is a robust, lightweight, and precision-engineered technical indicator designed for MetaTrader 4. It plots the High and Low prices of the trading session as clean, horizontal dashed lines directly on your active chart. Whether you trade breakouts, trend continuations, or mean-reversion strategies around key session boundaries, this indicator ensures you always have precise visual references without cluttering your workspace. Key Features: * Dual Mode Operation: Choose be
FREE
Auto Supply and Demand Oscillator is an indicator for MetaTrader 4 and MetaTrader 5 that detects supply and demand zones automatically and displays them as a single oscillator value at the bottom of the chart, instead of drawing rectangles directly on price. Concept Supply zones are price areas where strong selling created a sharp downward move away from a balance area. Demand zones are price areas where strong buying created a sharp upward move. Traditional implementations draw boxes on the
FREE
Candle GAP
Thushara Dissanayake
3 (1)
Candle GAP 指标是交易者使用 缺口交易策略的 重要工具,因为它会自动识别一周中每一天的蜡烛缺口。缺口是指连续两天的收盘价和开盘价之间的价格水平差异。该指标识别四种类型的缺口模式:常见、突破、延续和耗尽。通过将该指标纳入任何图表,交易者可以验证他们的信号并增强他们的交易决策。 Candle GAP 指标的主要特点之一是它的多功能性,因为它可用于 D1(每日)下的任何时间范围以及任何交易品种或工具。它提供易于使用的参数,使所有经验水平的交易者都可以使用它。该指标在图表上迅速绘制缺口形态,便于快速分析和决策。它的简单性增加了它的可用性,确保了简单高效的交易体验。 指标的数据显示参数允许交易者自定义缺口信息的外观。用户可以选择所需的字体系列和大小来显示与一周中的每一天相关的文本。此外,可以为星期一、星期二、星期三、星期四和星期五分配单独的颜色,提供视觉清晰度和易于解释。 总体而言,Candle GAP 指标是寻求利用缺口交易策略的交易者的强大工具。它有助于识别和确认缺口模式,使交易者能够跨各种时间框架和交易品种做出明智的交易决策。 参数 数据显示参数 - 自定义视觉外观和颜色。
FREE
Vispucci
Abraham Correa
Behaving in a similar fashion as the price action of a chart, the indicator uses " Trix " to opportune itself to the exposure of divergency, flat/low market volume, and price action expansion . The TRIX indicator nicknamed after the  Triple-Exponential-average,  is a momentum-based oscillator that filters minor price changes and fluctuations that are considered insignificant for forex trading whilst providing money making opportunities!  Overall, TRIX is a leading indicator that shows diverge
FREE
Check my paid tools they work great and I share Ea's based on them for free please r ate The Dual Timeframe RSI (Relative Strength Index) indicator is a novel trading tool that allows traders to monitor RSI readings from two different timeframes on a single chart. This dual perspective enables traders to identify potential trend confirmations and divergences more effectively. For instance, a trader might use a 1-hour RSI alongside a daily RSI to ensure that short-term trades align with the broa
FREE
PZ Inside Bars
PZ TRADING SLU
4.2 (5)
Enhance your price action strategy: inside bar breakouts at your fingertips This indicator detects inside bars of several ranges, making it very easy for price action traders to spot and act on inside bar breakouts. [ Installation Guide | Update Guide | Troubleshooting | FAQ | All Products  |  Get Help ] Easy to use and understand Customizable color selections The indicator implements visual/mail/push/sound alerts The indicator does not repaint or backpaint An inside bar is a bar or series of
FREE
SuperTrend V
Muhammad Hassaan
*This is TradingView indicator converted to mql4* The SuperTrend V indicator is a popular technical analysis tool used to identify trends and potential trend reversals in financial markets. It is based on the concept of the SuperTrend indicator but incorporates additional features and variations. The SuperTrend V indicator uses a combination of price action and volatility to determine the trend direction and generate trading signals. Here are the key components and features of the indicator: Ca
FREE
Trend Strength Meter
Sukunthakan Ngernbamrung
Simple Trading System Update !!! Follow this link to see our 2024 Strategy !!!   ( Download the EAs scanner ) INTRODUCTION : The strength meter is an trading tool that is used to identify trending and consolidating markets based on the percentage rate.  HOW TO USE IT : You can use this indicator with Deal Trading Trend >> Click Here << To use this trading tool to identify trending and consolidating markets (the most important part)
FREE
PipsFactoryMonthlyDemo
Alfred Kamal
5 (1)
This is Demo Version of PipsFactoryMonthly This indicator depends on High and Low price of Currency in last Month and then i made some secret equations to draw 10 lines. Features You will know what exactly price you should enter the market. You will know when to be out of market. You will know you what should you do in market: Buy Sell Take profit and there are 3 levels to take your profit Support Resistance Risk to buy Risk to Sell Signal Types and Timeframe Used You can use this indicator ju
FREE
Lisek Levels and Channels Indicator
Darius Hans Lischka
4.8 (20)
准备好成为外汇交易的夏洛克·福尔摩斯了吗?️‍️ 介绍终极交易工具: Lisek Levels and Channels 指标!!! 忘掉像马戏团表演一样玩多个指标的杂耍吧。我们把你需要的一切都打包成一场精彩的表演: 价格水平?搞定! 价格通道?你说对了! 价格VWAP?没错! 平衡交易量?都在这里! 还有最棒的是什么?警报和推送通知,它们会比双倍浓缩咖啡更快地唤醒你!️ 你的图表即将成为交易机会的藏宝图: 看看当前价格在哪里,还有所有酷炫的水平线、通道和VWAP。 评估平衡交易量 - 它在跳熊市之舞还是牛市探戈?看看谁占上风:买家还是卖家。 上下指向的箭头像外汇狂欢派对?那显示的是买家或卖家不断增长的交易量。 像井字游戏一样交叉你图表的线条?那些是你的水平线和通道,朋友。 但是等等,还有更多! 认识 Glimpz ,你进入大玩家游戏的VIP通行证。为什么要与鲸鱼对抗,当你可以和它们一起游泳?来自 glimpz.net 的 Glimpz 让你窥探市场大亨的策略。这就像拥有一个交易水晶球,不过不用穿占卜师的服装。 交易风格?我们的花样比高级冰淇淋店还多: 在
FREE
MA Dev Chanel
Alexandr Gladkiy
Индикатор показывает максимальное отклонение от скользящей средней за заданный период. Границы канала могут послужить своего рода зонами перекупленности/перепроданности, от которых может произойти откат цены к центру канала. За этими уровнями и стоит искать дополнительные сигналы для входа в сделку.  В настройках индикатора всего 2 параметра -  период, за который будет расчитываться индикатор и метод усреднения скользящей средней.
FREE
Email Drawdown Alert
Roman Starostin
5 (12)
Free informative Indicator-helper. It'll be usefull for traders who trade many symbols or using grid systems (Averaging or Martingale). Indicator counts drawdown as percent and currency separate. It has a number of settings: Count deposite drawdown according equity value and send e-mail or notifications to user if DD more than set; Sending e-mail when max open orders reached; Shows price and remaining pips amount before MarginCall on current chart and Account generally; Display summary trade lot
FREE
Note: this product is a free limited version of the full featured product Currency Timeframe Strength Matrix . It only includes AUD, CAD, CHF currencies instead of all 8 currencies. It includes only 5S, 1M, 5M time frames instead of all 8 (5S, 1M, 5M, 15M, 30M, 1H, 4H, 1D). What is it? The Currency TimeFrame Strength Matrix is a simple and comprehensive Forex map that gives a snapshot of what is happening in the Forex market at the very present time. It illustrates the strength and momentum ch
FREE
该产品的买家也购买
Gann Made Easy
Oleg Rodin
4.84 (171)
Gann Made Easy 是一个专业且易于使用的外汇交易系统,它基于使用先生理论的最佳交易原则。 W.D.江恩。该指标提供准确的买入和卖出信号,包括止损和获利水平。您甚至可以使用推送通知在旅途中进行交易。 购买后请联系我,即可免费获得交易指导和超棒的额外指标! 您可能已经多次听说过江恩交易方法。通常 Gann 的理论不仅对于新手交易者而且对于那些已经有一定交易经验的人来说都是非常复杂的东西。这是因为江恩的交易方法在理论上并不那么容易应用。我花了几年时间来完善这些知识,并将最好的原则应用到我的外汇指标中。 该指标非常易于应用。您所需要的只是将其附加到您的图表并遵循简单的交易建议。该指标不断进行市场分析工作并寻找交易机会。当它检测到一个好的入口点时,它会为您提供一个箭头信号。该指标还显示止损和获利水平。 换句话说,当您像先生一样进行交易时,该指标会为您提供最佳江恩建议。江恩亲自告诉你此时此刻该做什么。但最好的部分是您不需要了解任何有关江恩交易原则的知识,因为该指标会为您完成整个市场分析工作。
SR Liquidity
Oleg Rodin
5 (1)
SR Liquidity 是一款旨在揭示市场流动性高度集中且价格反应最剧烈的隐蔽区域的交易指标。这些特殊的流动性区域充当着强有力的支撑位与阻力位,为您清晰呈现市场最可能发生反转的位置。 SR Liquidity 指标并非简单地绘制常规的支撑/阻力线,而是通过分析实际的价格行为,识别买卖压力积聚的区域。这些区域实际上是推动市场真实波动的流动性池。通过在图表上直观呈现这些区域,该指标能助您在价格反应发生前预判走势——这意味着它实际上能够预测价格方向可能发生的变化。它将原始的价格行为转化为清晰且具实操价值的市场蓝图,标示出那些可能成为市场转折点的关键价位。 该指标适用于任何交易品种和时间周期——包括外汇、指数、金属、加密货币等。支持任意时间周期。 购买后请联系我,以获取交易指南及免费赠送的优质附加指标!
Neuro Poseidon MT4
Daria Rezueva
4.8 (45)
Neuro Poseidon is a new indicator by Daria Rezueva. It combines precise trading signals with adaptive TP/SL levels - creating best possible trades as a result! Message me and get  Neuro Poseidon Assistant  as a gift to automize your trading process! What makes it stand out? 1. Proven profitability on all assets and timeframes 2. Only confirmed BUY and SELL signals present on the chart 3. Adaptive TP & SL levels generated by the software for each trade 4. Easy to understand - suitable for all
M1 Sniper
Oleg Rodin
5 (27)
M1 SNIPER 是一款易于使用的交易指标系统。它是一个专为 M1 时间框架设计的箭头指标。该指标可以作为独立的系统在 M1 时间框架下进行剥头皮交易,也可以作为您现有交易系统的一部分使用。虽然该交易系统专为 M1 时间框架交易而设计,但它也可以用于其他时间框架。我最初设计此方法是为了交易 XAUUSD 和 BTCUSD。但我发现这种方法在其他市场交易中也同样有用。 指标信号既可以顺势交易,也可以逆势交易。我教授一种特殊的交易技巧,帮助您利用指标信号进行双向交易。该方法基于使用特殊的动态支撑位和阻力位区域。 购买后,您可以立即下载 M1 SNIPER 箭头指标。此外,我还为所有 M1 SNIPER 工具用户免费提供下方屏幕截图所示的 Apollo Dynamic SR 指标!这两个指标的组合可以帮助您更轻松、更准确地利用 M1 时间框架进行交易。 购买后请联系我,免费获取交易提示和奖励指标! 祝您交易成功!
Atomic Analyst
Issam Kassas
5 (11)
本产品已针对 2026 年市场进行更新,并针对最新 MT5 版本进行了优化。 价格更新通知: Atomic Analyst 目前价格为 $99 。 接下来的 30 次购买 后,价格将上涨至 $199 。 特别优惠: 购买 Atomic Analyst 后,请发送私信给我,即可免费领取 Smart Universal EA ,并将您的 Atomic Analyst 信号转换为自动交易。 Atomic Analyst 是一款不重绘、不回绘、不延迟的 Price Action 交易指标,专为手动交易、清晰信号和 EA 自动化而设计。 User manual: settings, inputs and strategy.      &   User Manual PDF . 它分析价格行为、强度、动能、多周期方向和高级过滤器,帮助交易者减少噪音,避免弱势交易机会,并做出更有结构的交易决策。 该指标将复杂的市场计算转换为简单的视觉信号、彩色K线、趋势读数、止损水平和多个止盈区域,使交易者能够快速理解并应用于真实市场环境。 主要交易用途: 剥头皮和日内交易: 专为快速决策、清晰箭头、提醒、K线
BTMM State Engine Pro MT4
Garry James Goodchild
BTMM State Engine Pro by G-Labs — Beat The Market Maker indicator for MetaTrader 4. Asian session range, London and New York kill zones, level progression (L1/L2/L3), peak formation detection (PFH/PFL), entry signals, and a multi-pair scanner from one chart. Stop scanning charts one pair at a time. The State Engine tracks the BTMM daily cycle automatically — Asian box, room boundaries, level blocks, peak formations, and filtered entries — while the scanner dashboard shows level, peak status,
KURAMA GOLD SIGNAL PRO(MT4)— 7层过滤 · 自动止盈止损 · 质量评分 · 信号历史保存 | 完整的XAUUSD交易系统 实时不重绘。信号出现的瞬间,箭头、入场、止盈、止损当场锁定,之后绝不移动。你交易的就是这个实时信号。而且在v7.20中,每一个真正发出的信号都会自动保存,并在重启后精确还原。 购买者专属赠品 购买永久授权,即可免费获得 AI Zone Radar(价值$59)+ 完整PDF手册。在产品价格之外,额外附赠价值$59的赠品。购买后在MQL5上给我留言即可。 AI Zone Radar: https://www.mql5.com/en/market/product/175834 在黄金交易者社区中被实际使用,因精度与易用性而广受好评。 你的难题 —— 以及解决方案 黄金一天波动$30–$50。你知道机会就在那里。但这些情况是否似曾相识: - 入场太早,价格逆行$10后才朝你的方
IQ Gold Gann Levels
INTRAQUOTES
5 (5)
Presenting one-of-a-kind Gann Indicator for XAUUSD IQ Gold Gann Levels is a non-repainting, precision tool designed exclusively for XAUUSD intraday trading. It uses W.D. Gann’s square root method to plot real-time support and resistance levels, helping traders spot high-probability entries with confidence and clarity. William Delbert Gann (W.D. Gann) was an exceptional market analyst whose trading technique was based on a complex blend of mathematics, geometry, astrology, and ancient calculation
Super Signal – Skyblade Edition 專業級無重繪 / 無延遲趨勢信號系統,擁有卓越勝率 | 適用於 MT4 / MT5 在較低的時間週期上效果最佳,例如 1 分鐘、5 分鐘與 15 分鐘圖表。 核心特色: Super Signal – Skyblade Edition 是一套專為趨勢交易設計的智能信號系統。 其採用多重濾波邏輯,僅篩選出具有明確方向性、動能強勁且波動結構健康的走勢進場點。 本系統 不預測高點或低點 ,只有在同時滿足以下三項條件時才會觸發交易信號: 趨勢方向明確 動能持續增強 波動率結構穩定 此外,系統還結合市場流動性分析,以進一步提升信號的準確性與觸發時機。 信號特性: 所有箭頭信號皆為 100% 無重繪,無延遲 信號一旦出現即固定於圖表,不會閃爍或消失 提供圖表箭頭、資訊面板、彈出通知、聲音提示及推播訊息 支援 EA 呼叫(Buffer 輸出),可整合至自動化交易或信號跟單系統 提供預設參數模板,免調整即可使用,適合新手快速上手 總結: Super Signal – Skyblade Edition 是一款邏輯清晰、穩定高效的專業趨勢型
A. 什么是 A2SR ?   * 这是一个领先的技术指标(没有重绘,没有滞后)。  -  指导 : -- 在  https://www.mql5.com/en/blogs/post/734748/page4#comment_16532516 -- 和  https://www.mql5.com/en/users/yohana/blog .. MT5 version:  https://www.mql5.com/en/market/product/140111 A2SR 在确定支撑(需求)和阻力(供应)水平方面有一种特殊的技术。 与我们在网上看到的普通方式不同,A2SR 在确定实际 SR 级别时有一个独创的概念。 原技术不是从网上拿来的,也没有在网上公开过。 A2SR 将根据您的交易风格自动选择 SR 级别。 即使您正在更改时间范围,但 SR 级别仍将保留在其位置上。 因为实际的 SR 不是从你使用的时间范围内获得的。 A2SR 拥有完整的交易工具 。 实际支持(需求)和阻力(供应)的真正概念。 新闻事件和央行讲话的市场情绪。 新闻事件和趋势的主要货币强度 (MCS) 的真正概
ORB Seeker
Marcela Goncalves De Oliveira
限时折扣价! 仅售99美元! 购买后请联系我以获取奖励的 ORB Seeker EA 和个人优化设置文件。 自信地捕捉干净利落的比赛片段! ORB Seeker 是一款专业的开盘区间突破 (ORB) 指标,专为追求准确性、简洁性、灵活性和清晰图表结构的交易者而设计。 它能自动绘制任何交易品种的盘前或自定义交易时段区间,然后给出清晰的突破信号,包括入场点、止损点、止盈点以及可选的50%部分止盈位。所有数据均实时计算并直接显示在图表上。 您可以选择交易伦敦开盘、纽约交易时段、亚洲交易时段,或者您自定义的交易时段。ORB Seeker 会根据您选择的交易时段自动调整,让您精准掌握市场波动范围、突破位和交易位的位置。 每次购买均免费赠送 ORB Seeker EA 智能交易系统。该 EA 系统读取指标的突破信号并可自动下单,您可以选择手动交易,也可以让 EA 系统根据指标的信号逻辑自动处理入场。   为什么选择 ORB Seeker 支持多个交易时段 - 您可以自行设置伦敦、纽约、亚洲或自定义交易时段的盘前交易时间和交易时段。 完整的突破视觉效果 - 交易最高点和最低点线、范围框、突破箭头
Price Action Sniper
Elmira Memish
5 (3)
Price Action Sniper is designed to trade the Price Action on the desired chart time frame. - Trend Reversals. - Trend Continuation. - Brekaouts. - Good tool for Binary Options Price action forms the basis for all technical analysis of a currency pair, commodity or other asset chart. Many short-term traders rely exclusively on price action and the formations and trends extrapolated from it to make trading decisions. Technical analysis as a practice is a derivative of price action since it uses p
Built-in multi-symbol scanner — traffic-light grid for up to 30 pairs across four timeframes. No separate scanner file required. BUY, SELL, WAIT cells with confluence score and recent structure event. Full alignment with AI Trade Idea — current chart cell reads live engine data so scanner, dashboard, and AI panel always show the same verdict, score, and reason. Per-cell explain popup — four-section breakdown of what is happening, how the score was built, what to look for, and what to watch out
PRO Renko System
Oleg Rodin
5 (31)
PRO Renko Arrow Based System for trading renko charts.  准确的信号交易任何外汇工具. 另外,我将免费提供系统的附加模块! PRO Renko系统是RENKO图表上高度准确的交易系统。该系统是通用的。 该交易系统可应用于各种交易工具。 该系统有效地中和了所谓的市场噪音,打开了获得准确反转信号的通道。 该指标易于使用,只有一个参数负责产生信号。 您可以很容易地使算法适应您感兴趣的交易工具和renko酒吧的大小。 我很乐意通过提供任何咨询支持来帮助所有客户有效地使用该指标。 祝您交易成功!购买后,立即写信给我! 我将与您分享我的建议和我的renko发电机。 另外,我将免费提供系统的附加模块!
Currency Strength Exotics
Bernhard Schweigert
4.88 (33)
目前8折优惠! 对任何新手或专家交易者来说都是最好的解决方案! 这个指标是专门用来显示任何符号的货币强度,如异国货币对、商品、指数或期货。它是同类产品中的第一个,任何符号都可以添加到第9行,以显示黄金、白银、石油、DAX、US30、MXN、TRY、CNH等的真实货币强度。这是一个独特的、高质量的、负担得起的交易工具,因为我们已经纳入了一些专有的功能和一个新的公式。想象一下,你的交易将如何改善,因为你能够准确地确定新趋势或剥头皮机会的触发点? 用户手册:点击这里   https://www.mql5.com/en/blogs/post/708876 它适用于所有时间框架。你将很快能够看到TREND! 根据新的基础算法设计,它使识别和确认潜在交易变得更加容易。这是因为它以图形方式显示了8种主要货币和一种符号的强弱。 该指标显示了8种主要货币(澳元加元瑞士法郎欧元英镑日元新西兰美元)的强弱线,再加上一个符号! 该指标显示了符号的真实价值。例如:对于XAUUSD(黄金):价格以美元报价。如果黄金在上涨,你怎么能知道是黄金的强势还是美元的弱势?只有当黄金走强时,我们才会进行交易。该指
Scalper Inside PRO
Alexey Minkov
4.74 (68)
Scalper Inside PRO 帮你分析日内趋势,在入场前就把交易规划好。核心是三套专属策略,让你更精准地读懂市场。信号一出现,指标就自动判断行情方向并计算关键价位,你能提前看到潜在入场点、预期的止损以及多个止盈位。详尽的绩效统计会展示不同品种和策略在历史上的表现,帮你根据当前行情挑选合适的资产。它既可以作为独立的剥头皮工具,也可以融入你的系统,或者作为你自己 EA 的基础。运行于 MetaTrader 4 平台。 指标会直接在图表上标出入场、三个止盈位 - TP1、TP2、TP3 以及一个可选止损。你甚至可以接入自己的箭头指标,检验它们的统计数据和盈利能力。 购买后请直接联系我,即可获得指标的专属附赠 add-ons、更多关于实盘运用的说明,以及把它正确接入你自己交易系统和 EA 的帮助。 指标主要功能 内置三套专属交易策略,可即时切换。 箭头信号出现后即时计算价位:入场以及 TP1、TP2、TP3 多级目标立刻显示,方便你提前规划交易。开启手动或自动计算后,会显示止损位。 三套策略均内置优化模块:自动把参数适配到当前品种和周期,帮你快速筛选资产(仅在实时状态下可用)。 HTF
PZ Turning Points MT4
PZ TRADING SLU
1 (1)
该指标检查不同时期分形的价格结构,以确定市场中可能的反转点,从而为已经具有基本或技术估值模型的仓位交易者提供时机。与它的弟弟 Reversal Fractals不同 ,该指标不会因为所选时期而错过反转,并且会以之字形方式找到反转分形,而忽略那些没有足够动量来引发持续价格波动的反转。 [ 安装指南 | 更新指南 | 故障排除 | 常见问题 | 所有产品 ] 转折点可以开始长期趋势 指示器不重涂 它实现了各种警报 可自定义的颜色和尺寸 该指示符是无功或滞后信号,因为分形是奇数个条形的地层,是中间地带中最高或最低的条形,并且指示符在分形中的所有条形都闭合时绘制。但是,具有预先设定的方向偏差的交易者会发现该指标非常有用,可以提早进入切入点。 该指标既不是下探信号指标,也不是完整的交易系统。请不要这样评价或审查它。 输入参数 最小分形数:分形上的最小条形数。必须为奇数,例如3、5、7、9、11、13,... 最大分形:分形上的最大条形数量。必须为奇数,例如3、5、7、9、11、13 ... 最大历史柱数:指标加载时评估的过去柱数。 颜色:自定义箭头和线条的颜色和大小。 警报:启用或禁用各
Level Breakout Indicator is a technical analysis product that works from upper and lower boundaries, which can determine the direction of the trend. Works on candle 0 without redrawing or delays. In its work, it uses a system of different indicators, the parameters of which have already been configured and combined into a single parameter - “ Scale ”, which performs gradation of periods. The indicator is easy to use, does not require any calculations, using a single parameter you need to select
目前八折优惠! 对任何新手或专家交易者来说都是最好的解决方案! 这个仪表板软件适用于28种货币对。它基于我们的两个主要指标(高级货币强度28和高级货币冲动)。它对整个外汇市场提供了一个伟大的概述。它显示高级货币强度值,货币运动速度和28个外汇对在所有(9)时间段的信号。想象一下,当你可以使用图表上的单一指标观察整个市场,以确定趋势和或剥头皮的机会时,你的交易将得到改善 我们已经在这个指标中建立了一些功能,使你更容易识别强势和弱势货币,同时识别和确认潜在的交易。该指标以图形方式显示货币的强势或弱势是增加还是减少,以及它在所有时间段的表现。 增加的新功能是动态市场斐波那契水平,它适应当前的市场条件变化,这是一个已经在我们的高级货币强度28和高级货币冲动指标中使用的成熟的加分项。 在交易时,总是将弱势货币和强势货币配对,这个新指标将帮助你做到这一点。 用户手册:点击这里  https://www.mql5.com/en/blogs/post/708783 特点  显示每个时间段的ACS28和GAP-speed(冲动)的货币强度值。 列:颜色代码以7种颜色显示货币强度:强势
该指标通过忽略突然的波动和市场噪音,以无与伦比的可靠性跟踪市场趋势。它被设计用于趋势交易日内图表和较小的时间范围。其获胜率约为85%。 [ 安装指南 | 更新指南 | 故障排除 | 常见问题 | 所有产品 ] 极易交易 查找超卖/超买情况 随时享受无噪音交易 避免在盘中图表中被鞭打 该指标分析其自身的质量和性能 它实现了一个多时间仪表板 该指标适用于低时限交易,因为它通过降低平均价格周围的市场噪音而忽略了突然的价格飙升或修正。 该指标根本不需要优化 它实现了一个多时间仪表板 它实现了电子邮件/声音/推送警报 指示器为不可重涂和不可重涂 该指标实现了适合于较小时间范围的趋势跟踪方向,该趋势可以渗透到较高时间范围内的非常长的趋势中,从而扩大了您的收益。 指标剖析 指标显示一条彩色的线,周围环绕着一个价格带。彩色线是有价证券的平均价格,而价格带表示超买/超卖水平。如果平均价格为蓝色,则您应该在市场没有超买的情况下寻找多头交易;如果平均价格为红色,则应该在市场没有超卖的情况下寻找空头交易。 指标的趋势变化并不表示立即进行交易或完成相反交易的信号!这些频段用于计时。 技术信息 指标的评估
GOLD Impulse with Alert
Bernhard Schweigert
4.67 (12)
这个指标是我们2个产品 Advanced Currency IMPULSE with ALERT  +   Currency Strength Exotics 的一个超级组合。 它适用于所有时间框架,并以图形方式显示8种主要货币和一种符号的强势或弱势冲动! 该指标专门用于显示任何符号的货币强度加速,如黄金、异国货币对、商品、指数或期货。这是它的第一个指标,任何符号都可以被添加到第9行,以显示黄金、白银、石油、DAX、US30、MXN、TRY、CNH等的真实货币强度加速(冲动或速度)。 建立在新的基础算法上,它使识别和确认潜在的交易更加容易。这是因为它以图形方式显示了一种货币的强势或弱势是否正在加速,并测量了这种加速的速度--把它想象成你汽车中的速度表。当你加速时,事情显然会发生得更快,这在外汇市场上也是一样的,即如果你配对的货币正在向相反的方向加速,你就会发现一个潜在的有利可图的交易。 动态市场斐波那契28水平被用作警报触发器,将适应市场活动。如果冲动击中黄色触发线,你将收到警报。然后你就知道作为一个交易员应该做什么。货币对和方向已经给出。只需点击警报按钮,就可以切换到该货
Adopt market correlation and indicator resonance Here are some trading recommendations based on the current market conditions: (1) Note: It doesn't mean you have a perfect deal, but rather helps you avoid bad trades (2) Why traditional indicators are prone to distortion. For example, the 10-day moving average is calculated by calculating the average price of the top 10 candlesticks. Result: I prove I want to rise, and the signal is easily distorted. This indicator adopts a self-proof + corrob
Mechanism Trend
Vitalii Zakharuk
The Mechanism Trend indicator is a hybrid indicator that shows the moments for entering the market with arrows. This indicator was created on the basis of the original indicators for searching for extreme points, the indicator is well suited for determining a reversal or a large sharp jerk to one side. When the trend changes, the Mechanism Trend indicator uses color signaling: green - when changing from a downtrend to an uptrend, and red - vice versa, to a downtrend. You can use the indicator
Dynamic Forex28 Navigator
Bernhard Schweigert
4.43 (7)
Dynamic Forex28 Navigator - 下一代外汇交易工具。 当前 49% 折扣。 Dynamic Forex28 Navigator 是我们长期流行的指标的演变,将三种功能合二为一: 高级货币强度 28 指标 (695 条评论)+ 高级货币 IMPULSE 带警报 (520 条评论)+ CS28 组合信号(奖励)。 有关指标的详细信息 https://www.mql5.com/en/blogs/post/758844 下一代强度指标提供什么? 您喜欢的原始指标的一切,现在通过新功能和更高的精度进行了增强。 主要特点: 专有货币强度公式。  所有时间范围内的平滑和准确的强度线。 非常适合识别趋势和精确进入。 动态市场斐波那契水平(市场斐波那契)。  此指标独有的独特功能。 斐波那契应用于货币强度,而不是价格图表。 适应实时市场活动以获得准确的反转区域。 实时市场动量。  第 9 行显示市场是活跃还是被动。 对于定时交易至关重要。 全面的警报和显示。  每种货币最强的买入和卖出动量。 ​​28 对的双重动量买入和卖出。 超买/超卖警告外部范围和止损。 反转
Currency Strength Matrix
Raymond Gilmour
4.5 (26)
THE ONLY CURRENCY STRENGTH INDICATOR THAT IS BASED ON PRICE ACTION. DESIGNED FOR TREND, MOMENTUM & REVERSAL TRADERS This indicator  reads price action to confirm trend and strength . Advanced multi-currency and multi-time frame indicator that shows you simply by looking at one chart, every currency pair that is trending and the strongest and weakest currencies driving those trends. For full details on how to use this indicator, and also how to get a FREE chart tool, please see user manual HERE
Currency Strength Wizard
Oleg Rodin
4.85 (60)
货币强度向导是一个非常强大的指标,为您提供成功交易的一体化解决方案。该指标使用多个时间范围内所有货币的数据来计算这个或那个外汇对的力量。此数据以易于使用的货币指数和货币电力线的形式表示,您可以使用它们来查看这种或那种货币的力量。 您所需要的只是将指标附加到您要交易的图表上,该指标将向您显示您交易的货币的真实强度。该指标还向您显示买卖量压力的极值,您可以在顺势交易时利用这些压力。该指标还显示了基于斐波那契的可能目标。该指标可用于各种交易时间范围。该指标支持各种货币对的交易。 该指标为您提供所有类型的警报,包括推送通知。 购买后请联系我。我将与您分享我的交易技巧,并免费为您提供丰厚的红利指标! 祝您交易愉快,获利丰厚!
Smart Trend Trading System
Issam Kassas
4.75 (8)
本产品已针对 2026 年市场进行更新,并针对最新 MT5 版本进行了优化。 价格更新通知: Smart Trend Trading System 目前价格为 $99 。 接下来的 30 次购买 后,价格将上涨至 $199 。 特别优惠: 购买 Smart Trend Trading System 后,请发送私信给我,即可免费领取 Smart Universal EA ,并将您的 Smart Trend 信号转换为自动交易。 Smart Trend Trading System 是一套完整的交易系统,具备不重绘、不回绘、不延迟的特点,专为希望获得更清晰信号、更准确趋势方向以及更有组织交易方式的交易者打造。 Online course , manual and [download presets] . 它将 10 多种交易工具 整合到一个系统中,包括趋势检测、反转区域、Smart Cloud、移动止损逻辑、支撑与阻力、K线着色、提醒以及多周期分析。 该系统旨在帮助您应对不同的市场环境: 趋势市场: 识别主要趋势,发现回调,跟随动能,并通过止损指导和移动止损选项寻找更清晰的入场机会。
Advanced Supply Demand
Bernhard Schweigert
4.91 (302)
现在优惠 30%! 任何新手或专业交易者的最佳解决方案! 该指标是一款独特、高质量、且价格合理的交易工具,因为我们已经整合了许多专有功能和新公式。 依据此更新,您将能够显示双重时间帧区域。 您不仅可以显示一个较高的时间帧,还可以同时显示图表时间帧,加上更高的时间帧:显示嵌套时区。 供需双方所有交易者都会喜欢它。 :) 重要信息披露 高级供需的最大潜力,请访问 https://www.mql5.com/zh/blogs/post/720245   想象您的交易如何得以改善,是因为您能够精准定位入场或目标位吗? 构建于新的底层算法,它可以更轻松地识别出买卖双方之间的潜在失衡。 这是因为它以图形方式展示供需最强劲区域,及其过去的表现(显示旧区域)。 这些功能旨在帮助您更轻松地发现最佳入场区域和价位。 现在您可以针对您的交易品种和时间帧来优化和编辑区域强度! 高级供需指标适用于所有产品和时间帧。 它是一个新的公式,非常新的功能是两个区域强度函数可由用户输入进行调整! 这在交易中是一大优势。 当您学习如何使用专有功能,例如带有价格游离最小 X 因子的区域强度时,您能够判断该区域强劲与否。 供需
Supply and Demand Dashboard PRO
Bernhard Schweigert
4.81 (21)
目前八折优惠! 这个仪表板是一个非常强大的软件,可用于多个符号和多达9个时间段。 它是基于我们的主要指标(最佳评论:高级供应需求)。 Advanced Supply Demand 该仪表板提供了一个伟大的概述。它显示。   筛选后的供需值,包括区域强度评级。 区间内和区间外的点位距离。 它突出了嵌套的区域。 在所有(9个)时间段内,它对所选符号发出4种警报。 它是高度可配置的,以满足您的个人需求! 您的利益! 对每个交易者来说,最重要的问题是。 什么是入市的最佳水平? 在强大的供应/需求区域内或附近进入你的交易,以获得最佳的成功机会和风险/回报。 我的止损的最佳位置是哪里? 把你的止损放在强势供应/需求区的下方/上方是最安全的。 我的最佳盈利目标是什么? 你的退出策略和你的进入策略一样重要,了解更高的时间框架图可以帮助你。对于买入,使用下一个供应区作为目标,对于卖出,使用下一个需求区作为目标。在回撤到供应区或需求区时进场,以确保有足够的利润空间,达到更高的时间框架的供应和需求,将增加你的利润。 为什么我们要过滤强区和弱区? 不平衡性越大,价格的变动就
Cycle Sniper
Elmira Memish
4.39 (36)
Please contact us after your purchase and we will send you the complimentary indicators to complete the system Cycle Sniper is not a holy grail but when you use it in a system which is explained in the videos, you will feel the difference. If you are not willing to focus on the charts designed with Cycle Sniper and other free tools we provide, we recommend not buying this indicator. We recommend watching the videos about the indiactor and system before purchasing. Videos, settings  and descri
作者的更多信息
MagicTrigger MT4
Mostafa Ghanbari
MagicTrigger — 多周期 HD/RD 背离确认指标 MagicTrigger 是一款多周期背离引擎,它在较高周期(HD)上寻找结构性背离,并等待同一价格区域内较低周期(RD)出现相匹配的背离来加以确认。只有当较高周期的摆动结构与较低周期的确认相互吻合时,指标才会标记信号,并同时给出建议的入场触发点、止损位以及两个目标位。 工作原理 指标会自动扫描当前图表周期之上和之下的一系列周期。在较高周期上,它寻找价格摆动点与平滑震荡线之间的背离形态(即"HD"背离)。随后检查在 HD 结构所定义的时间与价格区域内,较低周期是否也出现相同方向的背离(即"RD"背离)。只有当达到所需的最小数量的较低周期确认了较高周期的结构时,才会生成信号,从而减少孤立的单一周期背离信号。 主要功能 基于当前图表周期自动构建多周期扫描链,相同逻辑可自适应任何加载的周期。 可调节的历史扫描深度(History Scan Depth),用于控制图表加载时分析的K线数量。 HD Divergence Range 与 RD Divergence Range 参数用于控制每次背离所使用摆动点之间的最大距离——范围越窄
Unlock the power of "Psychological Numbers" with RoundLevel . Large financial institutions, banks, and hedge funds don't place orders at random prices; they prefer round numbers (e.g., 1.1000, 105.00, 2000). These levels act as invisible magnets for price action, serving as high-probability support and resistance zones. Key Features: Universal Compatibility: Works perfectly on Forex, Gold (XAUUSD), Indices, and Stocks. Clean Visualization: Automatically draws horizontal levels without cluttering
Persian Ichimoku Pro: The Fibonacci Evolution for MT4 Why settle for 1930s formulas when you can trade with 21st-century precision? Most traders fail with Ichimoku because they use static, outdated settings.   Persian Ichimoku Pro   breaks these limits by integrating   Advanced Fibonacci Mathematics   and the exclusive   Future Quality Line —a combination never seen before in standard indicators. ### THE "UNFAIR ADVANTAGE": WHAT’S INSIDE? 1. The Quality Line (Your Trend Sentinel) This is the "S
Cross Alert MT4
Mostafa Ghanbari
MGH-CrossAlert — Multi-Line, Multi-Timeframe Crossover Alert Indicator MGH-CrossAlert is a crossover detection indicator for MetaTrader 5 that monitors two user-selected lines and generates alerts when they cross or reach equality. Unlike standard moving average crossover tools, this indicator supports a wide range of line types and allows each line to be drawn from an independent timeframe. Supported Line Types Each of the two monitored lines can be configured independently as one of the follo
Multi Macd RD MT4
Mostafa Ghanbari
MGH-MultiMACD-RD — 多周期 MACD 背离指标(MT4) 概述 MGH-MultiMACD-RD 是一款适用于 MetaTrader 4 的多周期 MACD 背离指标。它可在 单一图表上同时监控最多 6 个时间周期 ,检测常规背离与隐藏背离,并在背离得到确认时发出提醒。 该指标的开发旨在解决标准 MACD 背离工具中三个常见的局限:单周期分析、信号重绘以及背离线绘制不一致。 主要功能 多周期分析 该指标在单一图表窗口中显示当前周期以及最多 5 个更高周期的 MACD 数据。每个周期分配不同的颜色以便于识别。周期可通过设置面板或图表按钮(1–6)启用或禁用。 重绘控制 信号可配置为在 K 线 0(实时)或 K 线 1(已确认、已收盘的 K 线)上触发。设为 K 线 1 时,信号不会在事后被重新绘制。 背离检测 该指标可在所有活动周期上检测常规背离与隐藏背离。「Increase Divergence Range」参数可延长回溯周期,以捕捉更远摆动点之间的背离。 多周期共振(Confluence) 当两个或更多周期的背离出现在同一价格区域内时,指标会突出显示这种重叠。交易者
Multi Macd HD MT4
Mostafa Ghanbari
MGH-MultiMACD-HD — 多周期 MACD 隐藏背离检测器 大多数交易者从未看到的趋势延续信号——现在可在 6 个时间周期上自动检测。 概述 常规背离告诉您趋势何时可能反转。隐藏背离告诉您趋势何时即将延续——这是专业趋势跟踪交易者最依赖的信号。问题在于,隐藏背离比常规背离明显更难发现,而 MQL5 Market 上几乎没有任何指标能够在多个时间周期上同时准确检测它。 MGH-MultiMACD-HD 彻底改变了这一点。它构建于与 MGH-MultiMACD-RD 相同的专有多周期引擎之上,专门致力于隐藏背离检测—— 同时监控最多 6 个时间周期 ,在价格图表和 MACD 窗口上绘制精确的背离线,并在确认的形态形成时立即提醒您。这一切均无重绘。 什么是隐藏背离——它为何重要? 大多数交易者在学习初期就掌握了常规背离。学习隐藏背离的人较少。而几乎没有人拥有能够可靠检测它的工具。 隐藏看涨背离 出现于价格创出更高的低点而 MACD 创出更低的低点时。它表明:尽管表面上出现回调,潜在的看涨动能依然完好——趋势很可能向上恢复。 隐藏看跌背离 出现于价格创出更低的高点而 MACD 创出
Multi Stoch MT4
Mostafa Ghanbari
MGH-MultiStoch — 多周期趋势识别与波浪分析 MGH-MultiStoch 是一款多周期趋势指标,可在 单一窗口中同时显示最多 6 个时间周期 。它帮助交易者跨周期确认趋势方向、直观地数清市场波浪,并根据更高周期的交叉构建前瞻性的波浪情景。 该指标采用专为本产品开发的自定义多周期计算方法。同时适用于 MetaTrader 4 和 MetaTrader 5 。 它要解决的问题 交易中一个常见的难题是:在当前图表上收到的信号缺乏更高周期的确认。设计自动交易系统的经验表明,正确的多周期一致性是交易系统最终结果的一个重要因素。 MGH-MultiStoch 在单一窗口中显示最多 6 个周期的趋势状态。这使您能够快速检查工作周期上的信号是否与更大的市场结构一致。 用作确认过滤器 该指标可作为趋势跟踪策略和反转策略的确认工具: 趋势策略: 在入场前,要求一两个更高周期与您的信号方向一致。该过滤器可以提升许多交易系统的信号质量。 反转策略: 观察更高周期上出现新交叉的时刻,这是方向可能改变的早期结构性信号。 波浪分析: 线条的交叉将市场划分为多个区段,使艾略特波浪计数更简单、更直观。
MagicLines MT4
Mostafa Ghanbari
MGH-MagicLine — 趋势与多时间框架背离一体化工具 MagicLine 将趋势识别与背离分析整合到单一指标中——是同时运行 MultiStoch 和 MultiMACD 的精炼替代方案,输出更清晰、延迟更低。 它是一款 确认与分析工具 ,不提供入场点、止盈或止损,而是为几乎任何趋势型策略增添一层强大而灵活的确认,帮助你更清晰地解读市场。 三种线型模式——同一指标 在设置中选择 Line Type ;当前模式会直接显示在指标窗口名称上,让你随时清楚正在查看的内容: Slow — 噪音最低,用于读取长期趋势方向。线条进入 ±0.2 区域时确认主导趋势。 Long — 趋势识别清晰且更具响应性,是日常使用的均衡之选。 Fast — 反应最快,适合剥头皮和日内动量交易。 一个指标,三种不同表现——根据你的时间框架和风格自由调整。 多时间框架线条 最多绘制 6 条独立线条 ,每条对应一个更高的时间框架。 将鼠标悬停在任意线条上即可即时查看其时间框架。 通过图表上的按钮(1–6)开启/关闭每条线。 在同一窗口中同时看到更高时间框架的全局和你的入场时间框架。 常规背离与隐藏背离 将 Di
Elevate your trading with the precision of "Big Figures." Financial markets are not driven by random numbers; they are driven by institutional liquidity. Central banks, hedge funds, and major commercial traders consolidate their orders at whole integer levels (e.g., 1.1000, 2000.00, 150.00). These are the "Psychological Magnets" where the real price action happens. RoundLevel Pro for MetaTrader 5 is a high-performance tool designed to visualize this invisible grid of institutional interest with
Persian Ichimoku Pro: The Fibonacci Evolution for MT5 Why settle for 1930s formulas when you can trade with 21st-century precision? Most traders fail with Ichimoku because they use static, outdated settings. Persian Ichimoku Pro breaks these limits by integrating Advanced Fibonacci Mathematics and the exclusive Future Quality Line —a combination never seen before in standard indicators. ### THE "UNFAIR ADVANTAGE": WHAT’S INSIDE? 1. The Quality Line (Your Trend Sentinel) This is the "Secret Sauce
Cross Alert MT5
Mostafa Ghanbari
MGH-CrossAlert — Multi-Line, Multi-Timeframe Crossover Alert Indicator MGH-CrossAlert is a crossover detection indicator for MetaTrader 5 that monitors two user-selected lines and generates alerts when they cross or reach equality. Unlike standard moving average crossover tools, this indicator supports a wide range of line types and allows each line to be drawn from an independent timeframe. Supported Line Types Each of the two monitored lines can be configured independently as one of the follo
Overview MGH-CrossAlert Histogram is a sub-window histogram indicator for MetaTrader 5. It displays the relationship between any two configurable lines as a color-coded histogram bar by bar, showing which line is dominant, how large the gap between them is, and when a crossover occurs. The histogram runs in a separate sub-window, keeping the price chart uncluttered. How It Works Each bar on the histogram reflects the live relationship between the two selected lines: Green — Line 1 is above Line
Multi Macd RD MT5
Mostafa Ghanbari
MGH-MultiMACD-RD — 多周期 MACD 背离指标(MT5) 概述 MGH-MultiMACD-RD 是一款适用于 MetaTrader 5 的多周期 MACD 背离指标。它可在 单一图表上同时监控最多 6 个时间周期 ,检测常规背离与隐藏背离,并在背离得到确认时发出提醒。 该指标的开发旨在解决标准 MACD 背离工具中三个常见的局限:单周期分析、信号重绘以及背离线绘制不一致。 主要功能 多周期分析 该指标在单一图表窗口中显示当前周期以及最多 5 个更高周期的 MACD 数据。每个周期分配不同的颜色以便于识别。周期可通过设置面板或图表按钮(1–6)启用或禁用。 重绘控制 信号可配置为在 K 线 0(实时)或 K 线 1(已确认、已收盘的 K 线)上触发。设为 K 线 1 时,信号不会在事后被重新绘制。 背离检测 该指标可在所有活动周期上检测常规背离与隐藏背离。「Increase Divergence Range」参数可延长回溯周期,以捕捉更远摆动点之间的背离。 多周期共振(Confluence) 当两个或更多周期的背离出现在同一价格区域内时,指标会突出显示这种重叠。交易者
Multi Macd HD MT5
Mostafa Ghanbari
MGH-MultiMACD-HD — 多周期 MACD 隐藏背离检测器 大多数交易者从未看到的趋势延续信号——现在可在 6 个时间周期上自动检测。 概述 常规背离告诉您趋势何时可能反转。隐藏背离告诉您趋势何时即将延续——这是专业趋势跟踪交易者最依赖的信号。问题在于,隐藏背离比常规背离明显更难发现,而 MQL5 Market 上几乎没有任何指标能够在多个时间周期上同时准确检测它。 MGH-MultiMA CD-HD 彻底改变了这一点。它构建于与 MGH-MultiMACD-RD 相同的专有多周期引擎之上,专门致力于隐藏背离检测—— 同时监控最多 6 个时间周期 ,在价格图表和 MACD 窗口上绘制精确的背离线,并在确认的形态形成时立即提醒您。这一切均无重绘。 什么是隐藏背离——它为何重要? 大多数交易者在学习初期就掌握了常规背离。学习隐藏背离的人较少。而几乎没有人拥有能够可靠检测它的工具。 隐藏看涨背离 出现于价格创出更高的低点而 MACD 创出更低的低点时。它表明:尽管表面上出现回调,潜在的看涨动能依然完好——趋势很可能向上恢复。 隐藏看跌背离 出现于价格创出更低的高点而 MACD
Multi Stoch MT5
Mostafa Ghanbari
MGH-MultiStoch — 多周期趋势识别与波浪分析(MT5) MGH-MultiStoch 是一款多周期趋势指标,可在 单一窗口中同时显示最多 6 个时间周期 。它帮助交易者跨周期确认趋势方向、直观地数清市场波浪,并根据更高周期的交叉构建前瞻性的波浪情景。 这是 MetaTrader 5 版本。由于 MT5 支持更广泛的时间周期,此版本新增了 每条线独立的周期选择 ,让您可以为六条线中的每一条分配独立的周期。 它要解决的问题 交易中一个常见的难题是:在当前图表上收到的信号缺乏更高周期的确认。设计自动交易系统的经验表明,正确的多周期一致性是交易系统最终结果的一个重要因素。 MGH-MultiStoch 在单一窗口中显示最多 6 个周期的趋势状态。这使您能够快速检查工作周期上的信号是否与更大的市场结构一致。 周期选择:Auto 或 From Inputs 此 MT5 版本通过 TimeFrame Type 设置,为六条线的周期提供两种设定方式。 当 TimeFrame Type 设为 Auto 时,指标会自动选择周期,遵循约 4 至 6 倍的相邻周期原则。您无需手动设置任何内容。
MagicLines MT5
Mostafa Ghanbari
MGH-MagicLine — 趋势与多时间框架背离一体化工具 MagicLine 将趋势识别与背离分析整合到单一指标中——是同时运行 MultiStoch 和 MultiMACD 的精炼替代方案,输出更清晰、延迟更低。 它是一款 确认与分析工具 ,不提供入场点、止盈或止损,而是为几乎任何趋势型策略增添一层强大而灵活的确认,帮助你更清晰地解读市场。 三种线型模式——同一指标 在设置中选择 Line Type ;当前模式会直接显示在指标窗口名称上,让你随时清楚正在查看的内容: Slow — 噪音最低,用于读取长期趋势方向。线条进入 ±0.2 区域时确认主导趋势。 Long — 趋势识别清晰且更具响应性,是日常使用的均衡之选。 Fast — 反应最快,适合剥头皮和日内动量交易。 一个指标,三种不同表现——根据你的时间框架和风格自由调整。 多时间框架线条——现已支持完整时间框架控制(MT5) 由于 MetaTrader 5 比 MT4 支持更广泛的时间框架范围,本版本新增了 逐线时间框架选择功能 ——让你完全掌控每条线所代表的时间框架。 设置 TimeFrame Type 来选择时间框架的
MagicTrigger MT5
Mostafa Ghanbari
MagicTrigger — 多周期 HD/RD 背离确认指标(MT5 版) MagicTrigger 是一款多周期背离引擎,它在较高周期(HD)上寻找结构性背离,并等待同一价格区域内较低周期(RD)出现相匹配的背离来加以确认。只有当较高周期的摆动结构与较低周期的确认相互吻合时,指标才会标记信号,并同时给出建议的入场触发点、止损位以及两个目标位。 这款 MetaTrader 5 版本利用 MT5 提供的全部周期范围构建其周期链——除标准周期外,还包括 M2、M3、M4、M6、M12、M20、H2、H3、H6、H8 和 H12。根据指标所加载的周期不同,扫描链最多可包含 15 个周期,相比仅使用标准 MT4 周期集构建的周期链,能够提供明显更细致的多周期结构视图。 工作原理 指标会自动扫描当前图表周期之上和之下的一系列周期。在较高周期上,它寻找价格摆动点与平滑震荡线之间的背离形态(即"HD"背离)。随后检查在 HD 结构所定义的时间与价格区域内,较低周期是否也出现相同方向的背离(即"RD"背离)。只有当达到所需的最小数量的较低周期确认了较高周期的结构时,才会生成信号,从而减少孤立的单一周
筛选:
ali.mo66888
7
ali.mo66888 2026.08.18 13:51 
 

One of the most useful indicators for analyzing market trends.

zahra g.h
161
zahra g.h 2026.08.02 15:10 
 

用户没有留下任何评级信息

Ashkan
167
Ashkan 2026.07.26 19:45 
 

用户没有留下任何评级信息

Hossein Nabi
168
Hossein Nabi 2026.07.23 00:16 
 

用户没有留下任何评级信息

Mostafa Ghanbari
3568
来自开发人员的回复 Mostafa Ghanbari 2026.07.24 04:02
Really appreciate that! Glad the dedication is showing up in tools you find valuable 🙏
1006053015
85
1006053015 2026.07.22 19:59 
 

用户没有留下任何评级信息

Mostafa Ghanbari
3568
来自开发人员的回复 Mostafa Ghanbari 2026.07.24 04:03
Appreciate the thorough feedback! Glad the histogram is making dominance and momentum shifts easy to read, especially in Professional mode. Fair point on the initial setup — good to hear it becomes clear and efficient once configured 🙏
Mohammad Azadjami
159
Mohammad Azadjami 2026.07.21 15:45 
 

用户没有留下任何评级信息

Mostafa Ghanbari
3568
来自开发人员的回复 Mostafa Ghanbari 2026.07.24 04:02
Great to hear! Glad the filtering is helping cut down false signals and the reduced lag is standing out as a strength 🙏
Parsaei
164
Parsaei 2026.07.21 14:05 
 

用户没有留下任何评级信息

Mostafa Ghanbari
3568
来自开发人员的回复 Mostafa Ghanbari 2026.07.24 04:01
Really appreciate that! Glad you're recommending it to fellow traders 🙏
Mahmoudrezakheiri
168
Mahmoudrezakheiri 2026.07.21 04:33 
 

用户没有留下任何评级信息

Mostafa Ghanbari
3568
来自开发人员的回复 Mostafa Ghanbari 2026.07.24 04:01
Thank you so much! Glad the crossover signals are giving you good entries and results 🙏
Vahid Sadeghi
160
Vahid Sadeghi 2026.07.20 12:53 
 

用户没有留下任何评级信息

Mostafa Ghanbari
3568
来自开发人员的回复 Mostafa Ghanbari 2026.07.21 02:48
Really glad to hear this! Setup coming through clean and your multi-timeframe backtesting showing consistently accurate signals with precise entries and exits is great to hear. Excited to see how it performs for you live going forward 🙏
aminaran
168
aminaran 2026.07.19 21:11 
 

用户没有留下任何评级信息

Mostafa Ghanbari
3568
来自开发人员的回复 Mostafa Ghanbari 2026.07.21 02:47
Glad it's simple and useful for you! 🙏
Farzaneh140540
155
Farzaneh140540 2026.07.19 19:00 
 

用户没有留下任何评级信息

Mostafa Ghanbari
3568
来自开发人员的回复 Mostafa Ghanbari 2026.07.21 02:47
You're very welcome, glad you found it valuable! 🙏
alisaadat
167
alisaadat 2026.07.19 17:54 
 

用户没有留下任何评级信息

Mostafa Ghanbari
3568
来自开发人员的回复 Mostafa Ghanbari 2026.07.21 02:46
Glad to hear that! 🙏
Mohammad panahi
169
Mohammad panahi 2026.07.19 16:42 
 

用户没有留下任何评级信息

Mostafa Ghanbari
3568
来自开发人员的回复 Mostafa Ghanbari 2026.07.21 02:46
Really appreciate that! Glad it stood out among the others for its reliability and efficiency 🙏
HAMED HAJI AHMADI
149
HAMED HAJI AHMADI 2026.07.19 16:18 
 

用户没有留下任何评级信息

Mostafa Ghanbari
3568
来自开发人员的回复 Mostafa Ghanbari 2026.07.21 02:45
Glad to hear that! 🙏
alifakhroddin
95
alifakhroddin 2026.07.19 14:50 
 

用户没有留下任何评级信息

Mostafa Ghanbari
3568
来自开发人员的回复 Mostafa Ghanbari 2026.07.21 02:45
Appreciate that! Glad you're finding it useful 🙏
Ben_Ns
164
Ben_Ns 2026.07.19 13:09 
 

用户没有留下任何评级信息

Mostafa Ghanbari
3568
来自开发人员的回复 Mostafa Ghanbari 2026.07.21 02:31
Wonderful to hear! Glad it exceeded expectations. Appreciate the recommendation 🙏
ems ri
170
ems ri 2026.07.19 11:54 
 

用户没有留下任何评级信息

Mostafa Ghanbari
3568
来自开发人员的回复 Mostafa Ghanbari 2026.07.21 02:30
Appreciate the thoughtful feedback! Glad it's supporting a more systematic approach and improving your chart analysis workflow 🙏
mohammadparsa1365
55
mohammadparsa1365 2026.07.19 11:00 
 

用户没有留下任何评级信息

Mostafa Ghanbari
3568
来自开发人员的回复 Mostafa Ghanbari 2026.07.21 02:29
Great to hear! Glad the alerts are coming through timely and reliable, and helping you stay on top of important opportunities without the hassle 🙏
amirght69
154
amirght69 2026.07.19 09:25 
 

用户没有留下任何评级信息

Mostafa Ghanbari
3568
来自开发人员的回复 Mostafa Ghanbari 2026.07.21 02:29
Glad it's working well for you! 🙏
Kambiz Emami
91
Kambiz Emami 2026.07.19 09:10 
 

用户没有留下任何评级信息

Mostafa Ghanbari
3568
来自开发人员的回复 Mostafa Ghanbari 2026.07.21 02:28
So glad to hear that! 🙏
12
回复评论