Mostafa Ghanbari / 个人资料
- 信息
|
不
经验
|
18
产品
|
5
演示版
|
|
0
工作
|
0
信号
|
0
订阅者
|
✅ 软件工程师 | 自定义指标与智能交易系统(EA)开发者
✅ MQL5.com 已发表作者
您好!我是 Mostafa,一名专注的软件工程师,热衷于将复杂的交易策略转化为高性能、可靠的工具。凭借扎实的软件工程学术背景和多年的专业编程经验,我在严谨的软件架构与充满活力的算法交易世界之间架起桥梁。
🛠 技术专长:
语言:精通 MQL4/MQL5、C++、Python 及现代软件开发框架。
算法设计:打造稳健的自定义指标、智能交易系统(EA)和自动化实用工具。
多周期系统:构建先进的趋势、波浪分析和确认工具,在单一窗口中跨多个时间周期运行。
系统优化:专注于低延迟执行、内存管理以及简洁、可维护的代码。
风险管理:集成稳健的资金管理逻辑,以帮助保护资金。
🎯 我的理念:
凭借专业的工程背景,我不仅仅是"编写代码"——我构建可扩展且可靠的交易解决方案。无论是自定义指标、趋势跟踪型 EA,还是多周期分析工具,我都将计算精度、执行速度和逻辑稳定性放在首位。我发布的每一款产品,都按照我对自己交易工具所要求的同等标准来打造。
📍 所在地与服务:
目前常驻安大略省汉密尔顿,与全球客户合作,自动化并优化他们的交易思路。
我致力于清晰的沟通、透明度,并交付符合高专业标准的项目。
在开始开发流程之前,我可提供咨询,与您探讨策略的逻辑——无论是自定义指标还是智能交易系统(EA)。
让我们将您的交易愿景转化为精确的算法现实。
⚜️ 关注我的 MQL5 频道:https://www.mql5.com/en/channels/mghfx
💥 SPECIAL LIMITED-TIME OFFER on MGH-MagicTrigger! 💥
🎯 MT4 Version: ~~$249~~ ➡️ 🏷️ Now only $149!
🎯 MT5 Version: ~~$299~~ ➡️ 🏷️ Now only $199!
⏳ For a limited time only — this discount will NOT be repeated! ⏳
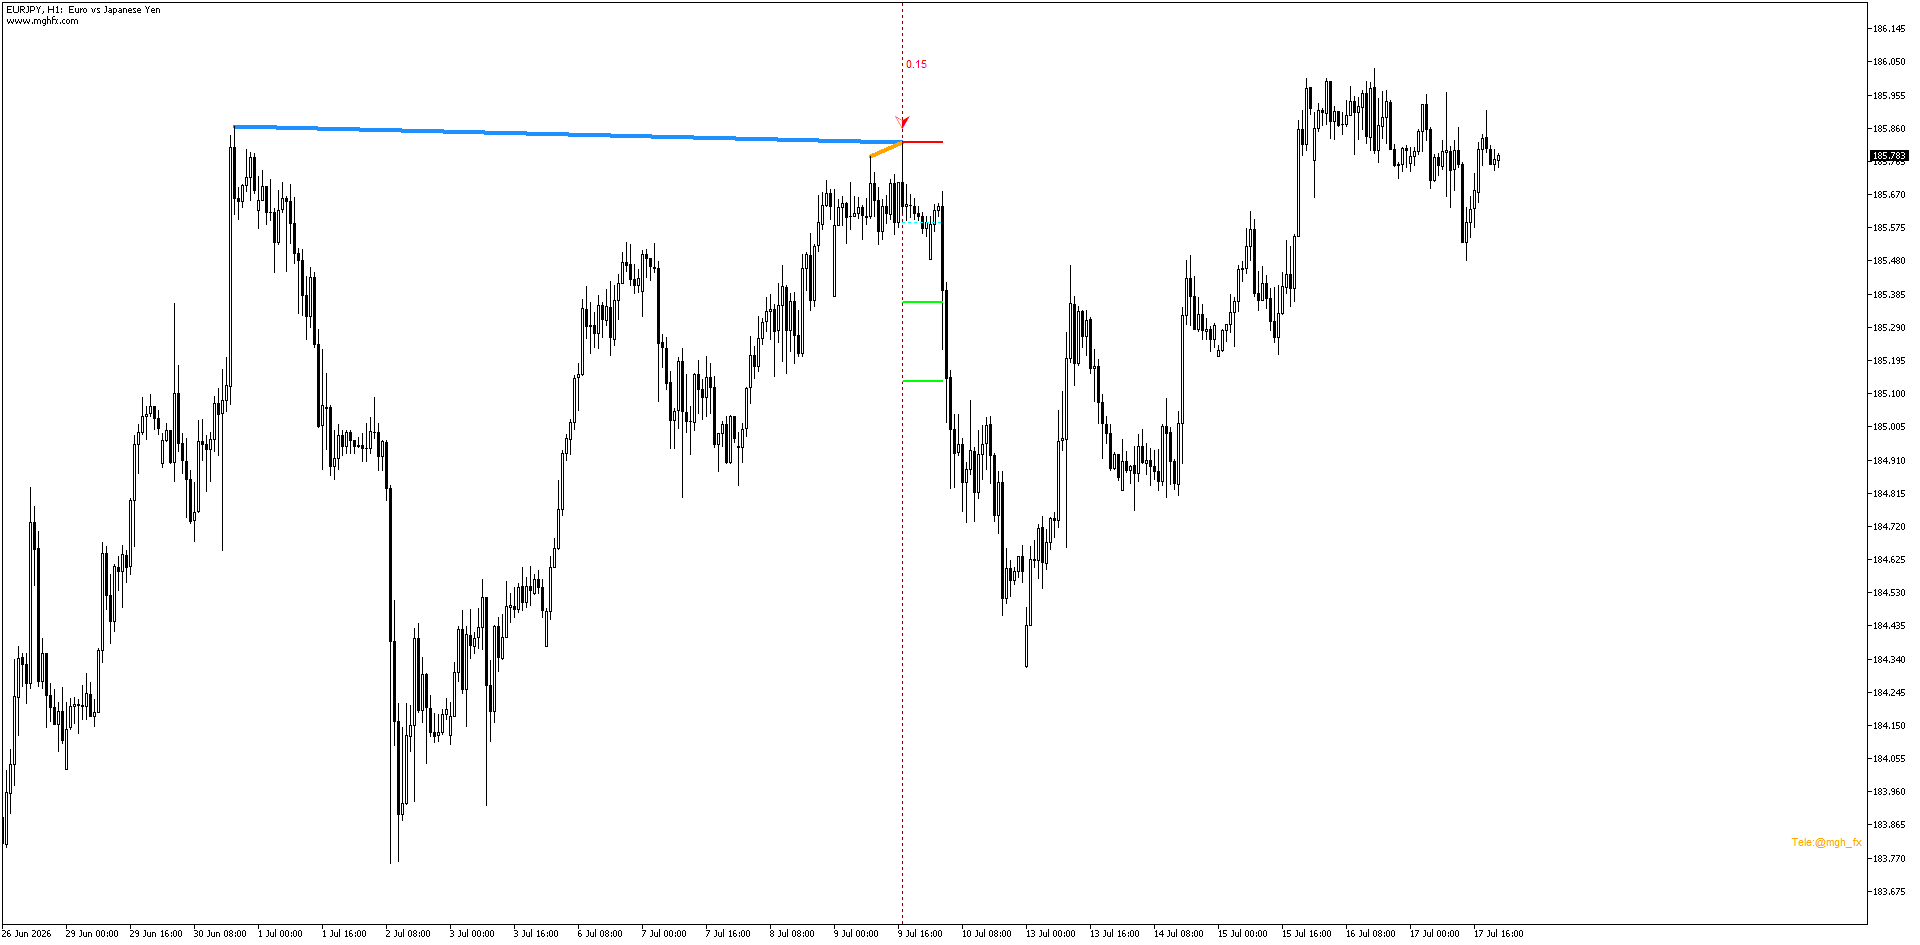
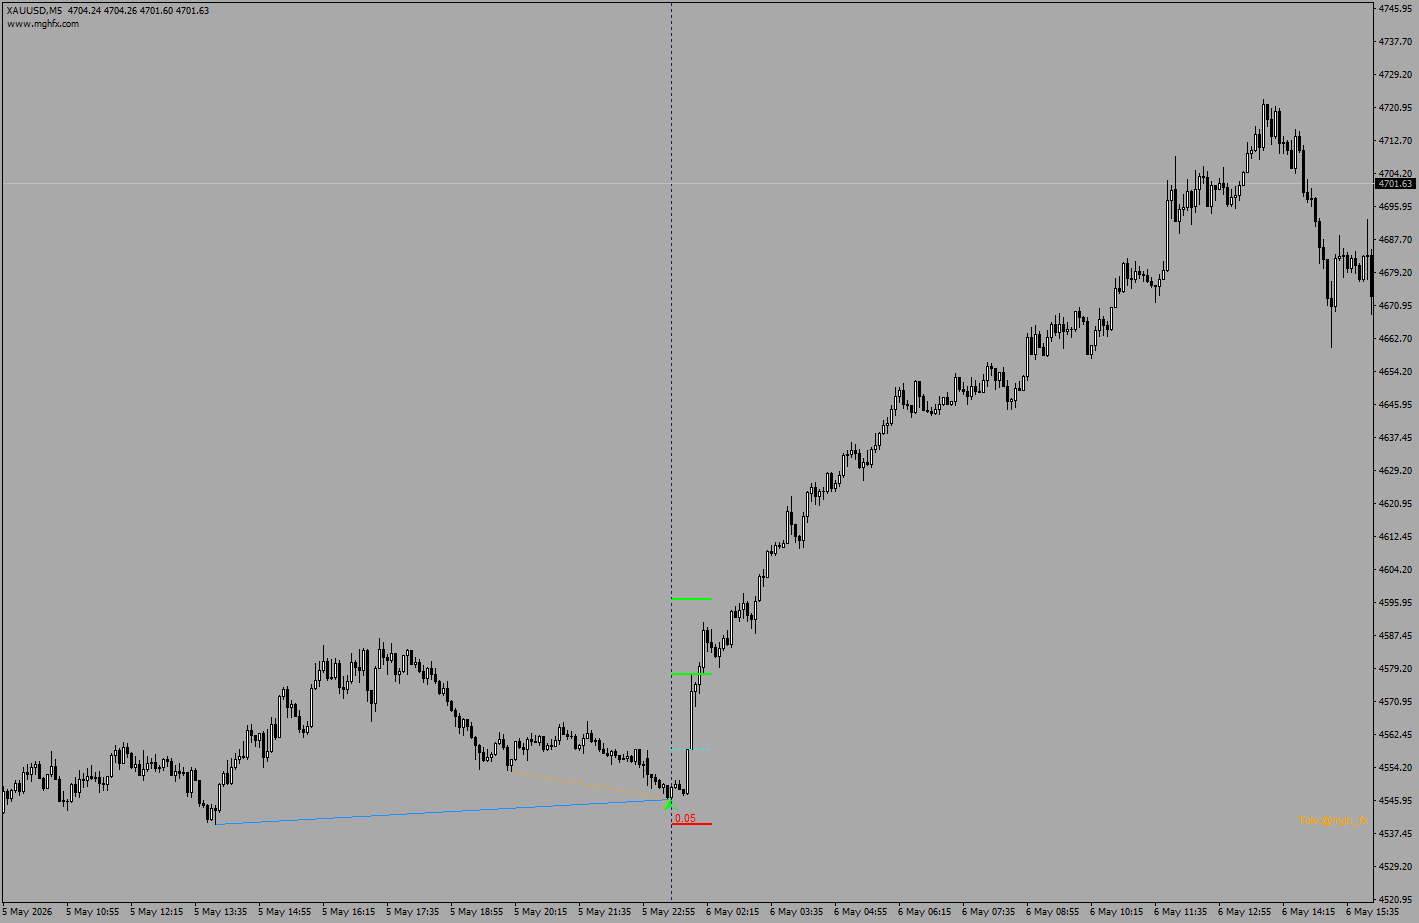
🚀 MGH-MagicTrigger is our flagship Multi-Timeframe HD/RD Divergence Confirmation Indicator — combining higher-timeframe structural divergence (HD) with lower-timeframe confirmation (RD) to deliver clean, high-quality entry signals with built-in Stop Loss, Take Profit, and position-size guidance. 📊✨
🔗 Grab it now:
MT4: https://www.mql5.com/en/market/product/186226
MT5: https://www.mql5.com/en/market/product/186243
⚡ Don't miss this window — once it's over, it's over! ⚡
🙏 Thank you for your continued trust and support!
💙 MGH Products Team
🚀 MGH-MagicTrigger just got more powerful with the 1.2 update!
✨ What's new?
🔹 Choose your Order Type: Direct or Pending 🎯
🔹 Smart Stop-Loss selection: Near Swing or Far Swing 📐
🔹 New filter to screen out late/delayed signals ⏱️
🔹 Split your position volume across multiple entry levels 📊
🔹 Improved accuracy and stability in detecting simultaneous Buy/Sell divergences ⚡
💎 And now for the bigger news...
Thanks to your amazing support for 🧲 MGH-MagicLine and 🎯 MGH-MagicTrigger,
development of the MagicTrigger Expert Advisor (robot) is now officially underway! 🤖⚙️
This means soon you'll be able to run the exact same signal logic automatically on your trading account! 🔄💹
📢 Follow the Telegram channel for release details and updates:
@mgh_fx
Thank you for your continued support 🙏
MGH Products 💙
Completed a 3-month live forward test of MGH-MagicTrigger on EURUSD — 24/26 signals hit target, all at 1:1 risk/reward.
🎥 Full video walkthrough now available.
See product page for details:
MT5 Version : https://www.mql5.com/en/market/product/186243
MT4 Version : https://www.mql5.com/en/market/product/186226
MagicTrigger is a multi-timeframe divergence confirmation indicator. It identifies a structural divergence on a higher timeframe and only marks a signal once matching divergences are confirmed across the required number of lower timeframes — reducing the number of isolated, single-timeframe signals.
Each confirmed signal includes an automatically drawn entry trigger, stop loss, two target levels, and a suggested position size based on your chosen risk percentage.
Two editions are available:
- MetaTrader 5 Edition — builds a scan chain of up to 15 timeframes using the full MT5 period set.
https://www.mql5.com/en/market/product/186243
- MetaTrader 4 Edition — builds a scan chain of up to 6 timeframes using the standard MT4 period set.
https://www.mql5.com/en/market/product/186226
A free demo is available for both editions. A detailed user guide covering every input is available on request after purchase — send a Private Message to receive it.
MagicTrigger — 多周期 HD/RD 背离确认指标(MT5 版) MagicTrigger 是一款多周期背离引擎,它在较高周期(HD)上寻找结构性背离,并等待同一价格区域内较低周期(RD)出现相匹配的背离来加以确认。只有当较高周期的摆动结构与较低周期的确认相互吻合时,指标才会标记信号,并同时给出建议的入场触发点、止损位以及两个目标位。 这款 MetaTrader 5 版本利用 MT5 提供的全部周期范围构建其周期链——除标准周期外,还包括 M2、M3、M4、M6、M12、M20、H2、H3、H6、H8 和 H12。根据指标所加载的周期不同,扫描链最多可包含 15 个周期,相比仅使用标准 MT4 周期集构建的周期链,能够提供明显更细致的多周期结构视图。 工作原理 指标会自动扫描当前图表周期之上和之下的一系列周期。在较高周期上,它寻找价格摆动点与平滑震荡线之间的背离形态(即"HD"背离)。随后检查在 HD
MagicTrigger — 多周期 HD/RD 背离确认指标 MagicTrigger 是一款多周期背离引擎,它在较高周期(HD)上寻找结构性背离,并等待同一价格区域内较低周期(RD)出现相匹配的背离来加以确认。只有当较高周期的摆动结构与较低周期的确认相互吻合时,指标才会标记信号,并同时给出建议的入场触发点、止损位以及两个目标位。 工作原理 指标会自动扫描当前图表周期之上和之下的一系列周期。在较高周期上,它寻找价格摆动点与平滑震荡线之间的背离形态(即"HD"背离)。随后检查在 HD 结构所定义的时间与价格区域内,较低周期是否也出现相同方向的背离(即"RD"背离)。只有当达到所需的最小数量的较低周期确认了较高周期的结构时,才会生成信号,从而减少孤立的单一周期背离信号。 主要功能 基于当前图表周期自动构建多周期扫描链,相同逻辑可自适应任何加载的周期。 可调节的历史扫描深度(History Scan Depth),用于控制图表加载时分析的K线数量。 HD Divergence Range 与 RD Divergence Range
Combines multi-timeframe trend reading (up to 6 lines) with Regular
and Hidden divergence detection in a single indicator window.
Three calculation engines (Slow / Long / Fast), divergence drawn
directly on price candles color-coded per timeframe, and an Auto
TimeFrame algorithm that picks meaningful neighboring timeframes
automatically.
Free demo available:
MT4 → https://www.mql5.com/en/market/product/182884
MT5 → https://www.mql5.com/en/market/product/185086
MGH-MagicLine — 趋势与多时间框架背离一体化工具 MagicLine 将趋势识别与背离分析整合到单一指标中——是同时运行 MultiStoch 和 MultiMACD 的精炼替代方案,输出更清晰、延迟更低。 它是一款 确认与分析工具 ,不提供入场点、止盈或止损,而是为几乎任何趋势型策略增添一层强大而灵活的确认,帮助你更清晰地解读市场。 三种线型模式——同一指标 在设置中选择 Line Type ;当前模式会直接显示在指标窗口名称上,让你随时清楚正在查看的内容: Slow — 噪音最低,用于读取长期趋势方向。线条进入 ±0.2 区域时确认主导趋势。 Long — 趋势识别清晰且更具响应性,是日常使用的均衡之选。 Fast — 反应最快,适合剥头皮和日内动量交易。 一个指标,三种不同表现——根据你的时间框架和风格自由调整。 多时间框架线条——现已支持完整时间框架控制(MT5) 由于 MetaTrader 5 比 MT4 支持更广泛的时间框架范围,本版本新增了 逐线时间框架选择功能 ——让你完全掌控每条线所代表的时间框架。 设置 TimeFrame Type
MGH-MagicLine — 趋势与多时间框架背离一体化工具 MagicLine 将趋势识别与背离分析整合到单一指标中——是同时运行 MultiStoch 和 MultiMACD 的精炼替代方案,输出更清晰、延迟更低。 它是一款 确认与分析工具 ,不提供入场点、止盈或止损,而是为几乎任何趋势型策略增添一层强大而灵活的确认,帮助你更清晰地解读市场。 三种线型模式——同一指标 在设置中选择 Line Type ;当前模式会直接显示在指标窗口名称上,让你随时清楚正在查看的内容: Slow — 噪音最低,用于读取长期趋势方向。线条进入 ±0.2 区域时确认主导趋势。 Long — 趋势识别清晰且更具响应性,是日常使用的均衡之选。 Fast — 反应最快,适合剥头皮和日内动量交易。 一个指标,三种不同表现——根据你的时间框架和风格自由调整。 多时间框架线条 最多绘制 6 条独立线条 ,每条对应一个更高的时间框架。 将鼠标悬停在任意线条上即可即时查看其时间框架。 通过图表上的按钮(1–6)开启/关闭每条线。 在同一窗口中同时看到更高时间框架的全局和你的入场时间框架。 常规背离与隐藏背离 将
This version takes full advantage of MT5's wider timeframe range and adds a new TimeFrame Type setting:
🔹 Auto — automatically builds a 4×–6× adjacent-timeframe series for you
🔹 From Inputs — assign an independent timeframe to each of the 6 lines (L1–L6)
✨ Core features:
• Up to 6 timeframes in one window
• Per-line conditional alerts (Same / Opposite / OFF)
• Signal candle selection (0 or 1) for speed vs. lower repaint
• Wave-projection workflow for mapping future moves
• Popup, sound, email & push notifications
🎁 Free demo available — try it before you buy.
Thank you to everyone testing and sharing feedback. More updates coming. 🙏
MGH-MultiStoch — 多周期趋势识别与波浪分析(MT5) MGH-MultiStoch 是一款多周期趋势指标,可在 单一窗口中同时显示最多 6 个时间周期 。它帮助交易者跨周期确认趋势方向、直观地数清市场波浪,并根据更高周期的交叉构建前瞻性的波浪情景。 这是 MetaTrader 5 版本。由于 MT5 支持更广泛的时间周期,此版本新增了 每条线独立的周期选择 ,让您可以为六条线中的每一条分配独立的周期。 它要解决的问题 交易中一个常见的难题是:在当前图表上收到的信号缺乏更高周期的确认。设计自动交易系统的经验表明,正确的多周期一致性是交易系统最终结果的一个重要因素。 MGH-MultiStoch 在单一窗口中显示最多 6 个周期的趋势状态。这使您能够快速检查工作周期上的信号是否与更大的市场结构一致。 周期选择:Auto 或 From Inputs 此 MT5 版本通过 TimeFrame Type 设置,为六条线的周期提供两种设定方式。 当 TimeFrame Type 设为 Auto 时,指标会自动选择周期,遵循约 4 至 6 倍的相邻周期原则。您无需手动设置任何内容。
MGH-MultiStoch — 多周期趋势识别与波浪分析 MGH-MultiStoch 是一款多周期趋势指标,可在 单一窗口中同时显示最多 6 个时间周期 。它帮助交易者跨周期确认趋势方向、直观地数清市场波浪,并根据更高周期的交叉构建前瞻性的波浪情景。 该指标采用专为本产品开发的自定义多周期计算方法。同时适用于 MetaTrader 4 和 MetaTrader 5 。 它要解决的问题 交易中一个常见的难题是:在当前图表上收到的信号缺乏更高周期的确认。设计自动交易系统的经验表明,正确的多周期一致性是交易系统最终结果的一个重要因素。 MGH-MultiStoch 在单一窗口中显示最多 6 个周期的趋势状态。这使您能够快速检查工作周期上的信号是否与更大的市场结构一致。 用作确认过滤器 该指标可作为趋势跟踪策略和反转策略的确认工具: 趋势策略: 在入场前,要求一两个更高周期与您的信号方向一致。该过滤器可以提升许多交易系统的信号质量。 反转策略: 观察更高周期上出现新交叉的时刻,这是方向可能改变的早期结构性信号。 波浪分析: 线条的交叉将市场划分为多个区段,使艾略特波浪计数更简单、更直观。
*The trend continuation signal most traders never see — now detected automatically across 6 timeframes.*
---
## Overview
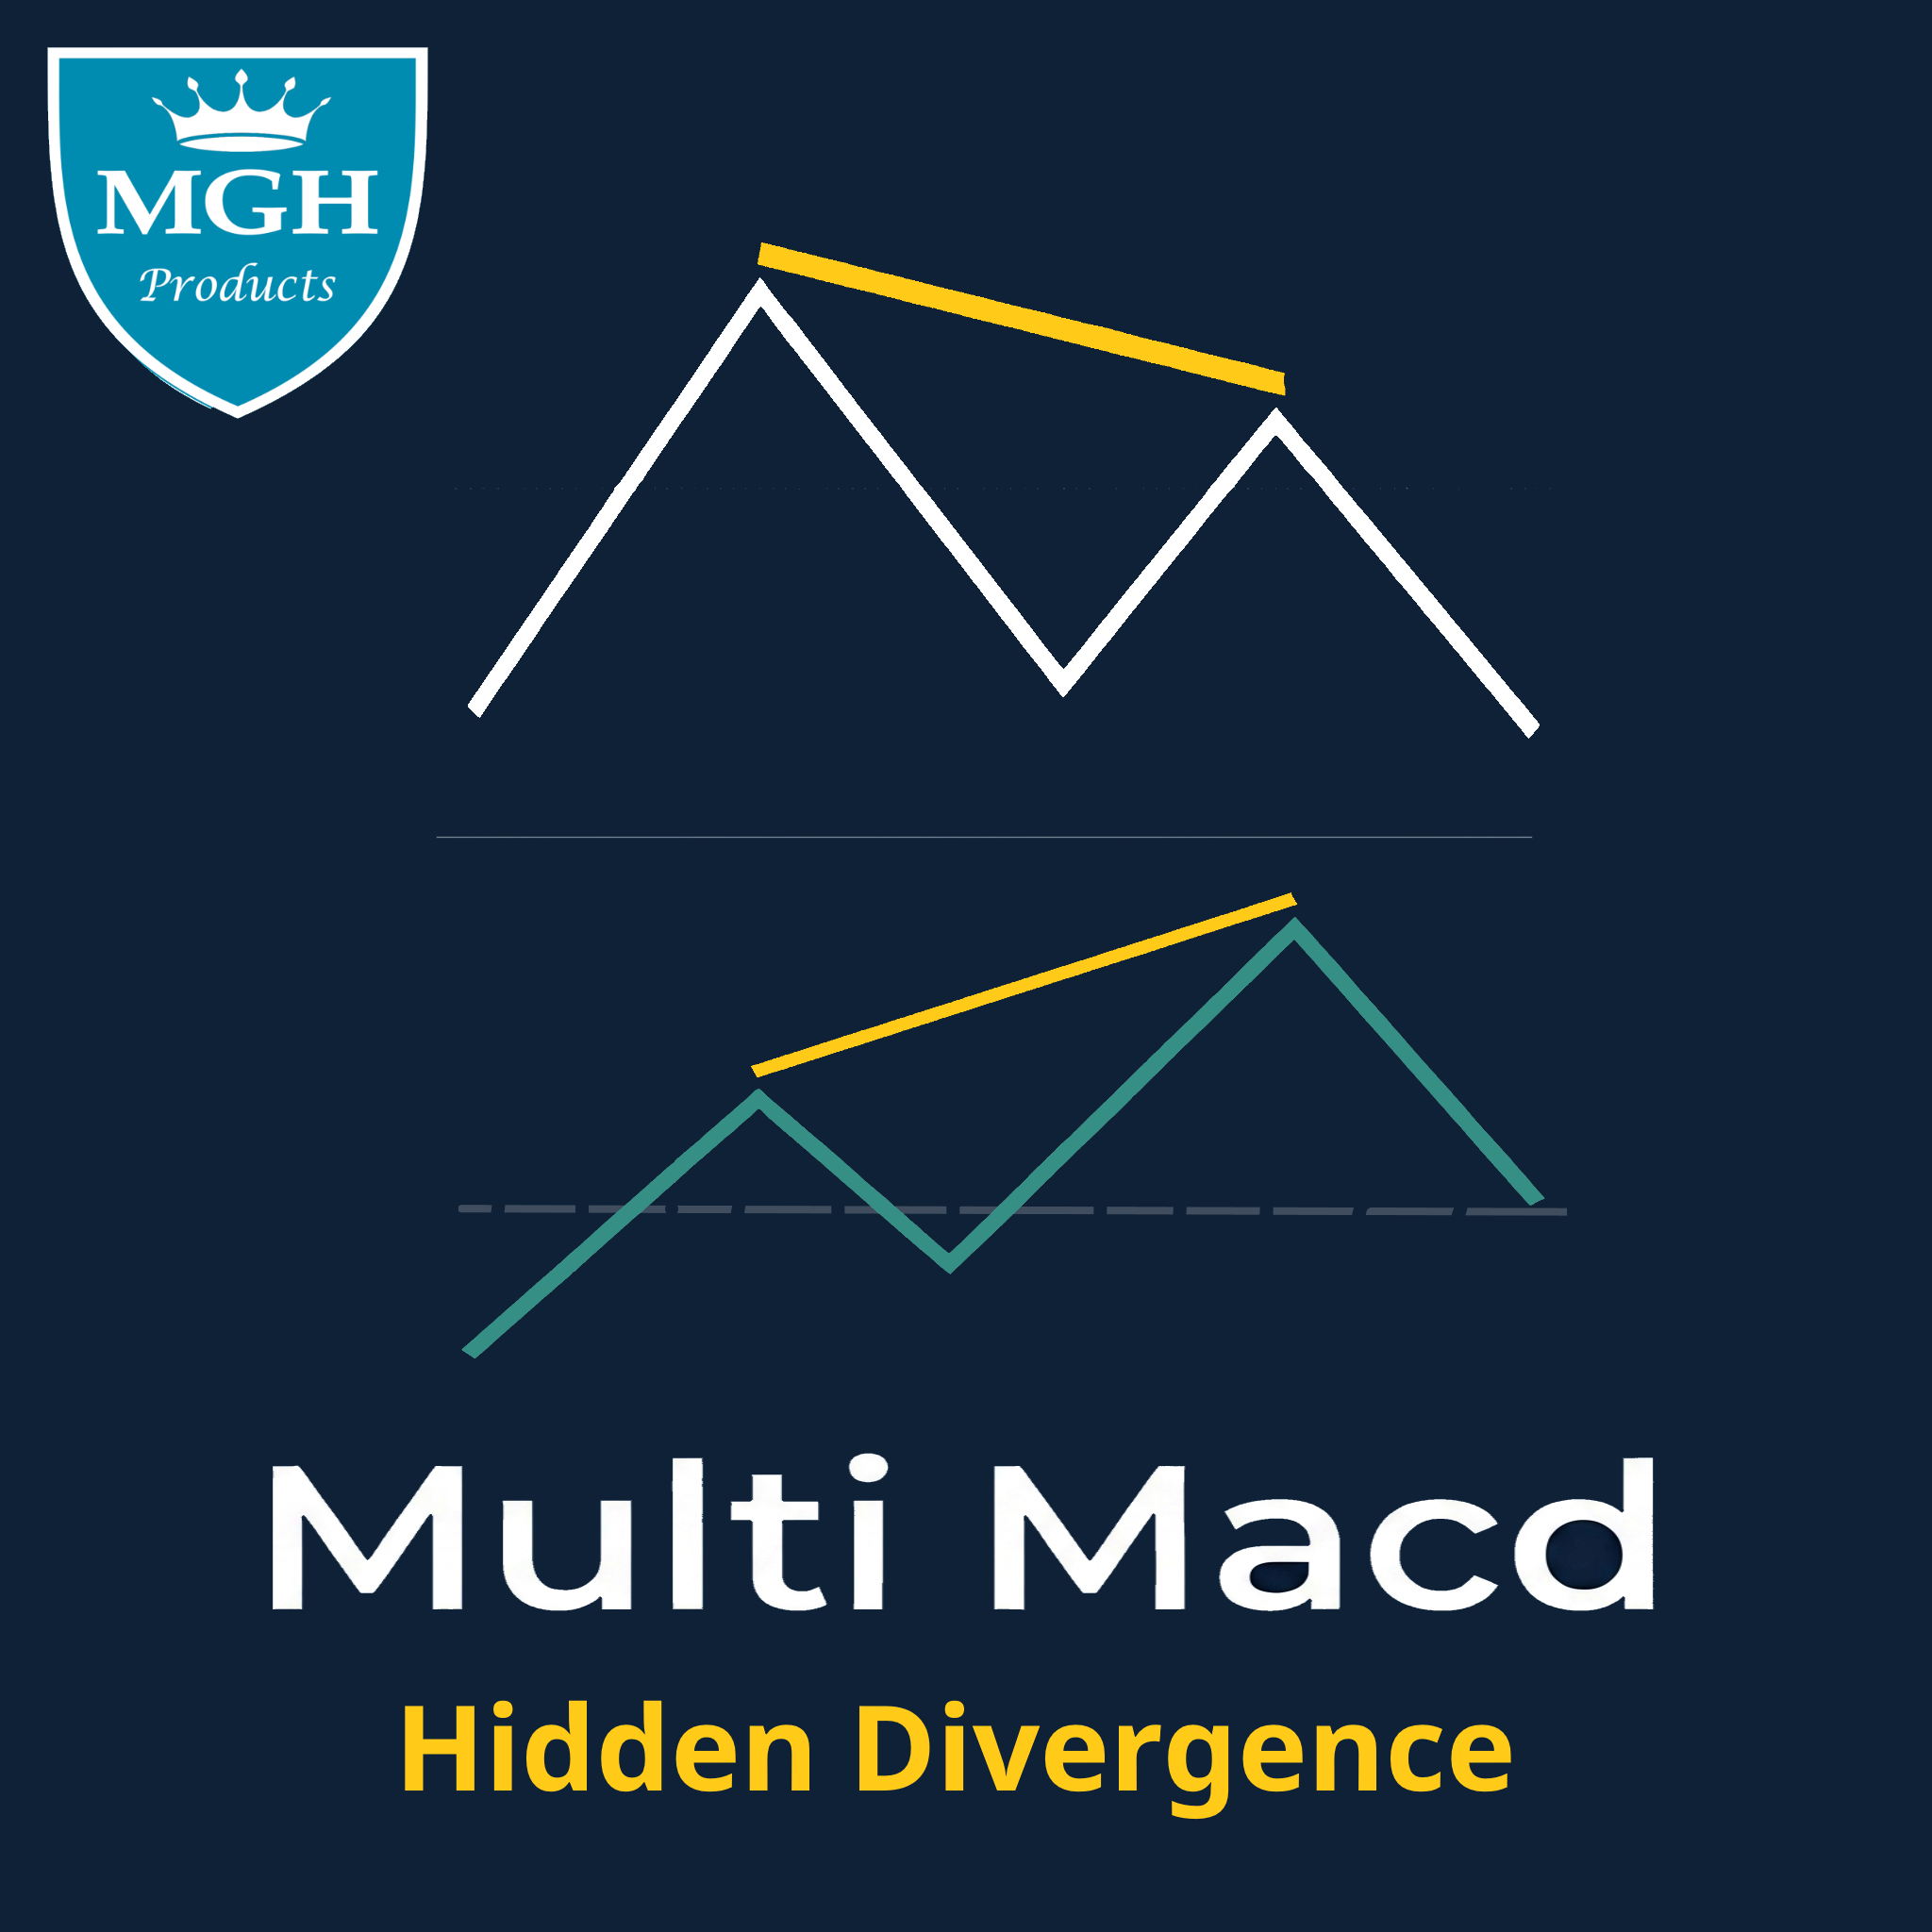
Regular divergence tells you when a trend may be reversing. **Hidden divergence tells you when it is about to continue** — and it is the signal that professional trend-following traders rely on most. The problem is that hidden divergence is significantly harder to spot than regular divergence, and virtually no indicator on MQL5 Market detects it accurately across multiple timeframes simultaneously.
**MGH-MultiMACD-HD** changes that entirely. Built on the same proprietary multi-timeframe engine as MGH-MultiMACD-RD, this indicator is dedicated exclusively to hidden divergence detection — monitoring up to 6 timeframes at once, drawing precise divergence lines on both the price chart and the MACD window, and alerting you the moment a confirmed setup forms. All without repainting.
---
## What Is Hidden Divergence — And Why Does It Matter?
Most traders learn regular divergence early in their education. Fewer learn hidden divergence. And almost none have a tool that detects it reliably.
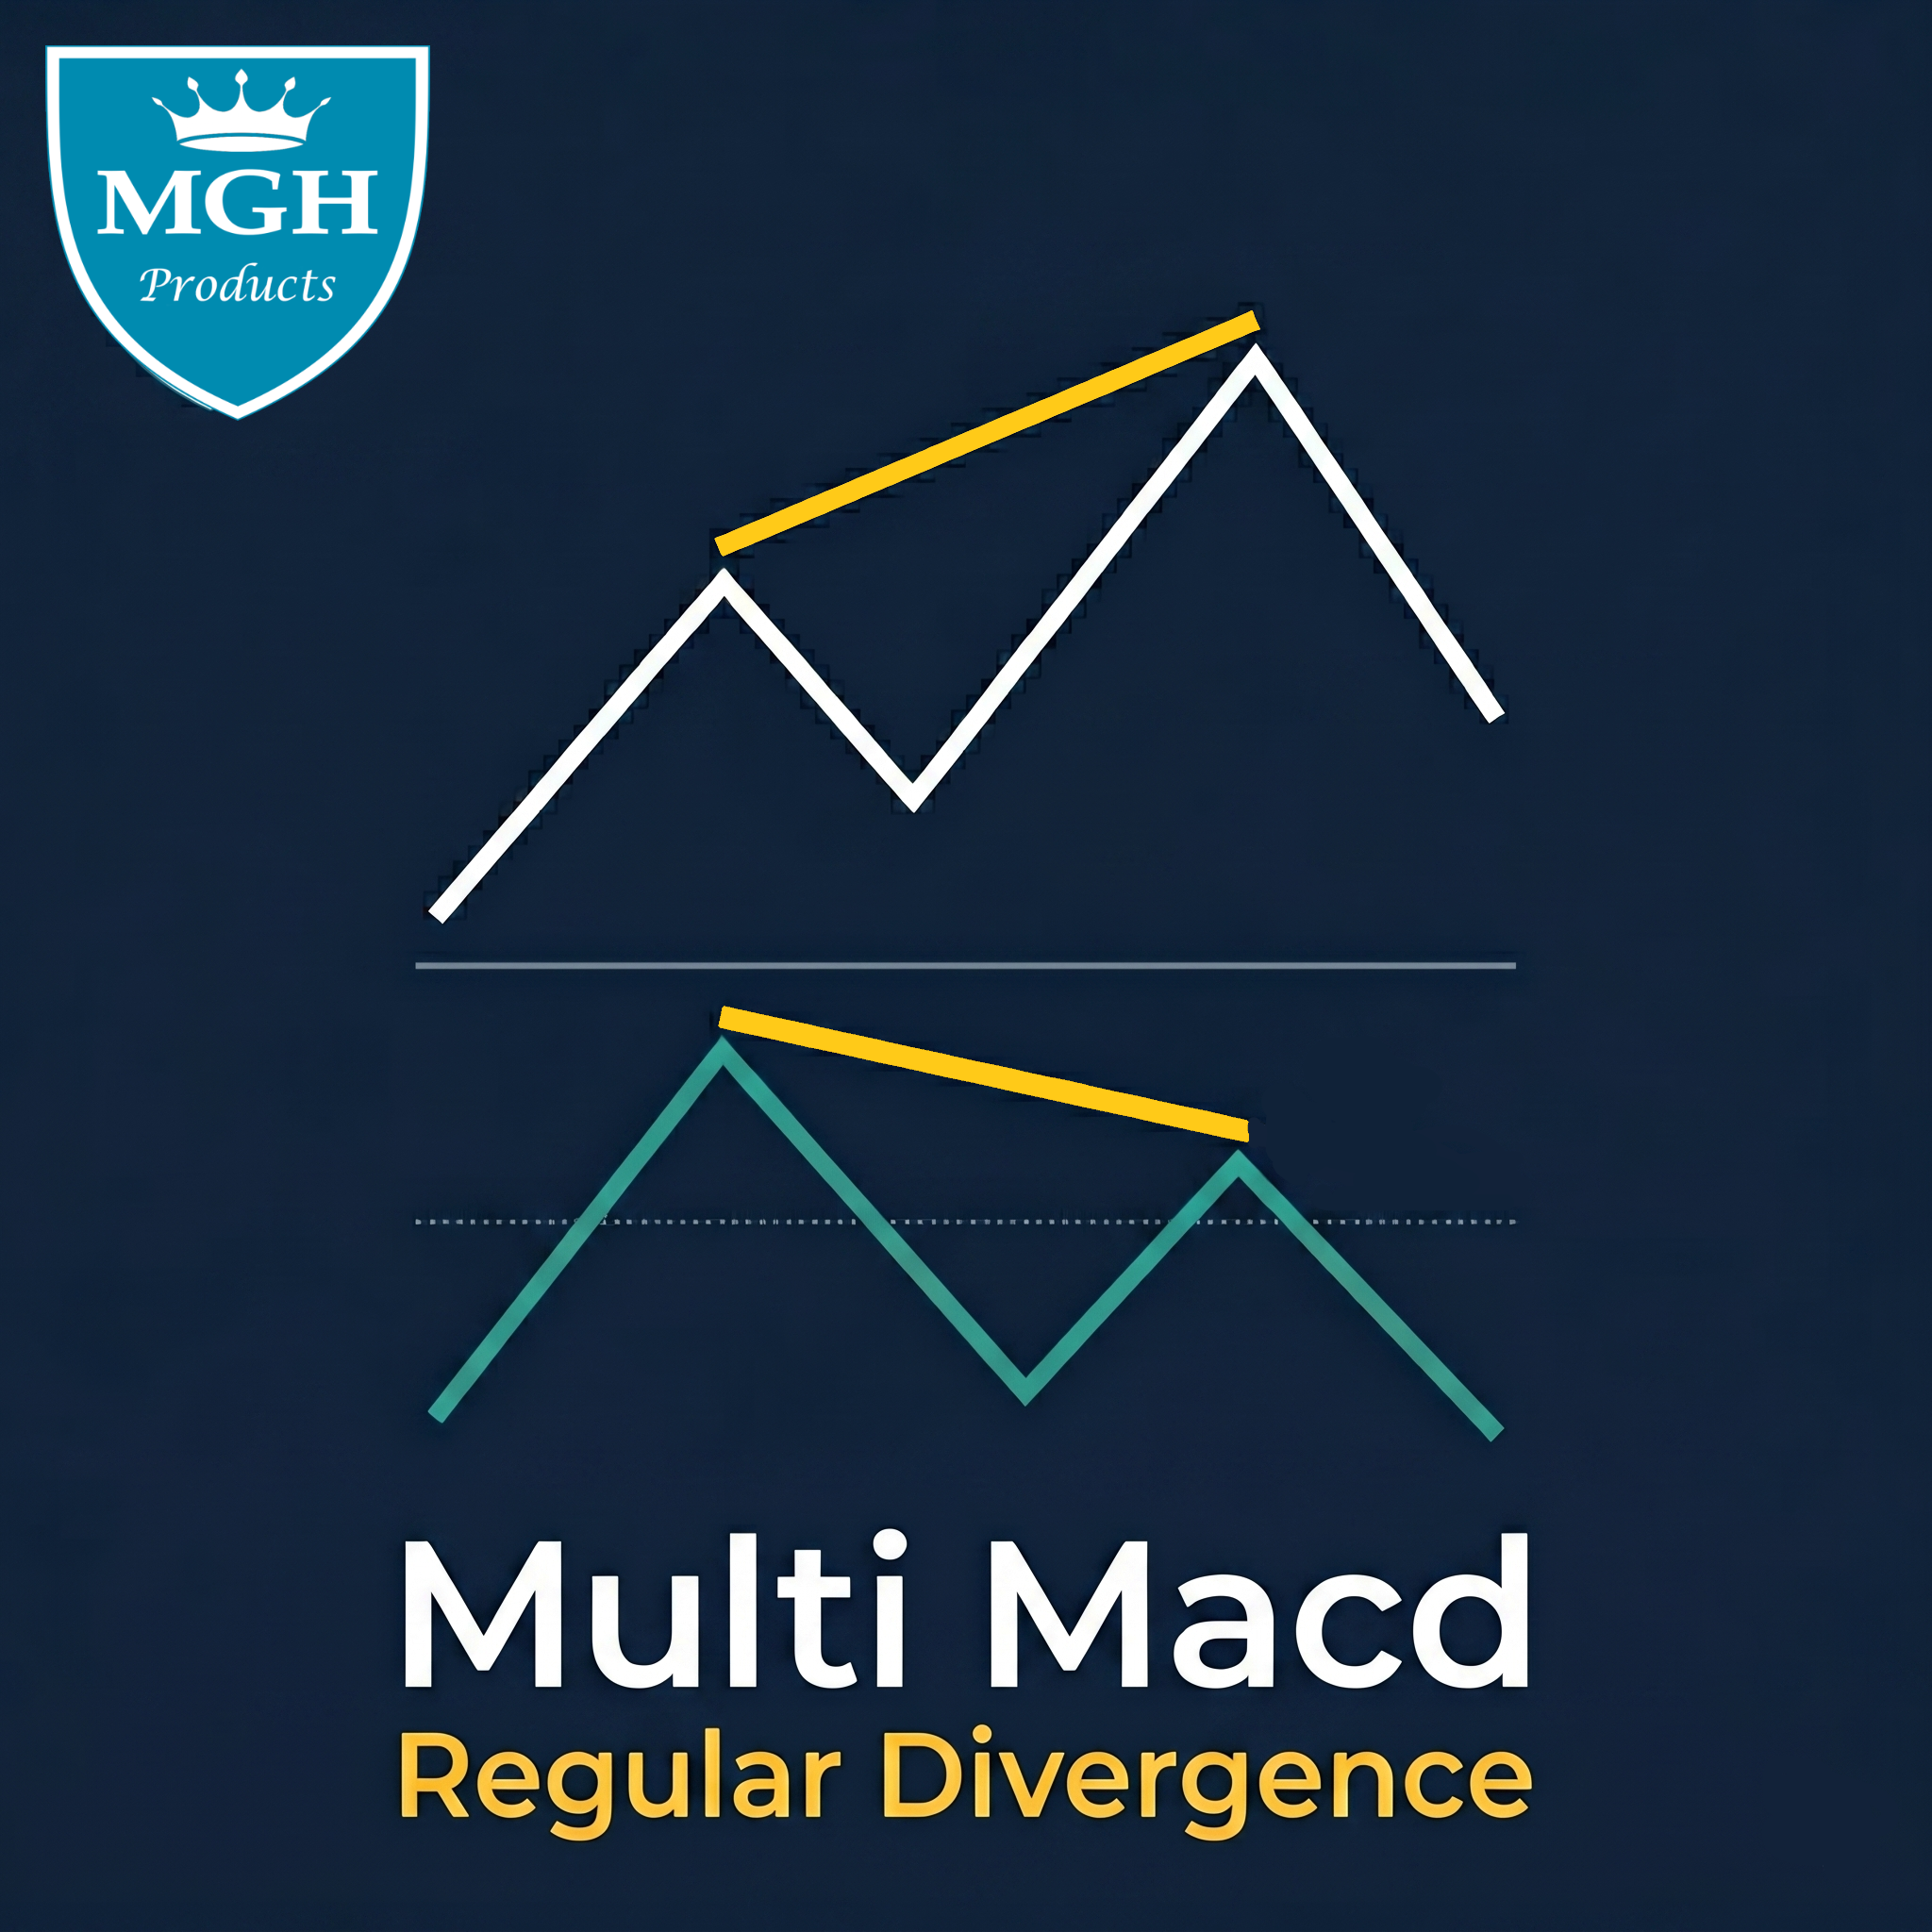
**Hidden bullish divergence** occurs when price makes a higher low while MACD makes a lower low. It signals that the underlying bullish momentum is intact despite a surface-level pullback — and that the trend is likely to resume upward.
**Hidden bearish divergence** occurs when price makes a lower high while MACD makes a higher high. It signals that selling pressure remains dominant beneath a brief corrective bounce — and that the downtrend is likely to continue.
These are not reversal signals. They are **trend continuation signals** — among the highest-probability setups available to technical traders, appearing consistently across all instruments and all timeframes. The challenge has always been detecting them accurately and in real time. MGH-MultiMACD-HD solves that challenge completely.
---
## Why Most Hidden Divergence Tools Fail
The reason hidden divergence detection is rarely implemented well comes down to three core problems that most indicators never address:
- **Single-timeframe blindness** — they show you hidden divergence on the current chart only, missing the structural context available from higher timeframes.
- **Repaint** — signals that appeared on forming candles disappear when the candle closes, making historical performance appear better than it actually is.
- **Imprecise swing detection** — incorrect identification of the pivot points that define hidden divergence, leading to false signals and missed setups.
MGH-MultiMACD-HD was built specifically to solve all three. The swing detection algorithm is precise. The signal confirmation is repaint-free when set to candle 1. And the multi-timeframe engine makes it the only hidden divergence tool on the market that watches six timeframes simultaneously.
---
## Key Features
### Multi-Timeframe Hidden Divergence — The Complete View
Monitor the current timeframe plus up to 5 higher timeframes at once. Each timeframe's MACD is displayed in its own distinct color, and every hidden divergence detected — on any active timeframe — is marked immediately on the chart. The color of each divergence line on the price chart matches the corresponding MACD line in the indicator window, so the relationship between chart signal and oscillator context is always clear.
Toggle any timeframe on or off instantly using the on-chart buttons (1–6) or from the Inputs panel — no need to re-open settings to switch your active timeframe combination.
### Zero Repaint — Trade With Confidence
Signal Candle Shift gives you full control: set it to **1** for confirmed, closed-candle signals that will never be redrawn, or **0** for real-time signals on the forming candle if you prefer faster entry. When set to 1, every signal you see is final — the indicator cannot and will not alter historical output.
### Precision Swing Detection
The core algorithm identifies the precise swing highs and lows that define valid hidden divergence — not approximations, not lookahead bias, not cosmetic lines drawn after the fact. The divergence lines connect the exact pivot points where price and MACD disagree, giving you a clear, accurate picture of the structural relationship between price action and momentum.
### Extended Divergence Range
The **Increase Divergence Range** parameter extends the lookback window, allowing detection of hidden divergences formed between swing points that are far apart in time. Standard indicators miss these entirely. MGH-MultiMACD-HD finds them.
### Display Flexibility
Choose to display divergence lines on the **price chart only**, the **indicator window only**, or **both simultaneously**. The "Only Price" mode produces the cleanest chart layout — divergence structure is visible directly on price without any indicator clutter below.
### Full Alert System
- **Divergence alert** — fires the moment a hidden divergence is confirmed on any active timeframe
- **Phase change alert** — fires when MACD crosses the zero line
- **Histogram/Signal cross alert** — fires on momentum crossovers
- Delivery via popup, sound (.wav), email, and push notification — all independently configurable
---
## Hidden Divergence Across Timeframes — The Confluence Advantage
A hidden divergence on a single timeframe is already a meaningful signal. When the same directional bias appears as hidden divergence simultaneously on two or three timeframes — for example, on M15, H1, and H4 at the same time — the probability of trend continuation increases substantially.
MGH-MultiMACD-HD makes these confluence zones visible and alerts you when they form. This multi-timeframe alignment is one of the highest-conviction setups in technical analysis, and it is something no single-timeframe indicator can ever show you.
As a practical framework: **use single-timeframe hidden divergences as trend-continuation confirmation** within your existing strategy. Use multi-timeframe confluence zones — where two or more timeframes show hidden divergence simultaneously in the same price area — as standalone, high-probability trend-continuation entries.
---
## Practical Use Cases
**Intraday trend trading** — Trading M5 or M15 in a clear trend and unsure whether a pullback is a reversal or a continuation opportunity? Enable H1 or H4 as a second layer. When M15 price makes a higher low and H1 MACD also shows hidden bullish divergence, the pullback is almost certainly a continuation setup.
**Daily timeframe trend following** — Enable the Daily and Weekly layers to catch hidden divergences on major structural levels. These signals appear infrequently but consistently precede significant trend continuation moves.
**Scalping with higher-TF context** — Run M1 or M5 as Layer 1 and H1 as Layer 2. When the higher timeframe confirms the trend direction via hidden divergence, scalp entries in that direction carry a structural edge.
**Filtering out reversal traps** — Hidden divergence in the direction of the prevailing trend is a direct confirmation that the trend is intact. Use it to avoid counter-trend trades and stay on the right side of momentum.
---
## Interpolation Mode
Enable **Interpolate in MTF Mode** to smooth the MACD lines from higher timeframes into clean, continuous curves rather than step-function plots. This is a visual preference — the underlying signal logic is identical — but it produces significantly cleaner chart output when multiple timeframes are displayed simultaneously.
---
## Settings Reference
| Parameter | Description |
|---|---|
| Indicator Name | Label shown in the indicator sub-window header |
| Number of Candles | Lookback period (0 = full history) |
| MACD Fast / Slow / Signal | Standard MACD parameters — defaults are 12, 26, 9 |
| Interpolate in MTF Mode | Smooth higher-TF MACD lines for cleaner visual output |
| L1 – L6 Enable | Independently enable or disable each timeframe layer |
| Divergence Check | Master on/off switch for hidden divergence detection |
| Increase Divergence Range | Extends lookback for detecting wide-range hidden divergences |
| Display Lines | Price chart only / indicator window only / both |
| L1 – L6 Divergence Color | Individual divergence line color per active timeframe |
| Lines Style / Width | Visual style and thickness of all divergence lines |
| Alert On Phase Change | Alert when MACD crosses the zero line |
| Alert On Lines Cross | Alert on histogram / signal line crossover |
| Alert On Divergence | Alert on confirmed hidden divergence detection |
| Signal Candle Shift (0 or 1) | 0 = real-time; 1 = confirmed, no-repaint |
| Show Window | Toggle the indicator sub-window on or off |
| Sound Alert / Email / Notification | Alert delivery method(s) |
| Sound File Name | Custom .wav file path for sound alerts |
| Display Button | Show or hide on-chart timeframe toggle buttons |
| X / Y Position | Position of the on-chart button panel |
---
## The MGH MultiMACD Ecosystem
MGH-MultiMACD-HD is part of a two-indicator system designed to give traders complete divergence coverage:
| Indicator | Type | Purpose |
|---|---|---|
| MGH-MultiMACD-RD | Regular Divergence | Identifies potential trend reversals |
| MGH-MultiMACD-HD | Hidden Divergence | Confirms trend continuation setups |
Used together, these two indicators provide a complete picture of MACD divergence across all timeframes — reversal signals when the trend is ending, continuation signals when it is resuming. No other indicator combination on MQL5 Market offers this level of multi-timeframe divergence coverage in a unified, color-coded visual system.
---
## Technical Specifications
- **Platform:** MetaTrader 4
- **Indicator Type:** MACD-based hidden divergence, multi-timeframe
- **Repaint:** No (when Signal Candle Shift = 1)
- **Alerts:** Sound, Email, Push Notification, Popup
- **Default MACD Settings:** 12 / 26 / 9
- **Timeframes Supported:** Current TF + 5 higher TFs simultaneously
---
## Try It Free
A demo version is available for download directly from MQL5 Market. Attach it to any chart, enable two or three timeframes, and watch how many hidden divergences — trend continuation signals your current tools have been missing — appear across your active pairs. The difference is visible within minutes of loading the indicator.
**If you trade with the trend, this is the indicator that keeps you in it.**
---
MT4 : https://www.mql5.com/en/market/product/179159
MT5 : https://www.mql5.com/en/market/product/179985
*Never miss a divergence again — across 6 timeframes, all at once.*
---
## Overview
Most MACD divergence indicators on the market are either inaccurate, overly simplistic, or plagued with repaint issues. **MGH-MultiMACD-RD** was built to solve all of that — and go much further.
This is not just another MACD indicator. It is a **multi-timeframe divergence engine** that simultaneously monitors up to 6 timeframes on a single chart, detects every divergence with precision, and delivers alerts the moment they form — without repainting.
Designed by a professional trader and developer, the algorithm behind this tool is one of the most unique approaches to MACD divergence detection ever built for MetaTrader.
---
## Why Most MACD Divergence Indicators Fail
- They only analyze the current timeframe — missing the bigger picture.- They repaint signals, making backtesting unreliable and live trading dangerous.- They draw divergence lines inconsistently or miss valid setups entirely.- They offer no alert system for when you're away from the screen.
**MGH-MultiMACD-RD was built specifically to eliminate every one of these problems.**
---
## Key Features
### Multi-Timeframe Analysis — See the Full PictureMonitor the **current timeframe plus up to 5 higher timeframes simultaneously** — all from a single chart window. Each timeframe's MACD is displayed with a distinct color, so you can instantly understand which timeframe is generating a signal. You can enable or disable any timeframe directly from the settings or with the **on-chart buttons (1–6)**.
### Zero Repaint — Reliable Signals You Can TrustYou choose whether signals trigger on **candle 0** (faster, real-time) or **candle 1** (confirmed, no repaint). When set to candle 1, you can be **100% confident** that no signal will ever be redrawn or disappear after the fact.
### Comprehensive Divergence DetectionThe indicator finds **every valid divergence** — regular and hidden — across all active timeframes. A dedicated **"Increase Divergence Range"** parameter allows you to extend the lookback and catch divergences between distant swing points that most other tools would miss entirely.
### Multi-Divergence Confluence — The Power SignalWhen **two or more divergences from different timeframes occur in the same price zone simultaneously**, the signal strength increases dramatically. These multi-timeframe confluence zones are where the most powerful reversals and trend changes happen. This alone can serve as a **complete standalone trading strategy**.
### Smart Alert SystemNever sit glued to your screen again. Choose from:- **Phase change alerts** — when MACD crosses zero- **Histogram/Signal line cross alerts** — real-time momentum shifts- **Divergence alerts** — the moment a divergence is confirmed- Sound alerts with custom `.wav` file support- Email and push notification support
### Interpolation ModeEnable the **Interpolate** option for visually smooth, curved MACD lines across all higher timeframes — cleaner charts, easier reading.
### Full Visual Customization- Each timeframe has its own divergence line color (matching the MACD line color for instant association)- Choose to display divergence lines on the **price chart, the indicator window, or both**- Full control over line style, thickness, and color for each level- Logo and branding display toggleable from settings
---
## How to Use It
1. **Attach the indicator** to any chart and timeframe.2. **Enable the timeframes** you want to watch using buttons 1–6 or from the Inputs tab.3. **Set your alert preferences** — divergence, phase change, or histogram cross.4. **Choose candle 0 or 1** depending on whether you prefer speed or confirmation.5. **Wait for the alert** — the indicator does the watching for you.
> **Pro Tip:** Use single-timeframe divergences as **confirmation** for your existing strategies. When multiple timeframes show divergence simultaneously in the same zone, consider it a **high-probability reversal signal**.
---
## Settings Reference
| Parameter | Description ||---|---|| Indicator Name | Label shown in the chart window || Number of Candles | Lookback period (0 = all history) || MACD Fast / Slow / Signal | Standard MACD parameters (default 12/26/9) || Interpolate in MTF Mode | Smooth higher-TF MACD lines || L1–L6 Enable | Enable/disable each timeframe layer || Divergence Check | Enable divergence detection || Increase Divergence Range | Extend lookback for distant divergences || Display Lines | Show on chart, indicator window, or both || L1–L6 Divergence Color | Per-timeframe divergence line color || Lines Style / Width | Visual styling of divergence lines || Alert On Phase Change | Alert when MACD crosses zero || Alert On Lines Cross | Alert on histogram/signal cross || Alert On Divergence | Alert on divergence detection || Signal Candle Shift (0 or 1) | 0 = real-time, 1 = confirmed (no repaint) || Show Window | Display indicator sub-window || Sound / Email / Notification | Alert delivery method || Sound File Name | Custom `.wav` sound file || Display Button | Show/hide on-chart buttons || X / Y Position | Button position on chart |
---
## What Makes This Different
> *"The most effective divergences, in my view as the developer, are those where the new MACD peak/trough has retraced more than 50% of the previous one and is approaching the zero line. This combination — multi-timeframe, near-zero, deep retracement — produces the strongest reversal signals."*
This is the philosophy embedded in the algorithm. No other indicator on MQL5 applies this multi-dimensional approach to divergence detection with this level of control and reliability.
---
## Technical Specifications
- **Platform:** MetaTrader 4 / MetaTrader 5- **Indicator Type:** MACD-based divergence, multi-timeframe- **Repaint:** No (when Signal Candle Shift = 1)- **Alerts:** Sound, Email, Push Notification- **Default MACD Settings:** 12 / 26 / 9- **Timeframes Supported:** Current TF + 5 higher TFs simultaneously---
## Try It — Then Decide
A demo version is available. Load it on any chart, enable multiple timeframes, and watch how many divergences your current indicator has been missing. The difference is immediately visible.
**If you trade divergences, this is the only indicator you will ever need.**
MT4 : https://www.mql5.com/en/market/product/179049
MT5 : https://www.mql5.com/en/market/product/179975
MGH-MultiMACD-HD — 多周期 MACD 隐藏背离检测器 大多数交易者从未看到的趋势延续信号——现在可在 6 个时间周期上自动检测。 概述 常规背离告诉您趋势何时可能反转。隐藏背离告诉您趋势何时即将延续——这是专业趋势跟踪交易者最依赖的信号。问题在于,隐藏背离比常规背离明显更难发现,而 MQL5 Market 上几乎没有任何指标能够在多个时间周期上同时准确检测它。 MGH-MultiMA CD-HD 彻底改变了这一点。它构建于与 MGH-MultiMACD-RD 相同的专有多周期引擎之上,专门致力于隐藏背离检测—— 同时监控最多 6 个时间周期 ,在价格图表和 MACD 窗口上绘制精确的背离线,并在确认的形态形成时立即提醒您。这一切均无重绘。 什么是隐藏背离——它为何重要? 大多数交易者在学习初期就掌握了常规背离。学习隐藏背离的人较少。而几乎没有人拥有能够可靠检测它的工具。 隐藏看涨背离 出现于价格创出更高的低点而 MACD 创出更低的低点时。它表明:尽管表面上出现回调,潜在的看涨动能依然完好——趋势很可能向上恢复。 隐藏看跌背离 出现于价格创出更低的高点而 MACD
MGH-MultiMACD-RD — 多周期 MACD 背离指标(MT5) 概述 MGH-MultiMACD-RD 是一款适用于 MetaTrader 5 的多周期 MACD 背离指标。它可在 单一图表上同时监控最多 6 个时间周期 ,检测常规背离与隐藏背离,并在背离得到确认时发出提醒。 该指标的开发旨在解决标准 MACD 背离工具中三个常见的局限:单周期分析、信号重绘以及背离线绘制不一致。 主要功能 多周期分析 该指标在单一图表窗口中显示当前周期以及最多 5 个更高周期的 MACD 数据。每个周期分配不同的颜色以便于识别。周期可通过设置面板或图表按钮(1–6)启用或禁用。 重绘控制 信号可配置为在 K 线 0(实时)或 K 线 1(已确认、已收盘的 K 线)上触发。设为 K 线 1 时,信号不会在事后被重新绘制。 背离检测 该指标可在所有活动周期上检测常规背离与隐藏背离。「Increase Divergence Range」参数可延长回溯周期,以捕捉更远摆动点之间的背离。 多周期共振(Confluence)
MGH-MultiMACD-HD — 多周期 MACD 隐藏背离检测器 大多数交易者从未看到的趋势延续信号——现在可在 6 个时间周期上自动检测。 概述 常规背离告诉您趋势何时可能反转。隐藏背离告诉您趋势何时即将延续——这是专业趋势跟踪交易者最依赖的信号。问题在于,隐藏背离比常规背离明显更难发现,而 MQL5 Market 上几乎没有任何指标能够在多个时间周期上同时准确检测它。 MGH-MultiMACD-HD 彻底改变了这一点。它构建于与 MGH-MultiMACD-RD 相同的专有多周期引擎之上,专门致力于隐藏背离检测—— 同时监控最多 6 个时间周期 ,在价格图表和 MACD 窗口上绘制精确的背离线,并在确认的形态形成时立即提醒您。这一切均无重绘。 什么是隐藏背离——它为何重要? 大多数交易者在学习初期就掌握了常规背离。学习隐藏背离的人较少。而几乎没有人拥有能够可靠检测它的工具。 隐藏看涨背离 出现于价格创出更高的低点而 MACD 创出更低的低点时。它表明:尽管表面上出现回调,潜在的看涨动能依然完好——趋势很可能向上恢复。 隐藏看跌背离 出现于价格创出更低的高点而 MACD
MGH-MultiMACD-RD — 多周期 MACD 背离指标(MT4) 概述 MGH-MultiMACD-RD 是一款适用于 MetaTrader 4 的多周期 MACD 背离指标。它可在 单一图表上同时监控最多 6 个时间周期 ,检测常规背离与隐藏背离,并在背离得到确认时发出提醒。 该指标的开发旨在解决标准 MACD 背离工具中三个常见的局限:单周期分析、信号重绘以及背离线绘制不一致。 主要功能 多周期分析 该指标在单一图表窗口中显示当前周期以及最多 5 个更高周期的 MACD 数据。每个周期分配不同的颜色以便于识别。周期可通过设置面板或图表按钮(1–6)启用或禁用。 重绘控制 信号可配置为在 K 线 0(实时)或 K 线 1(已确认、已收盘的 K 线)上触发。设为 K 线 1 时,信号不会在事后被重新绘制。 背离检测 该指标可在所有活动周期上检测常规背离与隐藏背离。「Increase Divergence Range」参数可延长回溯周期,以捕捉更远摆动点之间的背离。 多周期共振(Confluence)
Overview MGH-CrossAlert Histogram is a sub-window histogram indicator for MetaTrader 5. It displays the relationship between any two configurable lines as a color-coded histogram bar by bar, showing which line is dominant, how large the gap between them is, and when a crossover occurs. The histogram runs in a separate sub-window, keeping the price chart uncluttered. How It Works Each bar on the histogram reflects the live relationship between the two selected lines: Green — Line 1 is above Line