适用于MetaTrader 5的技术指标 - 27
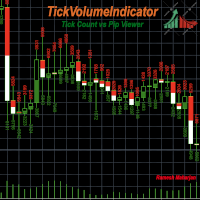
有多种指标和方法可用于识别图表中的趋势。TickVolumeIndicator 就是其中之一。它通过使用逐笔报价数据显示过去的趋势,帮助您识别和预测未来趋势。
TickVolumeIndicator 是一种使用逐笔报价交易量为图表中可见的 K 线图绘制颜色的指标。逐笔报价交易量指的是买入价和卖出价。用户可以选择逐笔报价的买入价和卖出价计数,或 K 线图时间范围内的点差变化。当卖出价大于之前的卖出价时,会添加卖出价计数;当买入价小于之前的买入价时,会添加买入价,两者均根据 K 线图高度进行标准化,以便在图表中显示。点差变化的计算方式相同。
用户有以下选项:
1) 卖出价颜色:用户可以选择红色、绿色、蓝色、紫色、黄色、青色、紫红色、棕色、橙色、粉色、白色或无作为卖出价颜色。默认为绿色。
2) 买入价颜色:用户可以选择红色、绿色、蓝色、紫色、黄色、青色、深紫色、棕色、橙色、粉色、白色、无作为买入价颜色。默认为红色。
3) 点数 vs 点数:用户可以选择显示点数颜色或点数变化颜色。默认为点数。
4) 边框类型:用户可以选择扁平、凸起和非动态指针作为边框类型。默认为凸起。
5)
FREE

Introducing the Professional Arka STM Signal Indicator
With Arka Candle Close Time – 100% Free Version Fast, Accurate, and Unmatched in Identifying Trading Opportunities
This indicator is the result of combining advanced price action analysis with specialized market algorithms, delivering clear, timely, and profitable signals. Completely Free – No Installation or Usage Limits
️ An automated trading bot, fully synchronized with it, is also ready to run. The Power of ARKA STM Signa
FREE

For those who love to follow Volume behavior here it is a little indicator that could be used as a replacement for the old and standard MT5 built-in volume indicator. The trick here is that this indicator paints the volume histogram based on the direction of the candle giving to the trader a quick "Heads Up" on what is happening, visually! It could be used to study and see for instance, the volume and past bars volume during (or, reaching) a peak (Tops and Bottoms). UP candles are shown in pale
FREE

This indicator converted from 5 min Buy and Sell Range Filter - guikroth version on TradingView Popularity of the Range Filter
The Range Filter is a very popular and effective indicator in its own right, with adjustments to the few simple settings it is possible to use the Range Filter for helping filter price movement, whether helping to determine trend direction or ranges, to timing breakout or even reversal entries. Its practical versatility makes it ideal for integrating it's signals into a

The purpose of Impulse Release is to prevent trading in the wrong direction. While the Impulse System operates in a single timeframe, Impulse Release is based on two timeframes. It tracks both the longer and the shorter timeframes to find when the Impulse points in the same direction on both. Its color bar flashes several signals: If one timeframe is in a buy mode and the other in a sell mode, the signal is "No Trade Allowed", a black bar. If both are neutral, then any trades are allowed, showi

Hidden Edge – High-Low PreUS High-Low PreUS is a clean and lightweight indicator that marks key reference levels before the US session begins.
It draws a session box from 00:01 to 09:00 CET, identifying the high and low of the Asian session, and includes additional reference elements to support structured intraday trading decisions. Features Draws a rectangular range from 00:01 to 09:00 CET Marks the high and low of the session clearly Plots a horizontal yellow line as a suggested stop level bas
FREE
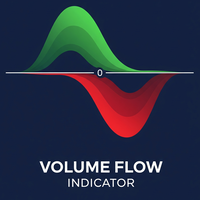
Volume Flow Indicator (VFI) - User Manual 1. General Introduction The Volume Flow Indicator (VFI) is an advanced technical oscillator designed to measure the strength and sustainability of a price trend by incorporating both price and volume data. Developed based on the concepts of On-Balance Volume (OBV) but with significant improvements, the VFI provides deeper insight into money flow and the conviction behind price movements. This indicator is not an automated trading system but a powerful an
FREE
VWAP (Volume Weighted Average Price) is a technical analysis indicator that shows the average price of an asset, weighted by trading volume, over a specified time period. It is calculated by dividing the total dollar value traded (price × volume) by the total volume. Formula: VWAP = sum(PRICE*VOLUME)/sum(VOLUME)
MM vwap have 4 options to set anchor:
Month Week Day Session Indicator will be updated in future.
FREE

什么是Pi周期预测 (Pi Cycle Projections)? Pi周期预测是一个专为MetaTrader 5设计的综合交易系统,它为您提供双重优势:它不仅能在当前市场中识别 高概率的入场信号 (基于移动平均线交叉),还能绘制 市场未来潜在情景的可视化地图 。 可以将其视为一个二合一的系统: 一个智能信号生成器 :它通过Pi移动平均线交叉告诉您 何时 行动。 一个战略周期预测器 :它向您展示价格可能 走向何处 。 这两个功能都基于强大的“Pi周期”概念,并辅以多个可选的过滤条件来减少噪音。(请注意:启用这些过滤器后,如果信号不满足任何一个过滤条件,预测线就会消失。) 组成部分一:Pi移动平均线交叉信号生成器(“当下”) 通常,Pi信号产生于移动平均线的交叉。而这个指标通过一个 严格的4层验证过程 , 极少 生成买入或卖出箭头: Pi移动平均线交叉 :当快速移动平均线(例如111)与乘以Pi的慢速移动平均线(例如350 * 3.14)交叉时,信号产生。 强度过滤器 (ADX) :只有当ADX确认存在足够强的趋势时,信号才有效,从而避免了弱势或横盘的移动。 参与度过滤器 (成交量) :
FREE

The big figure is a crucial aspect of forex trading, serving as a reference point for trade execution, risk management, and technical analysis. By understanding the importance of the big figure and incorporating it into their trading strategies, forex traders can improve their decision-making process and increase the likelihood of successful trades. Why is the Big Figure Important? The big figure is important for several reasons: Simplification: Traders often refer to the big figure when discu
FREE

The indicator shows the current timeframe and symbol name. It is also possible to turn on the indication of time until the end of the current bar. In the settings, you can specify: - the location of the indicator in relation to the terminal window, top left, top right, bottom left and bottom right - a row of text display arrangements so that the inscriptions do not overlap each other - color - font - font size.
FREE

帶輸入訊號平均濾波器的趨勢追蹤指示器
此指標充當趨勢追蹤器和過濾器,使用移動平均線作為入場訊號。 移動平均線是確定不同趨勢範圍的關鍵:
- 標準 200 週期主要平均值顯示長期趨勢。 - 50 週期二級平均線指示中期趨勢。 - 20 週期第三平均值表示最短趨勢。 - 九個週期的平均值可作為立即採取行動的入場觸發因素。
此指標對於交易者來說是一個有價值的工具,它可以提供準確、全面的市場趨勢分析,並根據精心選擇的移動平均線來確定及時的入場點。
使用帶有入場訊號平均過濾器的趨勢追蹤指標增強您的交易策略並做出更明智的決策。 立即下載並提高您的交易結果 _____________________________________________________________________________________________________________________
FREE
How To Determine If The Market is Strong Or Weak?
Strength Meter uses an Adaptive Algorithm That Detect Price Action Strength In 4 Important Levels! This powerful filter gives you the ability to determine setups with the best probability.
Features Universal compatibility to different trading systems Advance analysis categorized in 4 levels Level 1 (Weak) - Indicates us to WAIT. This will help avoid false moves Weak Bullish - Early signs bullish pressure Weak Bearish - Early signs bearish press

You may find this indicator helpfull if you are following a session based strategy. The bars are colored according to the sessions. Everything is customisable.
Settings: + Asia Session: zime, color, high, low + London Session: zime, color, high, low + US Session: zime, color, high, low
Please feel free to comment if you wish a feature and/or give a review. Thanks.
FREE

In this indicator you choice a data to be used from yesterday (high, low, open, close, etc) to automatically draw an line to be the zero. And, from that a percentage deviation ("Percentage to be used") is calculated and used to draw others line to both side until a limit be reached.
Both sides can have diferrent colours as show in screenshots. Also, more than one indicator can be used at same time.
FREE

Zone Alerts by iXOpay - MT5 Indicator What it is Indicator that marks price zones and sends alerts when the price touches, breaks, exits, or retests those zones. Neutral, informative tool. No promises of profit. How to use Attach to any symbol and timeframe. Set the zone boundaries and enable the desired events. Optionally enable trend/volatility filters. Receive alerts and manage your plan. Inputs EMA_Period (20/50/100/200) - optional trend filter Stoch_K , Stoch_D , Stoch_Smooth - confirmation
FREE

VWAP WAVE [Riz] - MT5 Indicator Advanced VWAP Divergence Detection System
VWAP Wave is a professional-grade Volume Weighted Average Price indicator with built-in divergence detection system. It identifies high-probability reversal and continuation signals by analyzing price-VWAP relationships across multiple timeframes.
FREE

The initial balance (IB) is a range in which the price spent its first two OPT periods after the opening. In other words, the opening balance is a range of the first hour after the market opened. The opening balance arose from room trading, as room traders observed the various ranges after the market opened.
This indicator allows you to enter the starting and ending hours and minutes of a specific hourly time range so that the trader can set up different IBs according to the market.
Automatic
FREE
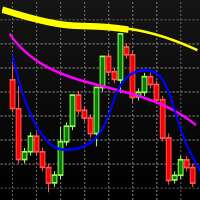
Baseado no indicador MIMA SAR, que é uma combinação dos indicadores MIMA Consolidação e MIMA Tendência, da metodologia Phicube. O indicador é composto pelos 8 fractais, 17,34.72.144.305,610.1292,2554. Sendo a tendência indicada pelas linhas finas e a consolidação pelas linhas mais espessas. Para usar o indicador de maneira adequada deve-se partir do princípio de que tudo na natureza segue o caminho que oferece menor resistência. Isso significa que para uma reversão da tendência ocorrer nesse mod
FREE

https://www.mql5.com/en/users/gedeegi/seller
The design features a bold orange countdown timer icon set against a dark gray background, with the clock hands pointing toward the upper right. Below the timer, a candlestick chart displays green and red bars that represent price movements across different time periods, with sharp detailing and balanced composition. The countdown time of "05:17" is prominently displayed next to the clock, adding a dynamic and informative element to the image.
FREE

Apply to the 5 minute timeframe against the major USD forex pairs. AUDUSD EURUSD GBPUSD USDCAD USDCHF USDJPY Highlights the PropSense Book Levels Turn on/off for Sydney, Asia, London and New York Sessions Shows the Tokyo and London Fixes Turn on/off for Tokyo and London Configure how many historical fixes to show Shows the Sessions Turn on/off visible indication for sessions (supports 4 sessions) Visibly shows the sessions (out of the box configuration for Sydney, Tokyo, London and New York) Hig
FREE

We at Minions Labs love to study, challenge and discover new facts about Price Behavior in current markets. We would NOT call it Price Action because today this is a word totally overused and means, thanks to the False Prophets out there, absolutely NOTHING.
The study hypothesis we propose is this: Some Assets, in certain Timeframes, present a behavior of Price continuity when the candlesticks close without a Wick on them... So the purpose of this indicator is to "color" those candlesticks who
FREE
AZ session scalper
A small but useful session indicator, designed primarily for scalping. Enable the session you plan to trade, watch the reaction of the M5/M15 candlesticks to the level of the previous trading session, and enter. We always look at the reaction of the current session to the previous one. For example, if you trade the Americas, enable the European session, and watch how one session takes away liquidity from another. Important: adjust the time to your broker's time zone in the i
FREE

Purpose and functions of the indicator The indicator determines and marks the moments of trend change on the chart based on the theory of fractal levels breakout on any of the analyzed timeframes. If a breakout based on all rules is valid, a horizontal line with corresponding color will appear on the chart. If there is an uptrend, the line will be blue. In the descending trend, the line will be red. The blue line is a strong support level, the trader should look for buying opportunities above th
FREE
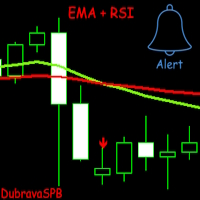
Introducing EMA + RSI – A Trading Indicator Combining Exponential Moving Average (EMA) and Relative Strength Index (RSI) Analysis. The indicator signals trade entries with arrows on the chart when two EMAs cross and the RSI meets the specified conditions.
It is initially optimized for the GBPUSD currency pair on the 1H timeframe, but users can customize it to fit their strategy. Key Features: Flexible settings: Users can adjust EMA length, choose the price for calculation, and configure RSI para
FREE

RITZ Candle Kaufman’s AMA is a precision market-flow indicator built around Kaufman’s Adaptive Moving Average (KAMA / AMA) — a dynamic smoothing algorithm that automatically adjusts to changing volatility.
This enhanced version interprets AMA momentum directly into smart candle-color signals , giving traders a clean, noise-filtered view of trend strength and directional bias. Where most indicators repaint or react too slowly, RITZ Candle AMA delivers stable, non-repainting color shifts based on
FREE
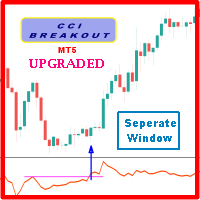
Probability emerges to record higher prices when Commodity Channel Index breaks out oscillator historical resistance level when exhibit overbought values. Since, oscillator breakout of support and resistance have similar effect as price breaks support and resistance levels, therefore, its highly advised to confirm price breakout with oscillator breakout; certainly, will have the same output in short trades. Concept is based on find swing levels which based on number of bars by each side of peak
FREE

FX Correlation Matrix is a powerful multi-timeframe dashboard that helps traders analyze real-time currency correlations of up to 28 symbols at a glance. With customizable settings, sleek design, and manual symbol selection option, it enhances trade accuracy, reduces risk, and identifies profitable correlation-based opportunities. Setup & Guide: Download MT4 Version here. Exclusively for you: It's your chance to stay ahead of the market. Follow our MQL5 channel for daily market insights, char

Pivot Points Classic – L’indicatore essenziale per ogni trader tecnico Questo indicatore disegna automaticamente i livelli di Pivot Point più utilizzati dai trader professionisti, con supporto completo a 4 metodi di calcolo: Metodi supportati :
• Traditional
• Fibonacci
• Woodie
• Camarilla Caratteristiche principali :
Calcolo su timeframe superiore (multi-timeframe)
Visualizzazione chiara dei livelli P, R1, R2, R3, S1, S2, S3
Etichette dinamiche con nome e valore del livello
Colori per
FREE

欢迎使用 KMeans Price Zones Detector,这是一款创新的 MetaTrader 指标,利用机器学习的强大功能来识别关键的价格区间。该工具使用 KMeans 聚类算法动态检测价格数据中的中心点,突出显示价格更可能遇到支撑、阻力或整合的区域。 创新的 KMeans 算法 KMeans Price Zones Detector 之所以出众,是因为它先进地使用了 KMeans 聚类算法,这是一种在模式识别中以其效率和准确性而著称的机器学习技术。通过分析历史价格数据,指标识别代表显著价格水平的集群或中心点。然后利用这些中心点计算支撑和阻力区,为交易者提供关于潜在价格反转、突破和整合的重要信息。 主要特点 动态区域检测: 指标根据最新的市场数据不断更新价格区域,确保交易者始终掌握最相关的信息。 适用于所有时间框架: 无论您是在 1 分钟图表上进行短线交易还是在日线图表上进行长期投资,KMeans Price Zones Detector 都能无缝适应,提供准确的区域检测。 兼容所有外汇对: 该指标设计用于任何外汇对,为交易多种货币的交易者提供了灵活性和多功能性。 全面的 A
FREE

** All Symbols x All Timeframes scan just by pressing scanner button ** *** Contact me to send you instruction and add you in "Head & Shoulders Scanner group" for sharing or seeing experiences with other users. Introduction: Head and Shoulders Pattern is a very repetitive common type of price reversal patterns. The pattern appears on all time frames and can be used by all types of traders and investors. The Head and Shoulders Scanner indicator Scans All charts just by pressing

Divergence Hunter - Professional Multi-Oscillator Divergence Detection System Overview Divergence Hunter is a professional-grade technical indicator designed to automatically detect and visualize price-oscillator divergences across multiple timeframes. Built for serious traders who understand the power of divergence trading, this indicator combines precision detection algorithms with an intuitive visual interface. Key Features Multiple Oscillator Support: RSI (Relative Strength Index) MACD (Mo
FREE

该算法基于货币功率计指标的思想。在此版本中,显示值的数量不受限制,其代码更加紧凑和快速,可以通过指标缓冲区获取当前柱的值。 指标显示的内容 :货币前的细条带和上方数字显示最近 N 小时的相对强弱指数(N 在变量“小时”的参数中设置),较宽的条带显示每日指数。您在输入参数中指定的使用该货币的货币对越多(假设您的经纪商为这些货币对提供报价),该指数的权重就越大(但要小心“非主要”或外来货币对,它们可以扭曲整体画面)。例如,如果您只指定了 EURUSD,则欧元的相对指数将仅基于此对计算,如果您添加 EURGBP,则欧元指数将基于两个对计算并获得更加权的值。 如何使用数据 :在没有重要新闻的情况下,指数值越低/越高,技术修正或趋势延续的可能性就越大。
FREE

基于微观结构与物理场论的AI自适应市场全息系统指标 摘要 : 本文旨在探讨一种新型金融市场分析工具——“微观结构引力价格回归AI自适应系统(Micro gravity regression AIselfregulation system)”的构建原理与实现机制。该系统融合了市场微观结构(Market Microstructure)理论、经典力学中的弹性与引力模型、信息熵理论以及自适应人工智能算法。通过对Tick级数据的实时聚合、吸收密度的物理建模以及基于熵的动态衰减机制,该系统试图构建一个能够量化市场“质量”、“张力”与“状态”的动态物理场,为高频与波段交易提供可视化的决策支持。 1. 引言 (Introduction) 传统技术指标(如MA, RSI)多基于收盘价的线性处理,往往滞后且难以捕捉价格内部的博弈细节。随着高频交易的发展,基于订单流(Order Flow)和微观结构的数据变得至关重要。本研究提出的MicroStructure HUD系统,不再单纯视价格为数字序列,而是将其视为具有“质量”和“能量”的物理实体,通过模拟物理场中的引力中心(Center of Mass, CoM

Thermo MAP is a multicurrency and multitimeframe indicator that display a smart heat map based on proprietary calculations. Watch how Forex market moved and is currently moving with a single dashboard and have a consistent and good idea of what is happening!
It can be suitable for both scalping or medium/long term, just select options that better fit your trading style Symbols list are automatically sorted based on the preferred column. There is the possibility to click on: First row, timeframe
FREE

Вилка Нео v5, разрабатывалась для торговой системы "Оракул", но постепенно дополнялась, например - углами Ганна и другими опциями... Можно создавать графические объекты с заданным цветом, стилем и толщиной, такие как: прямоугольники с заливкой и без, отрезки трендлиний и нестандартный инструмент - "вилка Нео" в виде трезубца, так же есть возможность интерактивно настраивать цветовую палитру прямо с графика, настраивать видимость объектов для разных ТФ, толщину и стили...
Панель переключается кл
FREE

Forex 17 – Bollinger Bands Pure Sound Alert No Plots 是一款基于布林带的纯声音提醒指标。当价格突破布林带上轨或下轨时,指标会自动触发声音提醒,并针对向上突破与向下突破分别使用不同的提示音,帮助交易者快速识别潜在的超买或超卖状态。 该指标为无绘图版本,不会在图表上显示任何视觉元素,非常适合希望保持图表简洁、减少视觉干扰的交易者。所有监控均通过声音完成,使用户即使在不持续盯盘的情况下,也能及时获知关键价格行为。 可自定义参数包括布林带周期、标准差偏移设置,以及连续提醒之间的最小时间间隔。通过这些设置,用户可以根据自身交易风格和时间框架灵活调整提醒逻辑。 纯声音的设计理念使该指标非常适合多图表、多品种监控场景,同时保持图表清晰、专注于价格行为本身。 由人工智能辅助翻译。
FREE
[ MT4 Version ] Order Block Indicator MT5 — Precision Trading Made Simple
Order Block Indicator MT5 is designed to help traders spot powerful reversal zones effortlessly — without cluttered charts or guesswork.
Built for scalping , swing trading , and smart intraday decisions , it highlights active order blocks across multiple timeframes with precision, speed, and full customization. Trade with clarity, save valuable time, and react instantly to market structure changes — even across Forex

El **Heiken Ashi Smoothed** es una versión suavizada del indicador técnico Heiken Ashi, que se utiliza en el análisis de gráficos de velas para identificar tendencias del mercado y pronosticar movimientos de precios. Este indicador se basa en el promedio de datos de precios para formar un gráfico de velas que ayuda a los traders a filtrar el ruido del mercado.
**¿Para qué sirve?** Este indicador se utiliza para identificar cuándo los traders deben permanecer en una operación y cuándo está por
FREE

WYSIWYG Candle for WYSIWYG ORB Smart Breakout Candles is a professional multi-method breakout detection indicator that combines ATR, Bollinger Bands, Opening Range Breakout (ORB), and Squeeze Detection to identify high-probability breakout opportunities across all financial instruments. This indicator provides real-time visual signals through colored candles and precise arrow placements, making it ideal for traders seeking reliable volatility-based entries. "Use in conjunction with the WYS
FREE

I'm sure after a lot of research on the internet, you haven't found any indicator that can help you with forex or binary trading in the latest probability strategy created by famous trader Ronald Cutrim. The strategy is based on a simple count of green and red candles, checking for a numerical imbalance between them over a certain period of time on an investment market chart. If this imbalance is confirmed and is equal to or greater than 16%, according to trader Ronald Cutrim, creator of the pro
FREE
If you love this indicator, please leave a positive rating and comment, it will be a source of motivation to help me create more products <3 Key Takeaways StochRSI is an oscillator that measures the RSI level relative to its high-low range over a period of time. It is more sensitive than the traditional RSI and can highlight overbought or oversold conditions in the market. StochRSI is typically used to generate more frequent and timely trading signals compared with the traditional RSI. StochRSI
FREE

N/B: All our product purchase comes with our free ‘’DAILY SCALPER EA’’ - bit.ly/4qlFLNh Whatsapp Developer for yours after successful purchase
Eternal Spike Detector Pro - M5 Mastery System
HOW TO TRADE THIS SYSTEM
TRADING RULES
For CRASH 500/900/1000:
SELL SETUP:
· Wait for RED DOWN ARROW to appear · Enter SELL at the close of the M5 candle where arrow appears · Stop Loss: 1.5x ATR above the entry high · Take Profit: 2-3x ATR below entry · Only trade maximum 7 signals per day

The Spider ZIGZAG is an algorithm to determine how critical the current peak is by spreading several lines with different parameters instead of one line between each 2 peaks. 1. The more zigzag's lines meet at a peak the higher probability the market will go for correction or change direction. 2. Usually when 3-4 zigzag's lines meet at a peak, the market enters a correction period, this don't happen instantly, it might take some time. 3. Usually when 5-6 zigzag's lines meet at a peak, th
FREE

The Price Action Finder Multi indicator is an indicator of entry points that searches for and displays Price Action system patterns on dozens of trading instruments and on all standard time frames: (m1, m5, m15, m30, H1, H4, D1, Wk, Mn). The indicator places the found patterns in a table at the bottom of the screen. By clicking on the pattern names in the table, you can move to the chart where this pattern is located. Manual (Be sure to read before purchasing) | Version for MT4 Advantages
1. Pat

“Naturu” 是一个使用大自然对称性作为算法的手动指标。
用简单策略和隐藏智慧,掌控市场! 加载指标后,您会看到两条线——上线(Top)和下线(Bottom)。
单击一次即可激活某条线。要移动,只需点击您想放置该线的那根K线。 您设定一个高点和一个低点,指标会自动计算: 洋红色区域,显示多空双方兴趣最接近之处,也就是最有可能成为支撑/阻力的区域。 灰色区域,标示下一层次的关注区。 青绿色线条,表示多方的目标价位。 金色线条,表示空方的目标价位。 手动指标赋予您完全的控制和灵活性,让您根据实时市场环境和个人直觉调整级别。它们迫使您更深入地亲自分析价格走势,帮助您真正理解支撑、阻力和形态是如何形成的。依靠人工判断,可以过滤掉自动系统常常误判的大量“噪音”,减少错误信号。而且,因您亲自设定每个级别,可在突发新闻或极端行情时立即调整,无需等候代码更新。 隐藏于简单游戏背后的神圣力量!
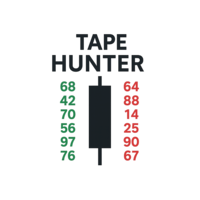
Tape Hunter – 您在MT5上的努力与结果雷达 Tape Hunter 是为希望洞察MetaTrader 5价格背后真实动态的交易者打造的终极指标。它基于POC(控制点)直观清晰地显示买卖双方的激进成交量,让您能够直观地看到市场的努力与每根K线上的实际结果。 ️ 这为何重要?
并非所有成交量都能推动价格!Tape Hunter 突出显示努力(激进成交量)是否真正推动了价格,有助于识别: 真正的激进行为和陷阱所在 市场是否被吸收或持续推动 主导成交量与价格方向的一致性 使用 Tape Hunter,您将获得专业的Tape Reading视角,更精准地做出进出场决策。 相关指标 – 提升您的流动性分析 为更高效交易,推荐与 Tape Hunter 配合使用以下强大指标: Big Player Range
映射机构交易者活跃区域,提供回调概率预测。与 Tape Hunter 结合,验证大玩家强势操作区域的激进行为。 ️ Imbalance DOM Pro
读取订单簿(DOM)中的失衡,预测隐藏的价格压力。与 Tape Hunter 共同使用,

Auto Optimized RSI 是一款智能且易于使用的箭头指标,旨在实现精准交易。它利用基于历史数据的模拟,自动识别当前品种和时间周期中最有效的 RSI 买入和卖出水平。 该指标既可以作为独立的交易系统使用,也可以结合您的其他交易策略一起使用。尤其适合日内交易者使用。 与传统 RSI 指标使用固定的 70/30 水平不同, Auto Optimized RSI 会根据真实的价格行为和回测结果动态调整水平。它会跟踪胜率、回撤和平均盈亏等关键指标,从而适应市场当前的走势,并基于“实际有效”的逻辑发出信号。 当 RSI 穿越经过优化的关键区域时,指标会在图表上显示 Buy 和 Sell 箭头,帮助交易者找到成功率更高的进场机会。 购买后请务必联系我,以获取额外赠送的工具和专属交易建议! 祝您交易顺利,稳步盈利!

Heiken Ashi Yemeni Heiken Ashi Yemeni is a professional indicator for MetaTrader 5 that combines modified Heiken Ashi candles with two smart trend lines ( Yemen 1 & Yemen 2 ) based on advanced and complex internal calculations, providing a clearer view of the trend and reducing market noise. The indicator is designed to give traders a smooth and easy-to-read market overview , making it suitable for manual trading and trend-based strategies . Indicator Features Enhanced Heiken Ashi candles for
FREE

This indicator that I am sharing publicly is an adaptation for MetaTrader 5 (MT5), and I want to make it absolutely clear that it is not my original work . The original code was published on the TradingView platform and can be freely accessed at the following official link:
TradingView – Original Indicator The reason for making it public on MetaTrader 5 is that I want more people to have free access to it, just as its original author shares it on TradingView. This publication is not intended
FREE

TransitGhost Signal indicator, this is one of my best forex trading strategy. The strategy is based on the simple moving average cross, 5 SMA AND 200 SMA of which take a longer time to cross. Whenever the is a cross between the 5 SMA and 200 SMA a signal will be given, when the 5 SMA cross the 200 SMA to the upside ,a buying arrow will appear on chart, and push notification(alert) "Buy now, use proper risk management" will be sent on both the MT5 PC and mobile app, and when the 5 SMA cross the 2
FREE
用于二元期权的信号指标,也可以在外汇以及其他市场上高效使用。适合在 M1–M5 上进行短线网格交易,并包含逐步加仓的信号。 免费版本仅适用于 XAUUSD 货币对。MetaTrader 5 的完整版在这里: https://www.mql5.com/en/market/product/156185 该指标使用两级自适应机制:基础速度轮廓(从一开始就可设置为“快速/平滑”)以及基于交易结果的自动自适应,根据当前市场调整过滤器,并考虑连续获利和亏损信号的情况。 模型在图表上寻找短暂的定向脉冲,并在 K 线收盘时用 CALL(买入)和 PUT(卖出)箭头标记出来,不会重绘。该指标也可以用于传统的 Forex/CFD 账户,但由于持仓周期较短,务必控制点差和佣金,避免成本“吞噬”大部分价格波动。 工作原理 使用自有的多级自适应预测模型,而不是标准的经典指标组合; 分析价格运动的形态与斜率、趋势以及局部波动率; 通过多层噪音和异常波动过滤来分析信号; 只有在通过所有内部检查后才给出箭头信号:智能平滑、过滤逆趋势逻辑、自适应极值过滤器(尽量避免在可能的反转点给出信号)、以及在线自适应市场的轻量级神
FREE

About the indicator: DALA Forecast is a universal tool for predicting the dynamics of time series of any nature. For prediction, modified methods of nonlinear dynamics analysis are used, on the basis of which a predictive model is built using machine learning methods. To get the trial version of the indicator, you can contact me in private messages.
How to use the indicator: Apply the indicator to your chosen financial instrument or indicator with the settings you need. The prediction will be
FREE

English
VWAP Daily (Clean) is a simple and lightweight indicator that plots the classic Daily VWAP (Volume Weighted Average Price) directly on your MT5 chart. Features: Classic Daily VWAP calculation Supports real volume (if available) or tick volume Timezone offset option to match your broker’s server time Weekend merge option (merge Saturday/Sunday data into Friday) Clean version → no arrows, no alerts, only VWAP line VWAP is widely used by institutional traders to identify fair value, su
FREE

PRO VERSION https://www.mql5.com/en/market/product/144989?source=Site https://www.mql5.com/en/users/gedeegi/seller GEN Support & Resistance (EGGII77) is an MT5 indicator that automatically detects and draws Support & Resistance levels based on pivot highs and lows. The indicator features two sets of S&R (main structure and quick levels), a customizable maximum number of lines, adjustable colors, and a clean chart display for clearer price action analysis.
FREE
The Sessions and Bar Time indicator is a professional utility tool designed to enhance your trading awareness and timing precision on any chart. It combines two key features every trader needs — market session visualization and real-time bar countdown — in one clean, efficient display. Key Features: Candle Countdown Timer – Shows the remaining time before the current candle closes, helping you anticipate new bar formations. Market Session Display – Automatically highlights the four main trading
FREE

The RSI Divergence Indicator is a powerful tool designed to identify potential reversals in the market by spotting discrepancies between the Relative Strength Index (RSI) and price movement. Divergences can be a significant indication of an impending trend change, either from bullish to bearish or vice versa. This indicator is built for making the task of identifying potential trade opportunities more straightforward and efficient.
Features: Automatic Detection: The indicator scans the chart
FREE

Synthetic Reverse Bar is an evolution of Reverse Bar indicator. It is well-known that candlestick patterns work best at higher timeframes (H1, H4). However, candlesticks at such timeframes may form differently at different brokers due to dissimilarities in the terminal time on the single symbol, while the history of quotes on M1 and M5 remains the same! As a result, successful patterns are often not formed at higher timeframes! Synthetic Reverse Bar solves that problem! The indicator works on M5
This indicator is a sophisticated MetaTrader 5 tool that calculates and displays Average Daily Range (ADR) levels on your chart. It draws horizontal lines representing expected price movement ranges based on historical daily volatility, helping traders identify potential daily high and low targets. ADR (Average Daily Range) = The average difference between the daily high and low over a specified period (default: 14 days). Unlike ATR which includes gaps between days, ADR focuses purely on int
FREE

Channels indicator does not repaint as its based on projecting the falling and raising channels. As a trader you need a path to be able to place your buy and sell trades such as: Supply and Demand , Falling & raising channels. Falling and raising channels can be in any time frame and also can be in all time frames at the same time and the price always flows within these channels. Experienced trades will draw the key levels and channels around the time frames. But, they will not be able to draw
FREE

真正的陀螺指示器
它检测图表上准确的陀螺,平衡的主体和灯芯高度比,这是陀螺的真正含义,不同于锤子和十字线或空烛台。
该指标在图表上找到的陀螺数量处绘制了一个翼形图标。
设置包括
条数:调整搜索条数
图标颜色:更改图标颜色
图标代码:更改图标的wingdings代码
真正的陀螺指示器
它检测图表上准确的陀螺,平衡的主体和灯芯高度比,这是陀螺的真正含义,不同于锤子和十字线或空烛台。
该指标在图表上找到的陀螺数量处绘制了一个翼形图标。
设置包括
条数:调整搜索条数
图标颜色:更改图标颜色
图标代码:更改图标的wingdings代码
真正的陀螺指示器
它检测图表上准确的陀螺,平衡的主体和灯芯高度比,这是陀螺的真正含义,不同于锤子和十字线或空烛台。
该指标在图表上找到的陀螺数量处绘制了一个翼形图标。
设置包括
条数:调整搜索条数
图标颜色:更改图标颜色
图标代码:更改图标的wingdings代码
FREE

PriceActionMatrix - 多模式剥头皮助手 PriceActionMatrix 是一款面向剥头皮交易的指标,能自动识别并验证多种短期价格行为模式。该工具并非将每根K线视为独立信号,而是聚合诸如Pin Bar(钉线)、Engulfing(吞没)、Inside Bar(内包线)、盘整区域和拒绝影线等多种模式,并使其经过可配置的确认层——趋势和EMA检查、ATR范围、动量指标以及可选成交量过滤器——因此您能获得适合手动交易或EA集成的、富含上下文的信号。 风险管理变得简单:该指标在图表上绘制基于ATR的止损/止盈指导线,并可显示可选的价格标签。通过弹窗和声音提供清晰的警报,并且关键输出通过iCustom暴露以供专家顾问使用。PriceActionMatrix针对快速时间框架(M1)进行了优化,当您偏好更少但更高质量的信号时,在M5上也表现可靠。 该指标的与众不同之处在于其多模式识别引擎与灵活的确认规则相结合。您可以启用或禁用单个模式,要求收盘确认(ConfirmOnClosedBar)以避免重绘,或允许K线内触发以获得更快的响应。趋势上下文(多个EMA和斜率阈值)、ADX/D

趋势指标是用于金融市场交易的技术分析领域之一。
Angular Trend Lines - 全面确定趋势方向并产生入场信号。除了平滑蜡烛的平均方向
它还利用趋势线的倾斜角度。构建江恩角度的原理被当作倾斜角度的基础。
技术分析指标结合了烛台平滑和图表几何。
趋势线和箭头有两种类型:红线和箭头表示看涨方向。紫线和箭头表示看跌方向。
指示器功能
该指标使用简单、参数配置方便,可用于趋势分析和接收开仓信号。
指示器不会重新绘制,箭头出现在蜡烛的收盘处。
当信号发生时提供多种类型的警报。
可用于任何金融工具(外汇、加密货币、金属、股票、指数)。
该指标可以在任何时间范围和图表上发挥作用。
该指标采用轻量级算法,不加载处理器,确保在多个窗口中使用。
根据时间范围和交易方法选择参数。
主要输入参数
Period - 用于分析计算的蜡烛数量。
Angle ——趋势线的斜率。

这是一个清晰的判断顶部和底部的指标,用于盘整有很好的效果。
促销价 49$ → 59$
特点 很好的判断顶部和底部 不重绘,不漂移 快速计算,不卡 丰富的提醒模式 多个参数和颜色可调整
参数 "======== Main ========" HighLowPeriod1 = 9 HighLowPeriod2 = 60 HighLowPeriod3 = 34 HighLowEMAPeriod = 4 MASignalPeriod = 5 "======== Notify ========" UseAlertNotify = true; UseMetaQuotesIDNotify = true; UseMailNotify = true; NotifySignalMode = Change Color and Check Level; HighLevel = 80; LowLevel

UZFX SWS {剥头皮盈利信号} Pro v1.0是由Usman Zabir(UZFX实验室)专为剥头皮交易者、日内交易者及波段交易者开发的强力无重绘指标,旨在快速波动市场中提供精准入场信号。特别适合追求可靠实时信号、拒绝延迟或虚假重绘的交易者。
我推荐*的最佳时间周期:30分钟及以上。 {1小时}是我的首选,其效果令人惊叹...!
核心功能包括:
清晰的视觉箭头标示近期及历史信号(可选点状显示过往信号)。 自动计算并绘制交易线:入场点、止损位(基于近期震荡高低点)及多档止盈位(风险回报比1:1、2:1、3.5:1——完全可自定义)。 图表信息面板实时显示最新信号详情、入场价、止损位及止盈位。 全面警报系统:弹窗提示、声音提醒、推送通知及邮件提醒。 图表自定义选项(颜色、背景、K线样式)。 内置许可证过期系统保障安全分发(可通过更新日期续期)。 适用于所有货币对、大宗商品及时间周期,UZFX SWS PRO助力交易者识别盈利性短线机会,并实现增强型风险回报管理。
无重绘 | 精准信号 | 专业交易可视化

这个多时间框架和多品种指标扫描 Pin bar、晨星/晚星、吞没、镊子、三线罢工、内线和三角旗。 该指标也可用于单一图表模式。请在产品的 博客 。 结合您自己的规则和技术,该指标将允许您创建(或增强)您自己的强大系统。 特征
可以同时监控您的市场报价窗口中可见的所有交易品种。将该指标仅应用于一张图表,并立即监控整个市场。 监控从 M1 到 MN 的每个时间范围,并在识别出模式时向您发送实时警报(弹出、推送或邮件)。 可以使用 RSI 和布林带作为 pin bar、晨星/晚星 、吞没和镊子形态的 过滤器,以便正确识别潜在的逆转。 可以使用移动平均线作为主要趋势过滤器,使用 ADX 作为波动率过滤器。 该指示器包括一个交互式面板。当单击一个项目时,将打开一个带有相关代码和时间范围的新图表。 该指标可以将信号写入一个文件,EA 可以使用该文件进行自动交易。比如 这个产品 。
Pennant 和三角形扫描可识别高概率的突破模式。它通过识别强大的、对称的三角旗和三角形来做到这一点。这种模式在更高的时间范围内不会经常出现。但是当它发生时,这是一个非常高概率的设置。请参见 截

MarketCrack – Whale Detector: 与智能资金保持一致 MarketCrack – Whale Detector 是一款专业的指标,旨在可视化、提前地检测大型市场参与者(即“巨鲸”)的活动。其目的是识别机构压力的关键时刻,使交易者能够与智能资金的方向保持一致,并更加自信地做出战略决策。 功能与目标 MarketCrack – Whale Detector 分析多个关键时间周期(从H1到H12)的价格行为和交易量,以识别机构压力的模式。其系统收集这些信息并以紧凑、专业的视觉面板呈现,清晰显示每个时间周期中“巨鲸”活动的强度和方向。当多个时间周期对齐时,该指标会自动突出显示,让用户能够更早地发现由大型交易者主导的趋势,并做出明智的决策。 确认与警报 为了提高稳健性,当所有时间周期都显示同一方向的压力时,信号被视为确认。然而,警报系统经过优化,旨在预测机会:当7个时间周期中至少有6个显示一致信号时,警报就会触发。这使得用户能够领先于巨鲸的行动,同时不失检测的稳健性。 配置与个性化 默认设置(ATR为30,成交量为10)旨在提供专业且多币种的平衡,适应大多数资产和交易风

Ritz Area Konsolidasi – Smart Market Compression & Breakout Visualizer
The Ritz Area Konsolidasi indicator intelligently detects and visualizes market consolidation zones — areas where price movement is compressed within a defined range before a potential breakout. By combining adaptive ATR-based volatility analysis with precise range logic, it helps traders identify key accumulation, distribution, or indecision zones in real time. Core Functionality: Dynamic Consolidation Detection
Identifie
FREE

Gann Box 指标是一个强大且多功能的工具,旨在帮助交易者识别和利用市场的关键水平。该指标允许在图表上绘制一个矩形,该矩形会自动划分为多个区域,并带有战略水平 0, 0.25, 0.50, 0.75, 1 。当价格触及其中一个水平时,会触发警报,从而为交易决策提供宝贵的帮助。您可以即时了解市场相对于您绘制区域的变化情况。要绘制一个区域,只需绘制一个简单的矩形并将其命名为 GannBox 。 该指标适用于所有类型的交易者,无论是使用 支撑和阻力 概念、 供需 理论的交易者,还是 ICT 技术或 公平价值缺口 (FVG) 专家。 无论您是 日内交易者 、 波段交易者 还是 趋势交易者 , Gann Box 都可以帮助您更好地理解和预测市场走势,同时提高您的反应能力和交易表现。 MT4 版本
Gann Box 是一个 多时间框架 指标:它可以绘制在更大的时间框架上,比如 H1,同时允许在较小的时间框架(如 15 分钟图表)上进行更精确和快速的交易。 除了其灵活性之外,该工具还可以通过直观的 管理面板 在图表上进行全面自定义。此面板允许根据您的偏好激活或禁用每个级别,并启用或禁用相关的警

Full Description Overview Drawdown Controller Calculator Indicator is an advanced professional risk-management tool for MetaTrader 5 , specially designed for traders who use multiple running trades, pending orders, grid systems, and martingale strategies . This indicator allows you to see the future drawdown in advance — not only for currently running trades, but also for all pending orders combined , assuming they get triggered step by step. Instead of guessing or hoping, you will know ex
FREE
MetaTrader市场是一个简单方便的网站,在这里开发者可以出售自己的交易应用程序。
我们将帮助您发布您的产品,并向您解释如何为市场准备您的产品描述。市场上所有的应用程序都是加密保护并且只能在买家的电脑上运行。非法拷贝是不可能的。
您错过了交易机会:
- 免费交易应用程序
- 8,000+信号可供复制
- 探索金融市场的经济新闻
注册
登录