Modified Accelerator Oscillator

5

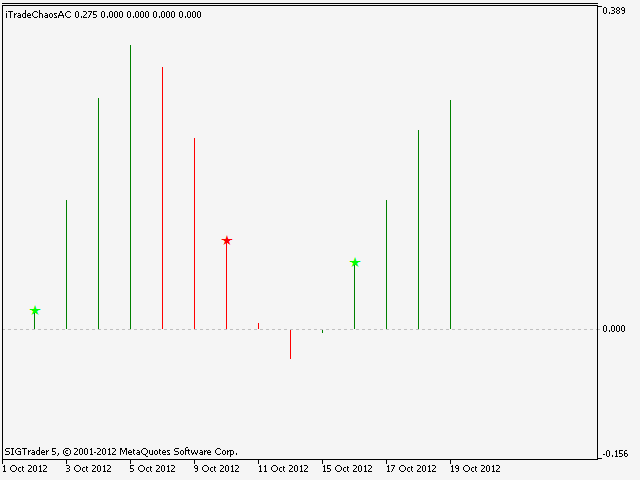
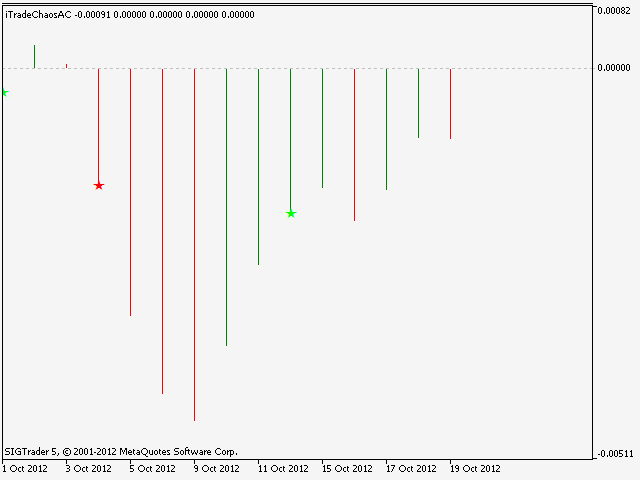
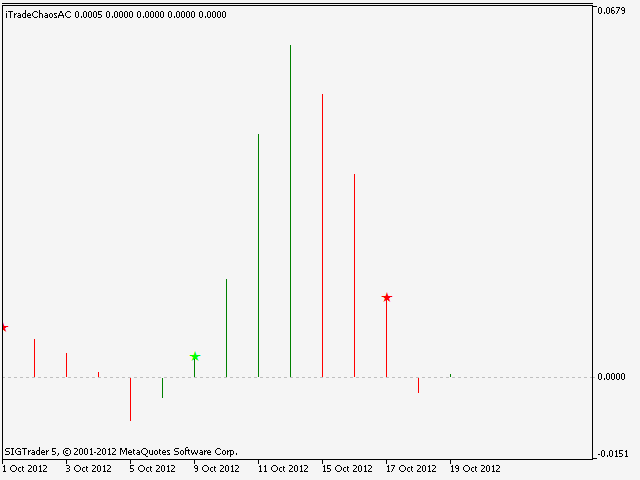
本指标的主要目的是根据 "混沌交易, 第二版" 和 "新交易维度" 的描述,在加速振荡器的直方图里检测并标记交易信号。信号列表:

  1. 当指标直方条低于零轴此为做多信号。
  2. 当指标直方条低于零轴此为做空信号。
  3. 当指标直方条高于零轴此为做空信号。
  4. 当指标直方条高于零轴此为做多信号。 
  5. 当指标直方条与零轴交叉此为做多信号。 

指标包括一个信号块,用来方便地通知交易者任何新信号的形成。

本指标是基于 "混沌交易" 和 "新交易维度" 策略的复杂交易系统的一部分。本指标是形态的一部分。建议指标与以下产品配合使用:

评分 1
PROFITFACTOR1
106
PROFITFACTOR1 2021.06.29 21:52 
 

В комплекте с панелью нужный индикатор

推荐产品
The Dual MACD & Stochastic Expert Advisor (EA)  is a fully automated trading system that utilizes two  MACD (Moving Average Convergence Divergence) indicators along with the  Stochastic Oscillator  to identify high-probability trading opportunities. By combining trend confirmation from MACD with momentum analysis from Stochastic, this EA provides precise entry and exit points for optimized trading performance. Key Features: • Dual MACD Strategy – Uses two MACD indicators with different setting
FREE
Fair Value Gap Zone
Mattia Impicciatore
总体描述 Fair Gap Value 指标在 MetaTrader 5 图表上识别并突出显示“公平价值缺口”(fair value gaps)。当一根 K 线的最低价与隔一根中间 K 线后的另一根 K 线的最高价之间形成价格空白时,就产生了公平价值缺口。该指标使用彩色矩形(多头和空头)标注这些区域,为基于价格行为的交易策略提供直观支持。 主要功能 多头缺口检测 :用绿色矩形高亮当前 K 线最低价与两根前序 K 线最高价之间的缺口。 空头缺口检测 :用红色矩形高亮当前 K 线最高价与两根前序 K 线最低价之间的反向缺口。 动态延展 :可将矩形向右延伸指定数量的 K 线。 透明度控制 :可配置矩形的不透明度,以免遮挡底部图表。 显示开关 :支持单独开启或关闭多头/空头缺口的绘制。 历史扫描限制 :可选设置扫描的最大 K 线数量,以提升大数据量图表的性能。 自动清理 :切换周期或首次加载时,会自动删除并重绘所有已有缺口。 输入参数 LookbackBars :用于计算缺口的回溯 K 线数量(默认 3)。 MaxBars :最大扫描 K 线数量(0 = 不限;默认 0)。 ShowBullG
FREE
PZ The Zone MT5
PZ TRADING SLU
5 (1)
This indicator displays buy or sell signals according to Bill Williams' definition of the Trading Zone. [ Installation Guide | Update Guide | Troubleshooting | FAQ | All Products ] Easy to use and understand Avoid trading flat markets Deterministic indicator with clear rules The indicator is non-repainting It implements alerts of all kinds It has straightforward trading implications. A blue arrow is a buy signal A red arrow is a sell signal According to Bill Williams trading in the zone helps t
FREE
VolumeBasedColorsBars
Henrique Magalhaes Lopes
VolumeBasedColorsBars — Free Powerful Volume Analysis for All Traders Unlock the hidden story behind every price bar! VolumeBasedColorsBars is a professional-grade, 100% FREE indicator that colorizes your chart candles based on real, adaptive volume analysis. Instantly spot surges in market activity, identify exhaustion, and catch the moves that matter. This indicator gives you:    • Dynamic color-coded bars for instant volume context    • Adaptive thresholds based on historical, session-awar
FREE
Pivot Points Indicator – a fast, reliable, and fully customizable pivot detection for MetaTrader 5. This indicator uses MetaTrader’s native iHighest and iLowest functions to identify pivot highs and lows by scanning for the highest and lowest prices within a user-defined window of bars. A pivot is confirmed only when the current bar is the absolute maximum or minimum within the selected range, ensuring accurate and timely signals based on robust built-in logic. Key Features No Repainting : Onc
FREE
ToolBot Probabilistic Analysis
Josue De Matos Silva
4 (1)
ToolBot Probabilistic Analysis - FREE   An effective indicator for your negotiations The toolbot indicator brings the calculation of candles and a probabilistic analysis so that you have more security on your own. Also test our  FREE tops and bottoms indicator: :   https://www.mql5.com/pt/market/product/52385#description Also test our  FREE (RSI, ATR, ADX, OBV) indicator:   https://www.mql5.com/pt/market/product/53448#description Try our EA ToolBot for free:   https://www.mql5.com/market/prod
FREE
Modified Bollinger Bands
Gennadiy Stanilevych
The standard Bollinger Bands indicator has been improved by integrating additional indications from the Standard Deviation indicator (StdDev), which gives an additional filter for confirming trading signals. In addition, the color of the indicator's lines shows the beginning of a trend, its development and exhaustion. This indicator has a signal block that notifies the trader of the beginning of the trend on any time frame to which it is attached. Settings Type of messages - select the type of
FREE
Product Overview Enhanced MACD Pro is an advanced implementation of the classic MACD (Moving Average Convergence Divergence) indicator, enhanced with professional features for serious traders. This indicator combines traditional MACD analysis with modern alert systems and visual optimizations. Why Choose Enhanced MACD Pro? Multiple Alert Systems : 3 different alert modes to catch every trading opportunity Customizable Parameters : Full control over all MACD settings Professional Visualization
FREE
Simple divergence
Vadim Zotov
5 (2)
The indicator plots a curve of the difference between the values ​​of two trading instruments (currency pairs). The purpose of the indicator is to observe the processes of divergence and convergence of the values ​​of two trading instruments. The results obtained can be used for trading strategies of statistical arbitrage, pair trading, correlation, and others. Trading strategy The indicator is attached to the chart of any trading instrument. In the input parameters, the names of trading instr
FREE
SSACD - Singular Spectrum Average Convergence/Divergence This is an analogue of the MACD indicator based on the Caterpillar-SSA ( Singular Spectrum Analysis ) method. Limited version of the SSACD Forecast indicator. Limitations include the set of parameters and their range. Specificity of the method The Caterpillar-SSA is an effective method to handle non-stationary time series with unknown internal structure. The method allows to find the previously unknown periodicities of the series and make
FREE
MACD Enhanced
Nikita Berdnikov
5 (3)
Introducing the MACD  Enhanced – an advanced MACD (Moving Average Convergence Divergence) indicator that provides traders with extended capabilities for trend and momentum analysis in financial markets. The indicator uses the difference between the fast and slow exponential moving averages to determine momentum, direction, and strength of the trend, creating clear visual signals for potential entry and exit points. Attention! To achieve the best results, it is recommended to adapt the indicator
FREE
VisualVol EURUSD
Maxim Kuznetsov
The indicator highlights the points that a professional trader sees in ordinary indicators. VisualVol visually displays different volatility indicators on a single scale and a common align. Highlights the excess of volume indicators in color. At the same time, Tick and Real Volume, Actual range, ATR, candle size and return (open-close difference) can be displayed. Thanks to VisualVol, you will see the market periods and the right time for different trading operations. This version is intended f
FREE
MACD indicators
Xiao Dong Feng
MACD indicators https://mql5.com This MACD indicator looks slightly different from the MACD indicator found in many other charting software. When the value of the signal line parameter is greater than the value of the MACD parameter, the indicator will give a buy prompt, and when the signal line parameter is less than the value of the MACD parameter, the indicator will give a sell prompt.
FREE
Free automatic Fibonacci is an indicator that automatically plots a Fibonacci retracement based on the number of bars you select on the BarsToScan setting in the indicator. The Fibonacci is automatically updated in real time as new highest and lowest values appears amongst the selected bars. You can select which level values to be displayed in the indicator settings. You can also select the color of the levels thus enabling the trader to be able to attach the indicator several times with differe
FREE
MACD Colored ZeroLag
Farzin Sadeghi Bonjar
4.73 (11)
It is the MQL5 version of zero lag MACD that was available for MT4 here: https://www.mql5.com/en/code/9993 Also there was a colored version of it here but it had some problems: https://www.mql5.com/en/code/8703 I fixed the MT4 version which has 95 lines of code. It took me 5 days to write the MT5 version.(reading the logs and testing multiple times and finding out the difference of MT5 and MT4!) My first MQL5 version of this indicator had 400 lines of code but I optimized my own code again and n
FREE
Fibomathe
Almaquio Ferreira De Souza Junior
Fibomathe Indicator: Support and Resistance Tool for MT5 The Fibomathe Indicator is a technical analysis tool designed for MetaTrader 5 (MT5) that assists traders in identifying support and resistance levels, take-profit zones, and additional price projection areas. It is suitable for traders who use structured approaches to analyze price action and manage trades. Key Features Support and Resistance Levels: Allows users to define and adjust support and resistance levels directly on the chart.
FREE
MACD candles bars or lines
Alexey Viktorov
5 (1)
This is an ordinary MACD indicator displayed in the main window according to the selected chart style, i.e. Bars, Candlesticks or Line. When you switch the chart type, the indicator display also changes. Unfortunately I could not improve the chart type switching speed. After switching, there are delays before the arrival of a new tick. The indicator parameters Fast EMA period Slow EMA period Signal SMA period Applied price
FREE
Curver Arrows
Francis Dube
3.75 (4)
本指标是一款众所周知的 MetaTrader 4 指标,现直接免费在互联网上提供。它完全不会重绘。 它实现了一类突破策略。箭头指示行情的方向。在 M15 或更高时间帧里使用此指标。
FREE
RelicusRoad MACD v2 MT5
Relicus LLC
4.75 (20)
移动平均收敛发散(MACD)交易策略是一种流行的技术分析工具,用于识别动量和趋势方向的变化。MACD的计算方法是将26期指数移动平均线(EMA)减去12期EMA。然后在MACD上方绘制一个9期EMA,称为“信号线”,以充当买入和卖出信号的触发器。 当MACD线在信号线上方时,MACD被认为处于看涨区域,在下方时处于看跌区域。交易者经常使用这些信息来确定潜在的买入和卖出机会。 MACD是一种多功能指标,可以用多种方式使用,其中一些常见的用法包括: 交叉:当MACD线穿过信号线时,出现看涨交叉;当MACD线穿过信号线下方时,出现看跌交叉。 发散:当MACD正在创造新高时,而基础证券没有创造新高时,出现看涨发散;当MACD正在创造新低时,而基础证券没有创造新低时,出现看跌发散。 趋势跟踪:当MACD在零线上方时,出现看涨趋势;当MACD在零线下方时,出现看跌趋势。 需要注意的是,MACD是一种滞后指标,应与其他技术指标和分析结合使用才能做出交易决策。
FREE
Smart Super Trend
Kokou Sodjine Aziagbedo
Smart Super Trend Indicator (Free) Turn volatility into opportunity — Catch trends early and trade smarter The Supertrend Indicator is one of the most trusted tools in technical analysis, designed to help traders quickly identify the prevailing market trend and spot potential entry and exit points with precision. Built on price action and volatility, this trend-following indicator adapts dynamically to market conditions, making it a powerful companion for both beginners and experienced traders.
FREE
PZ Penta O MT5
PZ TRADING SLU
3.5 (4)
The Penta-O is a 6-point retracement harmonacci pattern which usually precedes big market movements. Penta-O patterns can expand and repaint quite a bit. To make things easier this indicator implements a twist: it waits for a donchian breakout in the right direction before signaling the trade. The end result is an otherwise repainting indicator with a very reliable trading signal. The donchian breakout period is entered as an input. [ Installation Guide | Update Guide | Troubleshooting | FAQ | A
FREE
PZ Super Trend MT5
PZ TRADING SLU
4.48 (44)
A top-quality implementation of the famous Super Trend indicator, which needs no introduction. It is completely loyal to the original algorithm, and implements many other useful features such as a multi-timeframe dashboard.  [ Installation Guide | Update Guide | Troubleshooting | FAQ | All Products ] Easy to trade It implements alerts of all kinds It implements a multi-timeframe dashboard It is non-repainting and non-backpainting Input Parameters ATR Period - This is the average true range peri
FREE
This indicator is an automated version of the Fibonacci retracement (Fib) indicator. Deciding the best areas to use when drawing the fib can be tricky and this  indicator was made with that in mind. When you drop it on the chart it will automatically choose the best points to draw the fib with, but in case you aren't satisfied with those regions, you can adjust it as you wish.
FREE
PFKBreakOut
Stanislav Korotky
This indicator displays breakouts on Point-And-Figure-like or Kagi-like custom symbol charts, generated by special expert advisers, such as PointFigureKagiCharts . This indicator is applicable only for custom instruments generated in appropriate way (with time-invariant bars which are multiples of a predefined box size). It makes no sense to apply it to other charts. The breakouts in up or down direction are marked by arrows. The breakout price is found at crossing of one of imaginary lines of
FREE
Three Moving Averages
MetaQuotes Ltd.
3.2 (25)
交易策略基于三条移动均线。判断趋势, 使用三条指数平滑移动均线: FastEMA, MediumEMA 和 SlowEMA。 交易信号: 买信号: FastEMA>MediumEMA>SlowEMA (向上趋势)。 卖信号: FastEMA<MediumEMA<SlowEMA (向下趋势)。 输入参数: Inp_Signal_ThreeEMA_FastPeriod = 8; Inp_Signal_ThreeEMA_MediumPeriod = 38; Inp_Signal_ThreeEMA_SlowPeriod = 48; Inp_Signal_ThreeEMA_StopLoss = 400; Inp_Signal_ThreeEMA_TakeProfit = 900; Inp_Money_FixLot_Percent  = 10.0; Inp_Money_FixLot_Lots  = 0.1;
FREE
ZigZag Support Resistance
Emmanuel Tshepang Mosweu
5 (3)
This indicator uses the Zigzag indicator to identify swing highs and swing lows in the price chart.  Once it has identified the swing highs and swing lows, it can use them to determine potential support and resistance levels. A support level is formed when the price drops and bounces back up from a swing low, indicating that there is buying pressure at that level. A resistance level is formed when the price rises and reverses downward from a swing high, suggesting selling pressure at that level.
FREE
Lion Arrow Super Arrow Indicator for MetaTrader 5 The Lion Arrow Super Arrow Indicator for MetaTrader 5 is a hybrid trading system that integrates multiple advanced technical analysis tools to generate high-quality trading signals. By combining trend, momentum, and pressure-based indicators, it aims to reduce false signals and improve entry accuracy. Core Components of the Indicator The Lion Arrow Super Arrow indicator is built on several key analytical elements: Fast Moving Average: Reacts qui
FREE
Automatic Trendlines
Pasi Hakamaki
4.69 (48)
该指标在图表上绘制趋势线。该指标有六个输入。用户可以为这两行指定替代标签。如果使用了指标的多个实例,则标签必须不同。用户可以设置线条的宽度和颜色以及深度,以指定应使用哪些显着的峰。例如,“深度= 10”使用当前的峰和谷设置趋势线,这些峰和谷在右侧和左侧至少有10条,并且高/低比峰值的高/低小/大。指标还绘制以前的高峰和低谷。指示器还具有警报功能,当价格与支撑线/阻力线相距预设距离时,可用于通知用户。警报距离以点为单位设置。.............................................................................................
FREE
MACD Pro – MACD Indicator for MetaTrader 5 Description MACD Pro is a Moving Average Convergence Divergence (MACD) indicator for MetaTrader 5. It follows the standard MACD calculation method and displays trend direction and momentum in a separate indicator window. Indicator Elements MACD line based on the difference between fast and slow exponential moving averages Signal line calculated as an exponential moving average of the MACD line Histogram showing the difference between the MACD and signa
FREE
Show Pips for MT5
Roman Podpora
4.52 (27)
对于那些总是想了解帐户当前情况的人来说,此信息指示器将很有用。 VERSION MT 4 -   More useful indicators 该指标显示诸如利润点数、百分比和货币等数据,以及当前货币对的点差以及柱在当前时间范围内收盘的时间。 有多种选项可用于将信息线放置在图表上: 价格右侧(运行在价格后面); 作为评论(在图表的左上角); 在屏幕的选定角落。 还可以选择信息分隔符: | / \ # 该指标易于使用且信息丰富。可以在设置中禁用不必要的信息项目。 设置 外观类型     - 信息行的显示类型。有以下三种选择: 跟随价格     - 遵循价格; 作为评论     - 作为评论; 在屏幕的选定角落     - 在屏幕的选定角落。 附件图角     - 如果您选择屏幕选定角的显示类型,则此项目允许您选择四个捕捉角之一; 显示利润?       - 该参数负责以存款货币显示利润; 以百分比显示利润?       - 该参数负责以百分比形式显示利润; 显示传播?       - 该参数负责显示当前点差; 显示酒吧关闭时间?       - 该参数负责显示柱关闭之前的时间; 文字颜
FREE
该产品的买家也购买
购买此指标即可免费获得我的专业交易管理器。 首先,值得强调的是,这个交易系统是一个非重绘、非重画和非滞后的指标,这使得它非常适合手动和机器人交易。 在线课程,手册和下载预设。 “智能趋势交易系统 MT5”是专为新手和经验丰富的交易者量身定制的综合交易解决方案。它结合了超过 10 个优质指标,具有 7 多个强大的交易策略,使其成为适用于各种市场条件的多功能选择。 趋势跟随策略:提供精确的入场和止损管理,以有效地跟随趋势。 反转策略:识别潜在的趋势反转,使交易者能够利用区域市场的机会。 剃头策略:专为快速准确的日内交易和短期交易而设计。 稳定性:所有指标都不会重绘、不会重画和不会滞后,确保可靠的信号。 定制:支持自定义策略,以满足个人交易偏好。超过 7 种策略和组合可帮助您找到最佳策略。 信号清晰度:提供箭头信号,以指示清晰的入场和退出点。 实时警报:通过交易进出警报使交易者保持了解。 深入分析:提供更高时间框架的趋势分析和实时交易监控。 自适应颜色编码:利用蜡烛颜色编码来显示成交量、趋势和反转蜡烛信号。通过蜡烛颜色分析市场方向。 “智能趋势交易系统 MT5”赋予交易者必要的工具,以便在
SuperScalp Pro
Van Minh Nguyen
5 (2)
SuperScalp Pro – 高级多重过滤剥头皮指标系统 SuperScalp Pro 是一款高级剥头皮指标系统,将经典 Supertrend 与多重智能确认过滤器相结合。该指标在 M1 到 H4 的所有时间框架上均运行良好,尤其适用于 XAUUSD、BTCUSD 及主要外汇货币对。可作为独立系统使用,也可灵活整合到现有交易策略中。 指标集成超过 11 个过滤器,包括快慢 EMA、用于趋势判断的三条 EMA、EMA 斜率 (EMA slope)、RSI、ADX、成交量、VWAP、布林带突破(Bollinger Bands Breakout)以及 MACD 背离过滤器。智能蜡烛过滤器用于确认蜡烛收盘并剔除弱信号,而以三条 EMA 结合 MACD 背离的趋势识别机制则有助于筛选出更高胜率的交易信号。 SuperScalp Pro 基于 ATR 自动计算进场(Entry)、止损(Stop Loss)和止盈(Take Profit)水平。所有重要价格水平均直接显示在图表上,方便用户管理风险并做出更精准的交易决策。 系统在超过 5,000 根蜡烛上进行模拟与性能分析,展示完整指标如胜率、总交
ARIPoint
Temirlan Kdyrkhan
ARIPoint is a powerful trading companion designed to generate high-probability entry signals with dynamic TP/SL/DP levels based on volatility. Built-in performance tracking shows win/loss stats, PP1/PP2 hits, and success rates all updated live. Key Features: Buy/Sell signals with adaptive volatility bands Real-time TP/SL/DP levels based on ATR Built-in MA Filter with optional ATR/StdDev volatility Performance stats panel (Success, Profit/Loss, PP1/PP2) Alerts via popup, sound, push, or email Cu
Entry In The Zone and SMC Multi Timeframe is a real-time market analysis tool developed based on Smart Money Concepts (SMC). It is designed to analyze market structure, price direction, reversal points, and key zones across multiple timeframes in a systematic way. The system displays Points of Interest (POI) and real-time No Repaint signals, with instant alerts when price reaches key zones or when signals occur within those zones. It functions as both an Indicator and a Signal System (2-in-1), c
Azimuth Pro
Ottaviano De Cicco
5 (3)
上市促销 Azimuth Pro 前100位买家特惠价 299 美元。最终价格为 499 美元。 散户与机构入场的区别不在于指标,而在于位置。 大多数交易者在任意价格水平入场,追逐动量或对滞后信号做出反应。机构投资者等待价格到达供需真正转换的结构性水平。 Azimuth Pro 自动映射这些水平:波段锚定VWAP、多时间框架结构线,以及仅在高概率位置出现的ABC形态。 Azimuth Pro 专为需要结构分析和智能自动化的专业交易者打造。 Azimuth 以外科手术般的精度映射市场结构,而Azimuth Pro增加了智能层:自动检测您的交易风格、智能配置的移动平均线,以及经过20年数据回测优化的参数。结果是专业级分析自动适应您的交易品种和时间框架。 这是我们Merkava Labs每天为自己和客户使用的指标。 PRO版本的独特之处 智能配置 Pro版本理解您的交易环境。将它放在EURUSD M15上,它知道您在做日内交易。放在BTCUSD H4上,它会调整为波段交易。无需手动调整。 自适应移动平均线 标准EMA有效。但ATR自适应StepMA(响应波动率)和动
Divergence Bomber
Ihor Otkydach
4.89 (81)
购买该指标的每位用户将额外免费获得以下内容: 原创工具“Bomber Utility”,该工具会自动跟踪每一笔交易,设置止损和止盈点,并根据策略规则自动平仓; 适用于不同交易品种的指标设置文件(Set 文件); 三种不同风险模式下的 Bomber Utility 设置文件:“最低风险”、“平衡风险” 和 “观望策略”; 一套详细的 视频操作手册,帮助您快速完成安装、配置并开始使用本交易系统。 注意: 要获取以上所有赠品,请通过 MQL5 的私人消息系统联系卖家。 我为您介绍原创的自定义指标 “Divergence Bomber”(背离轰炸机),它是一套基于 MACD 背离交易策略 的“全功能”交易系统。 该技术指标的主要任务是识别 价格与 MACD 指标之间的背离,并发出交易信号(包括推送通知),指示未来价格可能的运动方向。平均而言,这些信号的准确率超过 98%。有关该指标如何工作的详细说明,请观看本页面上的视频演示。 该系统使用 止损订单 和 动态回撤平仓机制 来管理交易。 Divergence Bomber 指标的主要特点: 支持交易的品种: AUDCAD、AUDCHF、AUDSG
Power Candles MT5
Daniel Stein
5 (6)
Power Candles – 适用于所有市场的基于强度的入场信号 Power Candles 将 Stein Investments 经过验证的强度分析直接带入价格图表。与仅对价格作出反应不同,每一根蜡烛都基于真实的市场强度进行着色,使交易者能够立即识别动能累积、强度加速以及清晰的趋势转换。 一套逻辑,适用于所有市场 Power Candles 可自动适用于 所有交易品种 。该指标会检测当前品种是否为外汇货币对或非外汇市场,并在内部自动应用相应的强度模型。 外汇与黄金 使用 FX Power Delta 数值(绝对范围最高至 100) 指数、加密货币和 CFD 使用 IX Power 强度数值(绝对范围最高至 50) 所需的强度计算已直接嵌入 Power Candles。本指标在蜡烛着色和信号逻辑方面无需额外安装任何其他指标。 以强度状态替代价格噪音 每根蜡烛都会被归类为九种清晰定义的强度状态之一: 中性 轻度、中度、强烈、极端空头 轻度、中度、强烈、极端多头 这种基于状态的方法能够过滤随机的价格波动,专注于有意义的市场参与行为。它帮助交易者识别新的方向性阶段正在形成,而不是对单根蜡
Game Changer Indicator mt5
Vasiliy Strukov
5 (15)
Game Changer 是一款革命性的趋势指标,适用于任何金融工具,可将您的 Metatrader 平台升级为强大的趋势分析工具。它适用于任何时间框架,能够帮助您识别趋势、发出潜在反转信号、作为追踪止损机制,并提供实时警报,以便您及时响应市场反应。无论您是经验丰富的专业人士,还是寻求优势的初学者,这款工具都能让您充满信心、纪律严明地进行交易,并清晰地理解潜在的趋势动态。该指标支持重绘功能。 购买后请立即联系我,即可获得专属赠品。您可以免费获得我们的“强支撑”和“趋势扫描器”指标,请私信联系我。 请注意,我不会在 Telegram 上出售我的 EA 或特殊设置,它们仅通过 Mql5 提供,我的设置文件也仅发布在我的博客上。谨防诈骗,切勿从其他任何人处购买任何设置。 设置 启用趋势变化提醒 - 真/假 - 趋势变化时在图表上显示提醒 发送推送通知 - 真/假 - 启用向手机推送提醒通知 发送邮件通知 - 真/假 - 趋势变化时向邮箱发送邮件通知
Atomic Analyst MT5
Issam Kassas
4.07 (28)
首先值得强调的是,该交易指标是非重绘、非延迟的指标,这使其成为手动和机器人交易的理想选择。 用户手册:设置、输入和策略。 Atomic Analyst是一种PA价格行动指标,利用价格的力量和动量来寻找市场上更好的机会。配备了高级过滤器,可帮助去除噪音和假信号,并提高交易潜力。使用多层复杂的指标,Atomic Analyst扫描图表,并将复杂的数学计算转化为任何初学者都能理解并用来做出一致交易决策的简单信号和颜色。 “Atomic Analyst”是专为新手和经验丰富的交易者量身定制的综合交易解决方案。它将高级指标和一流功能融合为一体的交易策略,使其成为所有类型交易者的多功能选择。 日内交易和剥头皮策略:专为快速准确的日内交易和短期交易而设计。 日内和摆动交易策略:可用作追求价格大幅波动的日内和摆动交易者的可靠工具。 多货币和市场:凭借其可靠的精度,在不同的工具和市场上运作。 多个时间框架:可在多个时间框架上使用,性能良好。 稳定性:所有指标均不重绘、不重绘和不滞后,确保可靠的信号。 信号清晰度:提供箭头信号,用于清晰的入场和出场点。 实时警报:通过交易入场、SL和TP警报通知交易者
FX Trend NG:新一代多市场趋势智能分析工具 概述 FX Trend NG 是一款专业的多时间周期趋势分析与市场监控工具,帮助您在几秒钟内全面了解市场结构。 无需在多个图表之间来回切换,您可以立即看到哪些品种处于趋势中、哪里动能正在减弱,以及哪些时间周期之间存在强烈共振。 限时发布优惠 – 仅需 $30(6个月) 或 $80 终身授权 即可拥有 FX Trend NG 。 已经是 Stein Investments 客户? -> 发送消息 以获取专属客户群访问权限。 需要帮助或安装指导? -> 请访问 Stein Investments 官方页面 。 1. FX Trend NG 的核心优势 三状态趋势逻辑 —— 不只是 Buy 或 Sell • 大多数指标仅显示两种状态:Buy 或 Sell。 • FX Trend NG 增加第三种状态: Fade 。 • Fade 表示趋势强度正在减弱,在完全反转之前提前发出信号。 这种结构化逻辑让您看到趋势变化过程,而不仅仅是简单方向信号。 多时间周期分析(M1 至 MN1) • 从短线交易到中长线交易全面覆盖。 • 快速识别趋势
每天,许多交易者都会遇到一个常见的挑战:价格似乎突破了关键水平,他们进场交易,然后市场反转,触发止损。这被称为假突破——价格短暂突破支撑或阻力水平后反转的走势。这些走势可能导致在实际价格方向明确之前就触发止损。 在技术分析中,这种现象通常被称为"流动性扫荡"(liquidity sweep)或"猎杀止损"(stop hunt)。 Mirage Trading System 是一款专为检测假突破形态而设计的指标。"Mirage"意为幻象——指的是市场中频繁出现的假突破形态。 虽然假突破可能让许多交易者措手不及,但 Mirage Trading System 旨在识别这些形态何时形成,并指示随后价格走势的潜在方向。 上市期间套餐 在上市期间,购买 Mirage Trading System 包含三款附加产品:Smart Trend Consensus MT5($39)、Price Volume Distribution MT5($69)和 EA Signal Template($100)。这些产品在此期间免费提供。购买后请联系我以获取它们。 附带指标和EA的安装指南   —   EA Si
FX Power MT5 NG
Daniel Stein
5 (31)
FX Power:分析货币强度,助您做出更明智的交易决策 概述 FX Power 是一款专业工具,帮助您全面了解主要货币和黄金在任何市场条件下的真实强度。通过识别强势货币用于买入,弱势货币用于卖出, FX Power 简化了交易决策,并帮助您发现高概率的交易机会。不论您是想跟随趋势还是通过极端的 Delta 值预测反转,这款工具都能完美适应您的交易风格。别再盲目交易——用 FX Power 让您的交易更加智慧。 1. 为什么 FX Power 对交易者极具价值 实时货币和黄金强度分析 • FX Power 实时计算并显示主要货币和黄金的相对强度,助您全面了解市场动态。 • 监控领先或落后资产,轻松识别值得交易的货币对。 全面的多时间框架视图 • 跟踪短期、中期和长期时间框架的货币和黄金强度,以便将您的交易策略与市场趋势保持一致。 • 无论是快进快出的短线交易还是更长期的投资策略, FX Power 都能为您提供所需的信息。 Delta 动态分析用于趋势和反转 • 极端 Delta 值常常预示反转机会,而平缓的 Delta 变化则确认趋势延续。 • 使用 Delta 分析,轻
Entry Points Pro for MT5
Yury Orlov
4.48 (138)
这款指标用于 MT5,可提供准确的入场交易信号,且无重绘。 它可应用在任何金融资产:外汇、加密货币、贵金属、股票、指数。 它将提供极其精准的评估,并告诉您何时开仓和平仓的最佳时机。 观看 视频 (6:22),其中包含一个仅处理单一信号的示例,该信号即可值回指标购价! 大多数交易者在 Entry Points Pro 指标的帮助下,在第一个交易周内即改善了他们的交易结果。 订阅我们的 Telegram 群 ! Entry Points Pro 指标的益处。 入场信号无重绘 如果信号出现,并得到确认,则它不会再消失;不像是重绘指标,它会导致重大的财产损失,因为它们可以在显示信号后再将其删除。 无差错开仓 指标算法可令您找到入场交易(买入或卖出资产)的理想时机,从而提高每位交易者的成功率。 Entry Points Pro 可操作任何资产 它允许您在 MT5 平台上交易任何经纪商的加密货币、股票、贵金属、指数、大宗商品和货币。 提供任何方向的信号 Entry Points Pro 指标提供针对任意价格走势的入场交易信号 - 上涨、下跌或横盘(横向)。 最大盈利潜力 离场信号
“ Dynamic Scalper System MT5 ”指标专为在趋势波内进行剥头皮交易而设计。 已在主要货币对和黄金上进行测试,并可与其他交易工具兼容。 提供顺势短线建仓信号,并提供额外的价格变动支持。 指标原理: 大箭头决定趋势方向。 在趋势波内,我们采用一种生成小箭头形式的剥头皮交易信号的算法。 红色箭头代表看涨方向,蓝色箭头代表看跌方向。 敏感的价格变动线会沿着趋势方向绘制,并与小箭头信号协同作用。 信号运作方式如下:当线在适当时刻出现时,将形成入场信号;在出现线时,持仓;线完成后,平仓。 建议的操作时间范围为M1 - H4。 箭头在当前K线上方形成,如果下一根K线已开仓,则不会重新绘制上一根K线上方的箭头。 输入参数 Trend Wave Period - 趋势方向(大箭头)的周期,改变趋势波的时间间隔。值 1 表示趋势方向的最长持续时间,参数值越大,持续时间越短。 Scalper Arrows Period - 信号箭头(小箭头)的计算周期,改变入场信号的生成频率。值 3 表示最频繁的生成频率,参数值越大,箭头频率越低,准确度越高。 这些参数可以根据不同
Grabber System MT5
Ihor Otkydach
4.82 (22)
向您介绍一款优秀的技术指标——Grabber,它是一套即开即用的“全包式”交易策略。 在一个代码中集成了强大的市场技术分析工具、交易信号(箭头)、提醒功能和推送通知。 每位购买该指标的用户还可免费获得以下内容: Grabber辅助工具:用于自动管理已开仓位 视频操作指南:逐步教学如何安装、设置和使用该指标进行交易 原创Set文件:可快速自动配置,帮助实现最佳交易效果 忘掉其他策略吧!只有Grabber能够真正激励你在交易中攀登新高峰! Grabber策略的主要特点: 交易周期:从M5到H4 适用资产:任意,但我推荐我亲自测试过的品种(GBPUSD、GBPCAD、GBPCHF、AUDCAD、AUDUSD、AUDSGD、AUDCHF、NZDUSD、NZDCAD、EURCAD、EURUSD、EURAUD、EURGBP、EURCHF、USDCAD、USDSGD) 交易时间:全天候 24/7 交易效果:我分享自己的真实交易结果,并在此教学如何操作: https://www.mql5.com/ru/market/product/134563?source=Site+Market+MT5+Indic
Trend Screener Pro MT5
STE S.S.COMPANY
4.84 (100)
使用趋势筛选指标释放趋势交易的力量:由模糊逻辑和多货币系统提供支持的终极趋势交易解决方案! 使用趋势筛选器(由模糊逻辑提供支持的革命性趋势指标)提升您的趋势交易。 它是一个强大的趋势跟踪指标,结合了超过 13 种高级工具和功能以及 3 种交易策略,使其成为使您的 Metatrader 成为趋势分析器的多功能选择。 限时优惠:趋势筛选指标终身仅需 50 美元。 ( 原价 250$ ) (优惠延长) 体验趋势筛选器 100% 无需重新绘制的准确性,确保您的交易决策不受过去价格变化的影响。 释放多时间框架和多货币功能的多功能性,使您能够以无与伦比的信心在外汇、商品、加密货币和指数领域进行交易。 利用 Trend Screener 的综合策略套件增强您的交易: - 趋势跟踪策略和趋势延续策略 :趋势筛选器的趋势跟踪策略提供清晰的趋势延续信号,让您有效捕捉趋势走势并管理风险。 - 反转策略和早期入场点策略 :趋势筛选器的反转策略可检测市场方向的潜在变化,使您能够预测趋势反转并利用疲弱的市场趋势。通过早期入场点,您可以在潜在的趋势变化之前定位自己 获取可观的利润。 - 倒卖策略: 趋势筛选器的倒卖
Transaction Speed MT5
Ivan Stefanov
5 (2)
当然,以下是翻译成中文(简体)的版本: 该指标标出市场中显现出 交易兴趣 的区域,并随后显示 订单积累区域 。它的工作方式类似于大规模的订单簿。 这是为 大资金 打造的指标,性能卓越。市场中有任何兴趣,你都能通过它清晰看到。 (这是一个 完全重写的自动化版本 —— 不再需要手动分析。) 交易速度 是一个全新的概念指标,它显示了市场上大订单 何时 、 何地 聚集,并揭示了其背后的意义。它可以在 非常早期 就检测到趋势的变化。 在外汇市场,所谓的“交易量”实际上是误导性的,因为那指的是价格在单位时间内的变化,因此真正的名称应是“交易速度”。 一切都取决于我们如何思考、如何行动、如何分析。 改变分析范式至关重要。 该指标完全重构了外汇市场上“交易量”的概念,用逻辑方式重新定义并应用,从而成为一个 独特而精准的工具 。 使用方法: 默认情况下,指标处于 自动模式 ,可独立用于任何时间周期。如果你希望切换到手动模式,只需点击 Auto / Manual Mode 按钮即可。 在 手动模式 下,所有计算从 2025年1月1日 开始。你可以根据需要更改该日期,以查看不同的分析结果。 最优数据周期
Smart Stop Indicator – 智能化止损逻辑,直接呈现在您的图表上 概述 Smart Stop Indicator 是为希望以清晰、系统、非情绪化方式设置止损的交易者量身打造的工具。它将经典的价格结构逻辑(更高的高点、更低的低点)与现代突破识别技术相结合,精准标记真正合理的止损位置。无论是趋势、盘整还是快速突破行情,指标都会在图表上直接显示最佳 SL 区域及其状态(“new”、“broken”、“valid”)并且现在新增 SL 与 %ADR 的距离显示。 亮点 基于市场结构的自动止损识别 • 根据市场结构与实时价格行为自动识别关键止损位置。 智能突破适应能力 • 能适应突破与快速方向变化,不会强迫过早调整止损。 SL %ADR 显示 • 显示止损距离占平均日波动范围 ADR 的百分比与 Smart Stop Scanner 完全一致帮助交易者即时识别紧密机会或已延伸的行情。 内置警报逻辑 • 当止损水平变为“new”、“valid”或“broken”时触发警报包含准确的状态切换与冷却逻辑。 破损级别的淡化显示 • 对于“broken”状态的方向、价格、S
Gold Entry Sniper
Tahir Mehmood
5 (3)
Gold Entry Sniper – 专业多周期ATR黄金交易仪表盘,适合黄金剥头皮与波段交易 Gold Entry Sniper 是一款先进的 MetaTrader 5 指标,旨在为 XAUUSD 及其他品种提供精准的 买/卖信号 。基于 ATR 移动止损逻辑 和 多周期分析仪表盘 ,适合剥头皮交易者与波段交易者,帮助识别 高概率黄金入场点 。 主要功能与优势 多周期信号分析 – 同时显示 M1、M5、M15 趋势方向。 基于ATR的动态止损 – 根据波动性自动调整。 专业图表仪表盘 – 展示信号状态、ATR水平、线性回归中线和交易方向。 清晰买卖标记 – 自动箭头与文字标签提示。 离场提示与交易管理 – 自动检测离场信号锁定利润。 全面自定义 – 调整仪表盘位置、颜色、字体及参数。 专为黄金优化 – 适用于 M1至M15 黄金剥头皮 ,也适合外汇、指数与加密货币。 为什么选择 Gold Entry Sniper? 为追求 快速、精准、可视化交易决策 的交易者打造,ATR 与多周期确认结合,帮助你抓住 最佳黄金入场点
RelicusRoad Pro MT5
Relicus LLC
5 (24)
RelicusRoad Pro: 量化市场操作系统 终身访问限时 70% 折扣 - 加入 2,000+ 交易员社区 为什么大多数交易者即使拥有“完美”指标也会失败? 因为他们在真空中交易 单一概念 。没有背景的信号是赌博。要持续获胜,您需要 共振 (CONFLUENCE) 。 RelicusRoad Pro 不是一个简单的箭头指标。它是一个完整的 量化市场生态系统 。它描绘价格运行的“公允价值之路”,区分市场噪音和真实的结构性突破。 停止猜测。开始用机构级“路”逻辑进行交易。 核心引擎:“Road” (路) 算法 系统的核心是 Road Algo ,一个实时适应市场条件的动态波动率通道。它投射出 安全线 (平衡) 和价格可能反转的 扩展水平 。 Simple Road: 典型市场的标准结构映射。 Smooth Road: 针对震荡盘整的降噪计算。 Breakout Road: 专为识别波动率扩张和爆发性走势而调整。 1. 算法动量与确认 我们的“剥头皮箭头”不只是简单的交叉。它们利用 高阶多项式逻辑 过滤噪音,确保信号与主周期一致。我们检测动量、价格行为和 Road 结构汇聚的精确入场
Quantum TrendPulse
Bogdan Ion Puscasu
5 (20)
介绍 Quantum TrendPulse   ,这是一款终极交易工具,它将 SuperTrend   、   RSI 和 Stochastic 的强大功能整合到一个综合指标中,以最大限度地发挥您的交易潜力。该指标专为追求精准和效率的交易者而设计,可帮助您自信地识别市场趋势、动量变化以及最佳进入和退出点。 主要特点: 超级趋势整合: 轻松跟随当前的市场趋势并乘上盈利浪潮。 RSI 精度: 检测超买和超卖水平,非常适合把握市场逆转时机,可用作 SuperTrend 的过滤器 随机精度: 利用随机振荡在波动的市场中寻找隐藏的机会, 用作超级趋势的过滤器 多时间范围分析: 从 M5 到 H1 或 H4,在不同时间范围内关注市场动态。 可定制的警报: 当您的自定义交易条件得到满足时收到通知,这样您就不会错过任何交易。 无论您是新手还是经验丰富的交易员,   Quantum TrendPulse 都能为您提供所需的优势,帮助您增强策略并自信地进行交易。借助这一强大的指标,将洞察力转化为利润 — 掌控您的交易! ***购买 Quantum TrendPulse,即可免费获得 Quantum Tr
Super Signal – Skyblade Edition 專業級無重繪 / 無延遲趨勢信號系統,擁有卓越勝率 | 適用於 MT4 / MT5 在較低的時間週期上效果最佳,例如 1 分鐘、5 分鐘與 15 分鐘圖表 核心特色: Super Signal – Skyblade Edition 是一套專為趨勢交易設計的智能信號系統。 其採用多重濾波邏輯,僅篩選出具有明確方向性、動能強勁且波動結構健康的走勢進場點。 本系統 不預測高點或低點 ,只有在同時滿足以下三項條件時才會觸發交易信號: 趨勢方向明確 動能持續增強 波動率結構穩定 此外,系統還結合市場流動性分析,以進一步提升信號的準確性與觸發時機。 信號特性: 所有箭頭信號皆為 100% 無重繪,無延遲 信號一旦出現即固定於圖表,不會閃爍或消失 提供圖表箭頭、資訊面板、彈出通知、聲音提示及推播訊息 支援 EA 呼叫(Buffer 輸出),可整合至自動化交易或信號跟單系統 提供預設參數模板,免調整即可使用,適合新手快速上手 所有數據皆採用「嚴格回測標準」——每筆交易訊號在觸發後的 60 根 K 線內, EURUSD 與 USDJPY
Bill Williams Advanced
Siarhei Vashchylka
5 (10)
Bill Williams Advanced is designed for automatic chart analysis using Bill Williams' "Profitunity" system. The indicator analyzes four timeframes at once. Manual (Be sure to read before purchasing) Advantages 1. Analyzes the chart using Bill Williams' "Profitunity" system. Signals are displayed in a table in the corner of the screen and on the price chart. 2. Finds all known AO and AC signals, as well as zone signals. Equipped with a trend filter based on the Alligator. 3. Finds "Divergence Bar
TPSproTREND PrO MT5
Roman Podpora
4.74 (19)
TPSproTrend PRO 能够识别市场真正改变方向的时刻,并在行情开始时形成入场点。 你应该在价格刚刚开始波动时入场,而不是在波动已经发生之后。 指标   它不会重新绘制信号,并自动显示入场点、止损点和止盈点,使交易清晰、直观、有条理。 俄语说明 -   MT4 版本 主要优势 信号不重绘。 所有信号均为固定值。 如果出现箭头 -     它不会再改变也不会消失了。 您可以基于稳定的数据做出交易决策,而无需承担虚假信号的风险。 现成的买卖入场点 该指标会自动确定最佳交易时机,并在图表上用箭头显示出来。 无需猜测或主观分析——只有清晰的信号。 自动止损和止盈区域 信号发出后,您立即会看到: 入口点 风险限制区(止损) 止盈区 这允许   在达成交易前评估交易条款   并遵守风险管理规定。 自适应止损(移动止损) 该指标采用智能交易支持逻辑,随着时间的推移……     降低止损规模,从而降低初始风险。 支持更高时间框架(MTF) TPSproTrend PRO 显示: 来自更高时间框架的关键 MIN/MAX 修正 实际趋势变化 修正编号显示了运动的结构 交易很有帮助   顺应大
支撑和阻力筛选器是 MetaTrader 的一个级别指标,它在一个指标内提供多种工具。 可用的工具有: 1. 市场结构筛选器。 2. 看涨回调区。 3. 看跌回调区。 4.每日枢轴点 5.每周枢轴点 6. 每月枢轴点 7. 基于谐波形态和成交量的强大支撑和阻力。 8. 银行级区域。 限时优惠:HV 支撑和阻力指示器仅售 50 美元且终生可用。 (原价 125$) 通过访问我们的 MQL5 博客,您可以找到我们所有带有分析示例的高级指标: 单击此处 主要特点 基于谐波和音量算法的强大支撑和阻力区域。 基于谐波和成交量算法的看涨和看跌回调区域。 市场结构筛选器 每日、每周和每月的枢轴点。 文档 所有支持和阻力筛选器文档(说明)和策略详细信息均可在我们 MQL5 博客的这篇文章中找到: 单击此处。 接触 如果您有任何问题或需要帮助,请通过私信联系我。 作者 SAYADI ACHREF,金融科技软件工程师,Finansya 创始人。
IX Power MT5
Daniel Stein
4.92 (12)
IX Power:解锁指数、大宗商品、加密货币和外汇市场洞察 概述 IX Power 是一款多功能工具,可分析指数、大宗商品、加密货币和外汇市场的强弱表现。 FX Power 提供针对货币对的最高精度,利用所有可用货币对数据进行分析,而 IX Power 专注于基础资产的市场数据。这使得 IX Power 成为非外汇市场的理想选择,同时在需要简单外汇分析时也非常可靠。它可以无缝适用于任何图表,提供清晰的、有行动价值的洞察,帮助提升您的交易决策。 1. 为什么 IX Power 对交易者非常有价值 多市场强弱分析 • IX Power 分析指数、大宗商品、加密货币和外汇市场的强弱表现,为每个市场提供量身定制的洞察。 • 监控 US30、WTI、黄金、比特币等资产的表现,发现交易机会。 适用于更广泛的市场 • 对于外汇交易, FX Power 提供无与伦比的精度,通过分析所有相关货币对。 • IX Power 专注于基础资产的市场数据,非常适合非外汇市场及简化的外汇分析。 实时适应性 • 借助自适应算法, IX Power 实时响应市场数据变化,保持分析的最新性。 • 实时更新
FX Levels MT5
Daniel Stein
5 (13)
FX Levels:适用于所有市场的高精度支撑与阻力 快速概览 想要精准确定适用于任何市场(外汇、指数、股票或大宗商品)的支撑与阻力吗? FX Levels 将传统的“Lighthouse”方法与前沿的动态分析相结合,实现近乎通用的准确性。依托真实经纪商经验和自动化的每日与实时更新, FX Levels 帮助您捕捉价格反转点、设置合理的盈利目标,并自信地管理交易。立即使用,体验更准确的支撑/阻力分析如何助力您的交易更上层楼! 1. 为什么 FX Levels 对交易者非常有利 极度精准的支撑 & 阻力区 • FX Levels 专为不同经纪商提供的行情源和时间设置而设计,可生成几乎相同的价位区,解决数据不一致的常见问题。 • 这意味着无论您在哪里交易,都能获得稳定一致的水平线,为策略打下更加牢固的基础。 结合传统与先进技术 • 通过将久经考验的“Lighthouse”方法与动态分析相融合, FX Levels 不仅限于每日刷新,还可针对新的价格波动进行即时更新。 • 您可以选择经典的静态方式,或实时捕捉新出现的水平,以贴近最新的市场行为。 识别清晰的反转点 • FX Lev
趋势线专业版 -     有助于了解市场真正转变的方向。该指标显示了真正的趋势反转点以及主要参与者重新入场的点位。 你看     BOS线路   无需复杂设置或不必要的干扰,即可在高时间框架内显示趋势变化和关键水平。信号不会重绘,并在K线收盘后仍保留在图表上。 MT4 版本 该指标显示的内容: 真正的转变   趋势线(BOS线) 一旦信号出现,它就始终有效!这与会重绘的指标有着重要的区别,后者可能会发出信号后又改变信号,从而导致资金损失。现在,您可以更精准、更准确地进入市场。此外,还有一个功能:在箭头出现后,K线会着色,直到达到目标价位(止盈)或出现反转信号为止。 重复条目   以及主要玩家的充值 为了提高寻找入场点时的视觉清晰度,我们创建了一个模块,该模块首先显示买入/卖出区域,并在该区域内寻找最佳入场点。此外,我们还加入了智能逻辑来管理止损位,该逻辑会随着时间的推移逐步降低止损位的大小,从而降低入场时的初始风险( 移动止损位 )。 信号强度水平     (BOS) 该指标采用三个显著性等级来衡量趋势变化: SL     标准趋势变化 ChoCH SL—— 信号放大,结构破坏,且
Basic Harmonic Patterns Dashboard MT5
Mehran Sepah Mansoor
4.36 (11)
该仪表盘显示所选符号的最新可用谐波形态,因此您可以节省时间并提高效率 /  MT4 版本 。 免费指标:  Basic Harmonic Pattern 指标列 Symbol:   显示所选符号 Trend:     看涨或看跌 Pattern:    形态类型(Gartley、蝴蝶、蝙蝠、螃蟹、鲨鱼、Cypher 或 ABCD) Entry:     入口价格 SL: 止损价 TP1: 第一止盈价 TP2: 第二次获利价格 TP3: 第三次获利价格 Current price:    当前价格 Age (in bars):   最后绘制的模式的年龄 主要输入 Symbols :   从 "28 种主要货币对 "或 "选定符号 "中选择。 Selected Symbols :   希望监控的符号,用逗号分隔("EURUSD,GBPUSD,XAUUSD")。如果您的经纪商为货币对设置了后缀或前缀,您必须在以下两个参数中添加(货币对前缀或货币对后缀)。 Max Iteration:   调整模式的最大迭代次数(如果该值越小,则模式越少,性能越快;如果该值越大,则模式越多,性能越慢)
Weis Wave with Alert MT5
Trade The Volume Waves Single Member P.C.
4.94 (17)
Rental/Lifetime Package Options and Privileges  Rent Monthly Six Months   Yearly/Lifetime Weis Wave with Speed with Alert+Speed Index x x x Manual  x x x Quick Set up Video x x x Blog x x x Lifetime Updates x x x Setup and Training Material x x Discord Access Channel "The SI traders"          x Rectangle Break Alert Tool      x How to trade with it:    http://www.tradethevolumewaves.com   ** If you purchase please contact me to setup your  : Training Room and  complete manual access.  Wei
作者的更多信息
Recognizer 1 2 3 Patterns
Gennadiy Stanilevych
4.67 (36)
本指标用于在图表上识别和标记 1-2-3 多头和空头形态。本指标可辅助确定交易的开始和分形信号,以及 МetaTrader 5 所有时间帧内的可能入场点。在图表上绘制的菲波纳奇线用来指示在波浪理论基础上价格移动的可能目标。 在价格顶部或底部形成 1-2-3 形态尤其重要,它的出现可作为离散 (聚合)。 本指标可以调整射线和菲波纳奇线的颜色。 本指标对于任何交易系统或模板都是一个极好的补充。
FREE
Spread and Swap monitor
Gennadiy Stanilevych
5 (1)
本指标的目的是判断点差和利率大小,以及按照存款货币每一个点的风险,设置从当前价位计算的止损距离。 本指标告知交易者有关金融工具在每个时段之间转换时可能的额外费用和利润。它还告知有关的点差和挂单的距离,从当前价位的尾随止损位。此外,指标告知交易者有关存款货币每一个点的风险。 信息被显示在图表下方的单独子窗口里。它可以避免图表被不同的信息塞满。点差和利率监控指标适合任何自定义模板。
Trading Chaos Chart
Gennadiy Stanilevych
5 (1)
本指标的主要目的是根据 "混沌交易, 第二版" 策略,在图表里检测并标记交易信号。 带有角度的多头和空头背离柱线 (包括下蹲)。 柱线位于红色或绿色区域,是根据动量振荡器的直方条颜色。 图表上的下蹲柱线颜色独立于动量振荡器直方条。 "important" 级别的分形与鳄鱼指标的 "Teeth line" 相关。 绘制角度射线,是从平衡线至反转柱线。 第二智者和蓝光信号。 动量振荡器指标的 "区域里随后的第五根柱线" 信号。 本指标包括 新交易维度图表 指标的基本功能, 即以下: 检测并指示当直方条线穿越零轴时在图表上生成信号,以及相同方向上形成的蓝光特殊信号。 彩色柱线有三个区域 (红, 绿, 灰), 检测下蹲柱线。 为了切换 新交易维度图表 的功能, 将输入参数 Use new trading dimensions colors 设为 TRUE 值。 本指标根据 B. Williams 描述的策略专为 MetaTrader 5 开发。 图例: 蓝色柱线 - 下蹲柱线。 柱线之上的红星或绿星 - 柱线含有 "反向" 背离信号 (BDB)。 红色菱形或绿色菱形 - "第二智者" 信号。
Fractal breakout level
Gennadiy Stanilevych
Purpose and functions of the indicator The indicator determines and marks the moments of trend change on the chart based on the theory of fractal levels breakout on any of the analyzed timeframes. If a breakout based on all rules is valid, a horizontal line with corresponding color will appear on the chart. If there is an uptrend, the line will be blue. In the descending trend, the line will be red. The blue line is a strong support level, the trader should look for buying opportunities above th
FREE
Trading Chaos Expert
Gennadiy Stanilevych
5 (11)
世界上没有本软件的同等产品,它代表一个覆盖交易信号的通用交易 "控制台",自动入场,设置止损和止盈,还有在单一窗口里同时进行多交易尾随终止。EA 的 "三次点击" 直观控制,确保在不同计算机上全方位使用所有功能,包括平板电脑。 与附加的信号指标交互来标记图标,给出实际市场的全貌,EA 令您做出正确的选择,以及在大多数情况下成为胜者一方。内置资金管理算法, 还有自动计算手数, 虚拟订单交易, 以及一些其它从崩溃账户里挽救交易者的 "诀窍"。它不是一个 "黑盒子"。而是一个深思熟虑的交易员的不可或缺的助理, 至少要尝试一次它的动作。 注,在面板上形成的 EA 不能在策略测试员中测试。可以在您的模拟账户里以实时模式检查它, 您可以下载本 EA 的免费版 - 混沌交易 EA 演示 。 EA 表现为一个面板,带有内置功能的交易机器人的,自动基于交易者可直观检查的交易信号入场,完全按照比尔·威廉姆斯的策略“混沌交易:第二版”和“新贸易维度”。在单独的窗口里,EA 识别价格走势的导向,用于指定品种和时间帧的全自动交易模式,也可以多品种并发。 它同时分析 MetaTrader 5“市场观察”窗口中显示
Fifth dimension
Gennadiy Stanilevych
5 (2)
The indicator looks for the "Fifth dimension" trade signals and marks them on the chart. A detailed description of the chart patterns that generate the trade signals can be found in Chapter 8 "The Balance Line Trades" in the book Williams' "New Trading Dimensions". Signal levels with indication of the position entry or stop loss placement price are indicated directly on the chart. This feature creates additional convenience for the trader when placing pending orders. A solid horizontal line is d
FREE
Stairway
Gennadiy Stanilevych
4.75 (4)
The multi-timeframe indicator of the levels of the Pivot Points. Every closed daily period has its own so-called reference point - Pivot Point, which sets the levels for smaller intraday timeframes for the following day. The Pivot Points indicators existing in the codes have no method of showing the dynamics of the pivot point changes on the historical data of the price chart. Pivot Point calculation formula. Pivot=(High + Low + Close) /3 High — the maximum of the previous day; Low — the minimum
FREE
Modified Bollinger Bands
Gennadiy Stanilevych
The standard Bollinger Bands indicator has been improved by integrating additional indications from the Standard Deviation indicator (StdDev), which gives an additional filter for confirming trading signals. In addition, the color of the indicator's lines shows the beginning of a trend, its development and exhaustion. This indicator has a signal block that notifies the trader of the beginning of the trend on any time frame to which it is attached. Settings Type of messages - select the type of
FREE
Slider
Gennadiy Stanilevych
This is a utility created to ease charts watching on tablet PCs. The indicator allows you automatically alternately display "slide show" of all currency charts from "MarketWatch". The user can set the display time interval (in seconds) between charts in indicator settings. In addition, there is an option of selecting the angle of Start/Stop button which starts and stops the display of charts. This function is very useful if a trader noticed a trading signal and would like to study it in more det
FREE
Iranger
Gennadiy Stanilevych
Description The indicator based on Average True Range (ATR) is designed to accurately determine the possible range of price fluctuations on a selected timeframe. This tool is ideal for both beginner traders and experienced professionals looking to effectively plan their trades. Key Features: Displays possible price fluctuation levels on the chart, simplifying visual analysis. Utilizes the power of the ATR algorithm to calculate precise volatility values. Adapts to any timeframe, providing releva
FREE
Slider profy
Gennadiy Stanilevych
The idea of ​​enhancing the free Slider utility appeared after the release of a lite version of the EA trade panel Trading Chaos Expert Lite , which operates in the Current Chart mode without the possibility to maintain trades of several symbols in a single window. The purpose of Slider profy Ease search for trading signals by automatic display of charts of currency pairs from the "Market Watch" one by one at a specified interval of time in seconds. Automation of one-click placing of pending ord
FREE
Lifebuoy
Gennadiy Stanilevych
The script analyzes all trading instruments listed in the Market Watch of the MT5 platform to assess their suitability for trading on the timeframes specified in the settings. Based on the analysis, the script displays a table, where trading instruments deemed suitable and recommended for trading are marked in green, based on their compliance with the risk-to-reward ratio coefficient, including the spread (default 1:3). Instruments not recommended for trading are marked in red.
FREE
Modified Awesome Oscillator
Gennadiy Stanilevych
5 (2)
本指标的主要目的是根据 "混沌交易, 第二版" 和 "新交易维度" 策略,在动量振荡器的直方图里检测并标记交易信号。 本指标检测并标记以下交易信号: "双峰" - 背离。 信号 "第二智者" - 动量振荡器连续三根柱线之后颜色改变。 直方条与零轴交叉。 信号 "飞碟"。 指标包括一个信号块,用来方便地通知交易者任何新信号的形成。 本指标是基于 "混沌交易" 策略的复杂交易系统的一部分。本指标是形态的一部分。建议指标与以下产品配合使用: 混沌交易法 EA 混沌交易图表 新交易维度图表 改编的加速振荡器 识别 1 2 3 形态 波浪制造者 点差和利息监控 虚拟挂单突破做空 (EA 的简化版本) 虚拟挂单突破做多 (EA 的简化版本)
Auto Format
Gennadiy Stanilevych
这是一款实用程序,用于图表的自动缩放,可使至少 140 根柱线可见。根据 Bill Williams 的 "混沌交易法" 策略,这是正确分析波浪所必需的。此实用程序可用于 МetaТrader 5 上的所有时间帧。 它在计算开始的第一根柱线位置绘制一条垂线。这条线可以让您看到在图表上充足的柱线,以及波浪序列的可能起始点。它也使得在选定时间帧内显示金融工具的历史价格波浪的标签更加容易。 指标可以自动选择能够容纳 140-150 根柱线所需要的较低时间帧。为此,在图表上使用矩形选择图上所需要的区域,然后鼠标双击矩形边框。该指标会自动选择波浪分析所需的适合时间帧。要返回到初始时间帧,点击 MetaTrader 5 界面上的相应按钮,并使用 "删除" 来删除对象。 建议保存指标至模板,以及 MetaTrader 5 中包含的其它标准 Bill Williams 指标,或在 MQL5 市场里提供的它们的模拟品。亦即以下产品: 混沌交易图表 改编的动量指标 改编的加速振荡器 混沌交易法 EA
Short term extremum
Gennadiy Stanilevych
5 (1)
The indicator determines and marks the short-term lows and highs of the market on the chart according to Larry Williams` book "Long-term secrets to short-term trading". "Any time there is a daily low with higher lows on both sides of it, that low will be a short-term low. We know this because a study of market action will show that prices descended in the low day, then failed to make a new low, and thus turned up, marking that ultimate low as a short-term point. A short-term market high is just
Alligator modified
Gennadiy Stanilevych
5 (4)
The MT5 platform indicator has standard settings and requires no modifications when connected to the chart. Modifying the indicator involves adding two functions: Marking the area when the indicator lines are in the correct sequence (green line above or below red and blue lines, and red above or below blue). This creates a confirmed cross marked by the closing price to avoid false signals during the Alligator lines' entanglement periods. Drawing horizontal rays from market structure break levels
Stop close only
Gennadiy Stanilevych
The script in the form of an expert is created for the possibility of automatic installation of pending orders of the Stop Close Only type, which are not in MT5 by default. This type of order implies entering a long position in case the price closes above a given price level and opening a short position if the price closes below the price set by the trader. At the same time, level breakouts are not taken into account. The expert indicates the levels on the chart with lines, overcoming which will
筛选:
PROFITFACTOR1
106
PROFITFACTOR1 2021.06.29 21:52 
 

В комплекте с панелью нужный индикатор

回复评论