Beast Super Signal MT5
- 指标
- 版本: 5.0
- 更新: 28 二月 2025
- 激活: 10

正在寻找可以帮助您轻松识别有利可图的交易机会的强大外汇交易指标? Beast Super Signal 就是您的不二之选。
这个易于使用的基于趋势的指标持续监控市场状况,寻找新的发展趋势或跳入现有趋势。当所有内部策略一致且彼此 100% 融合时,Beast Super Signal 会发出买入或卖出信号,无需额外确认。当您收到信号箭头警报时,只需买入或卖出。
购买后给我留言,让我加入我的私人 VIP 群组! (仅限购买完整产品)。
购买后给我发消息以获取最新的优化设置文件。
在此处获取 Beast Super Signal EA。
查看评论部分以查看最新结果!
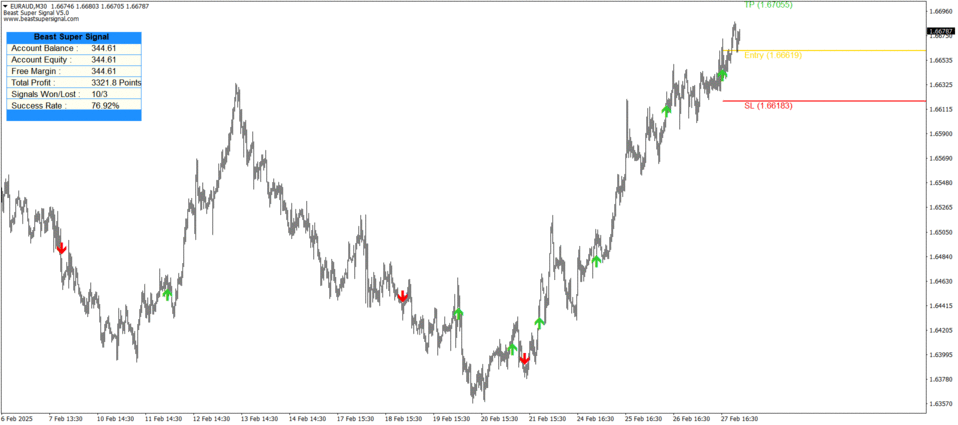
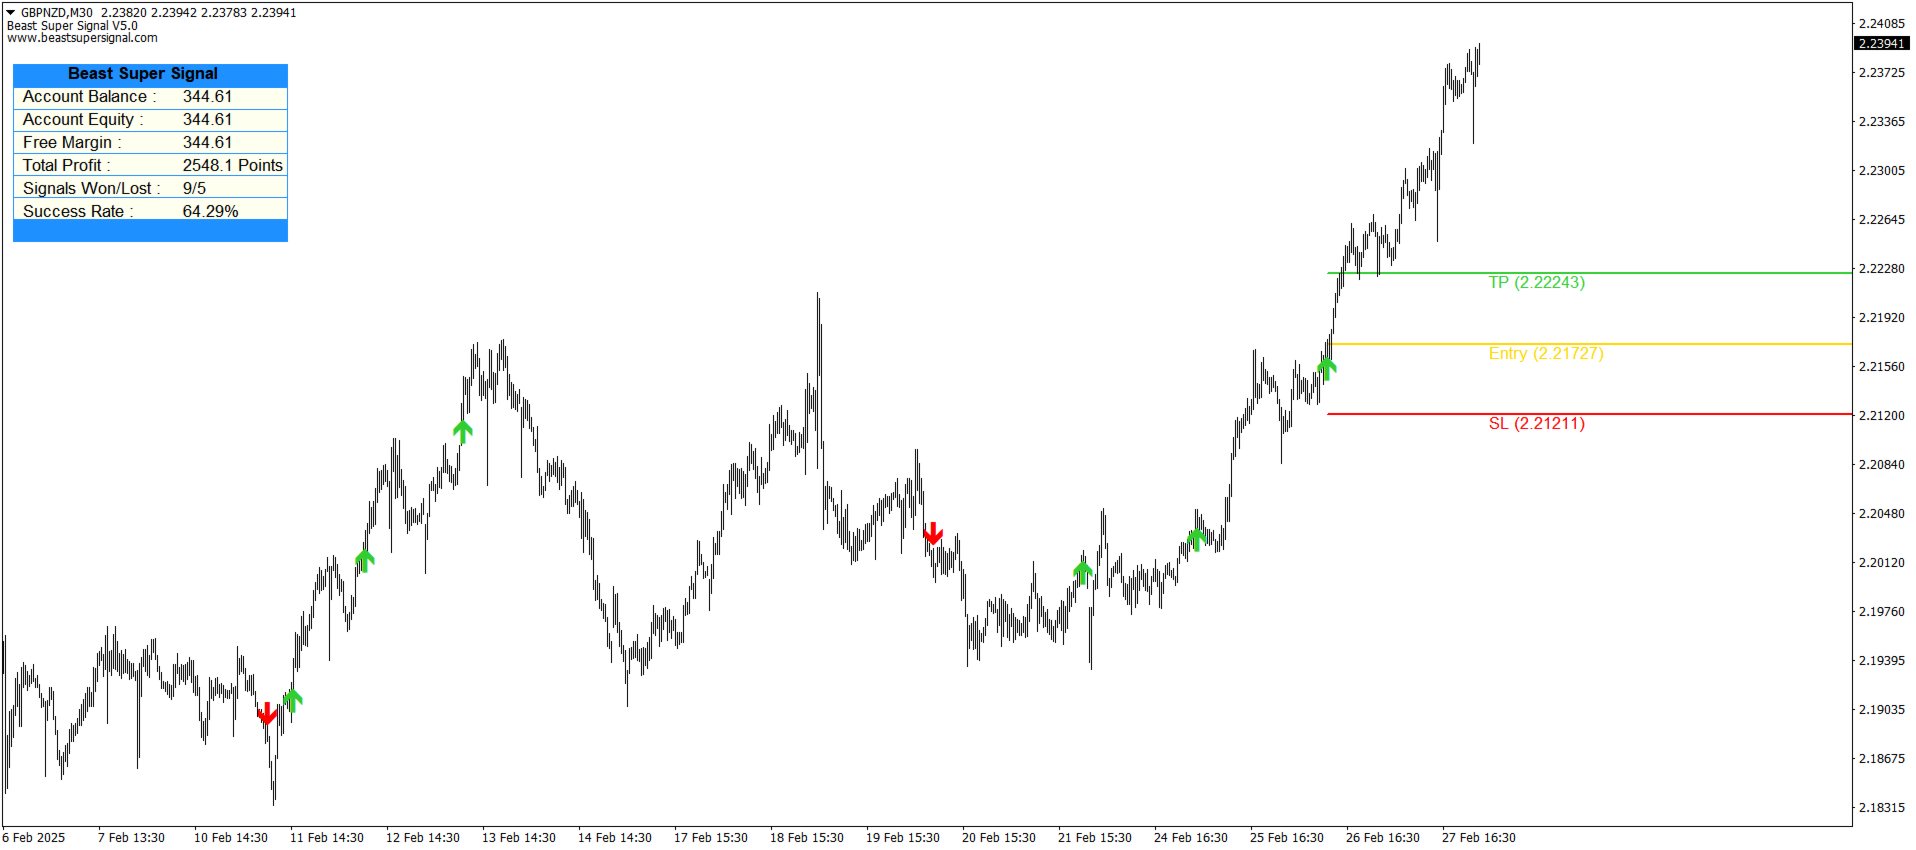
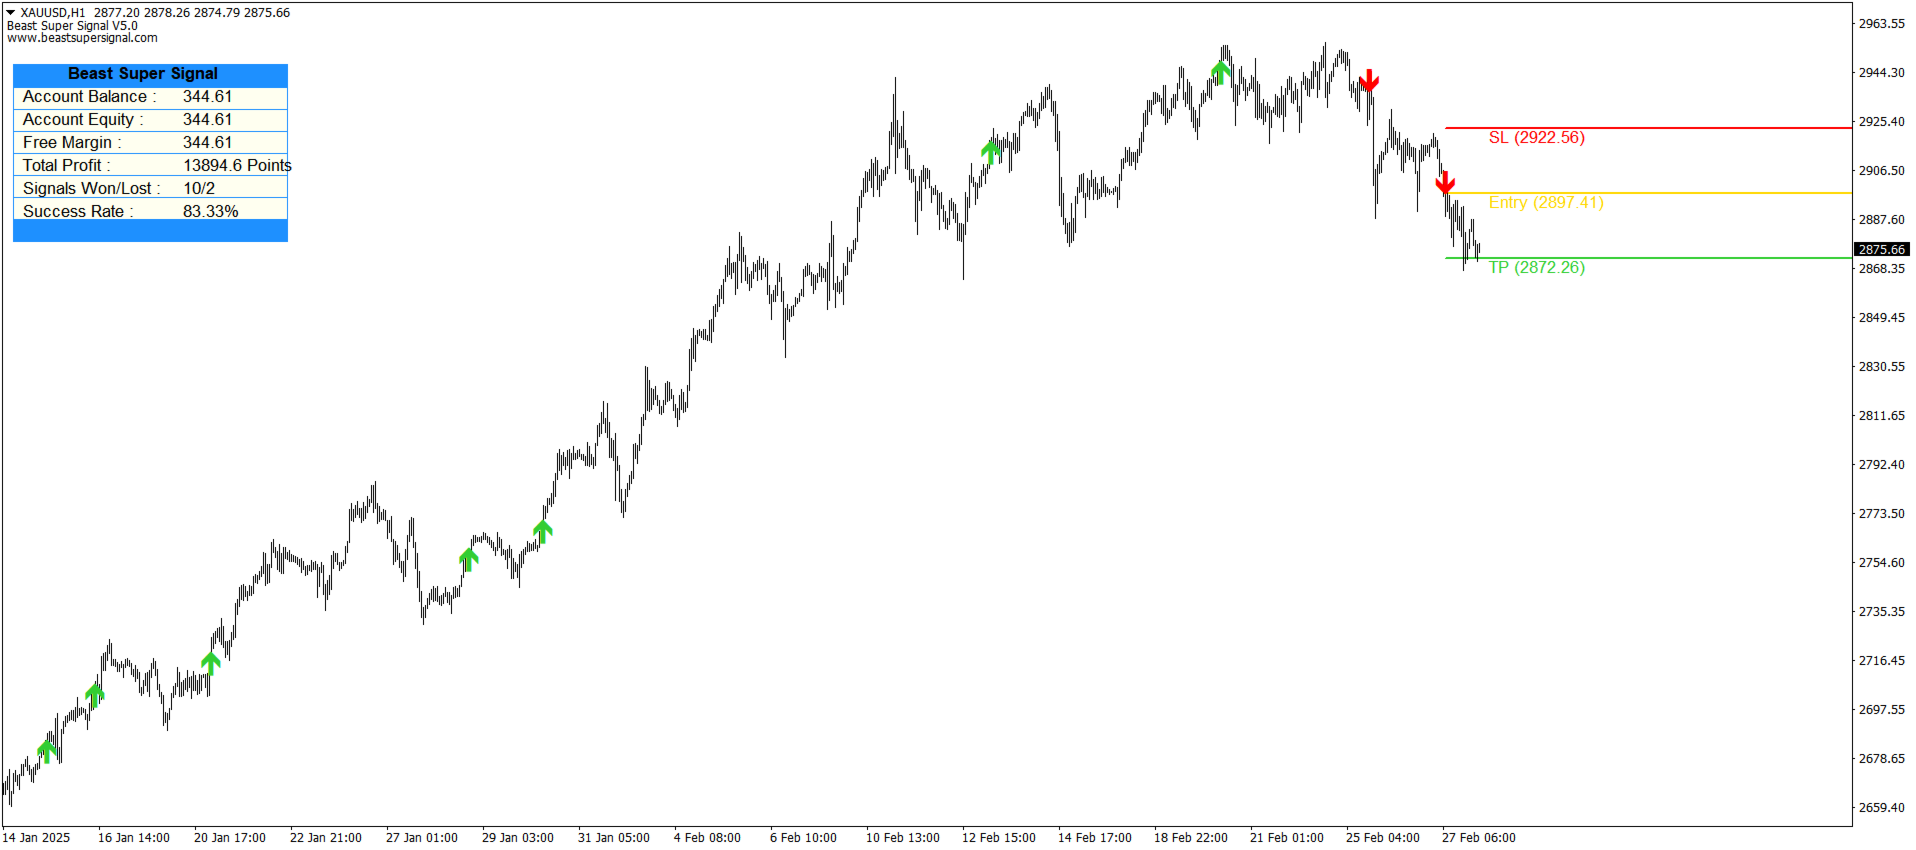
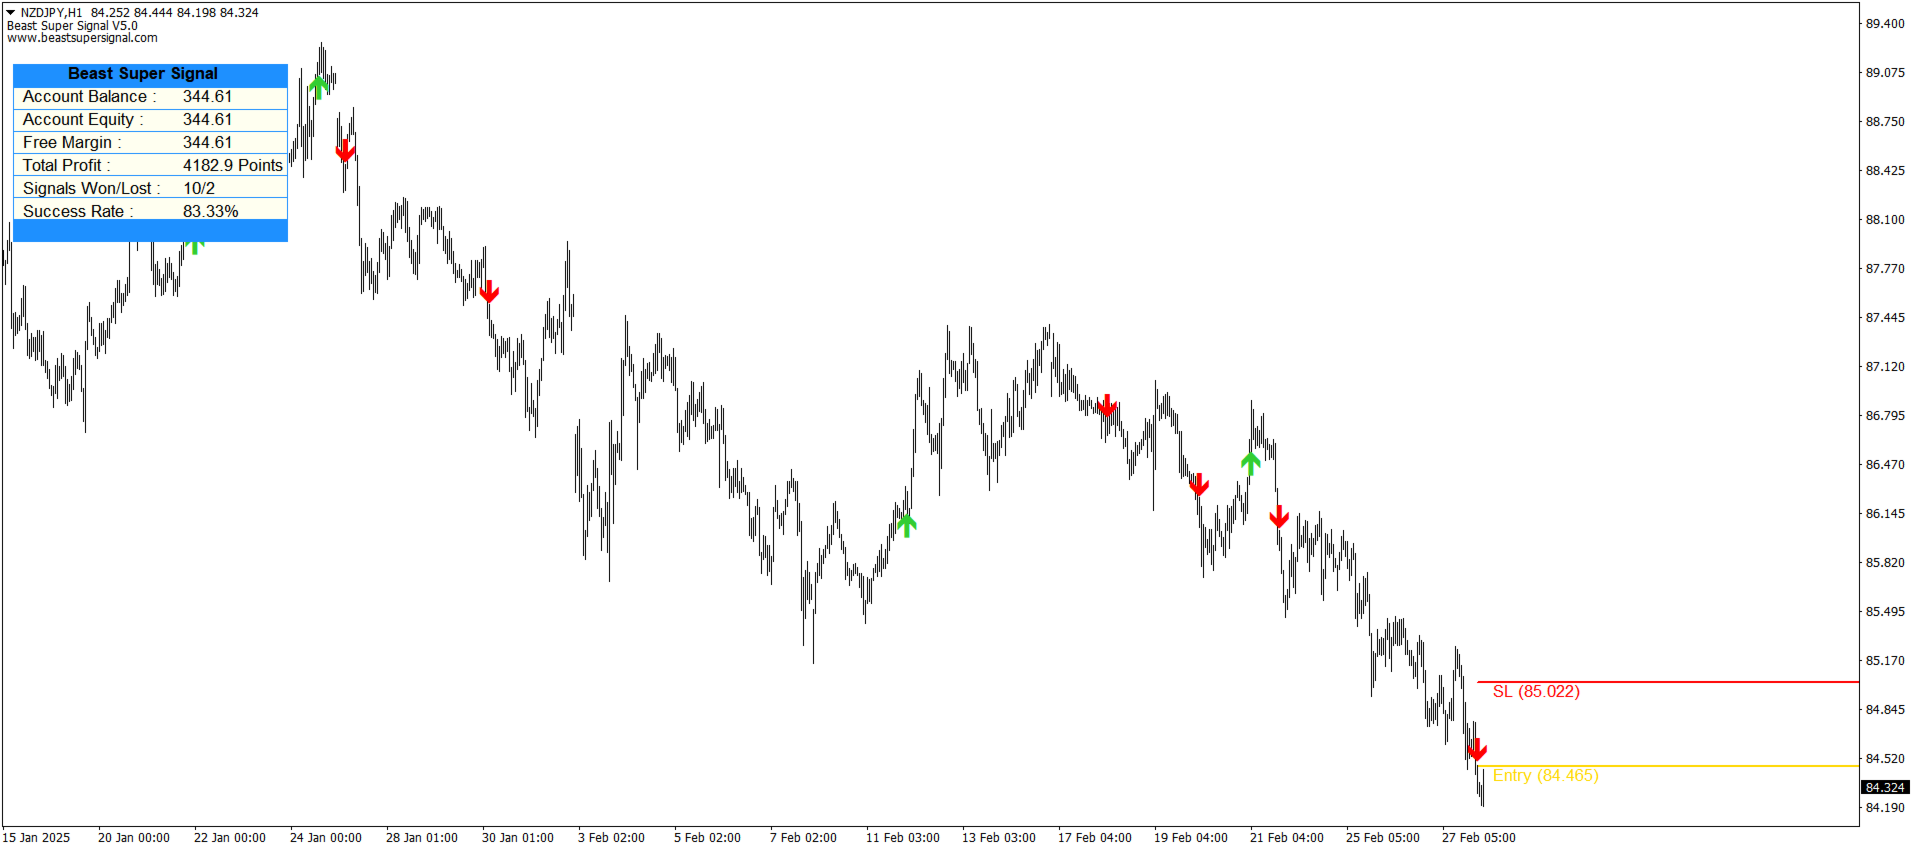
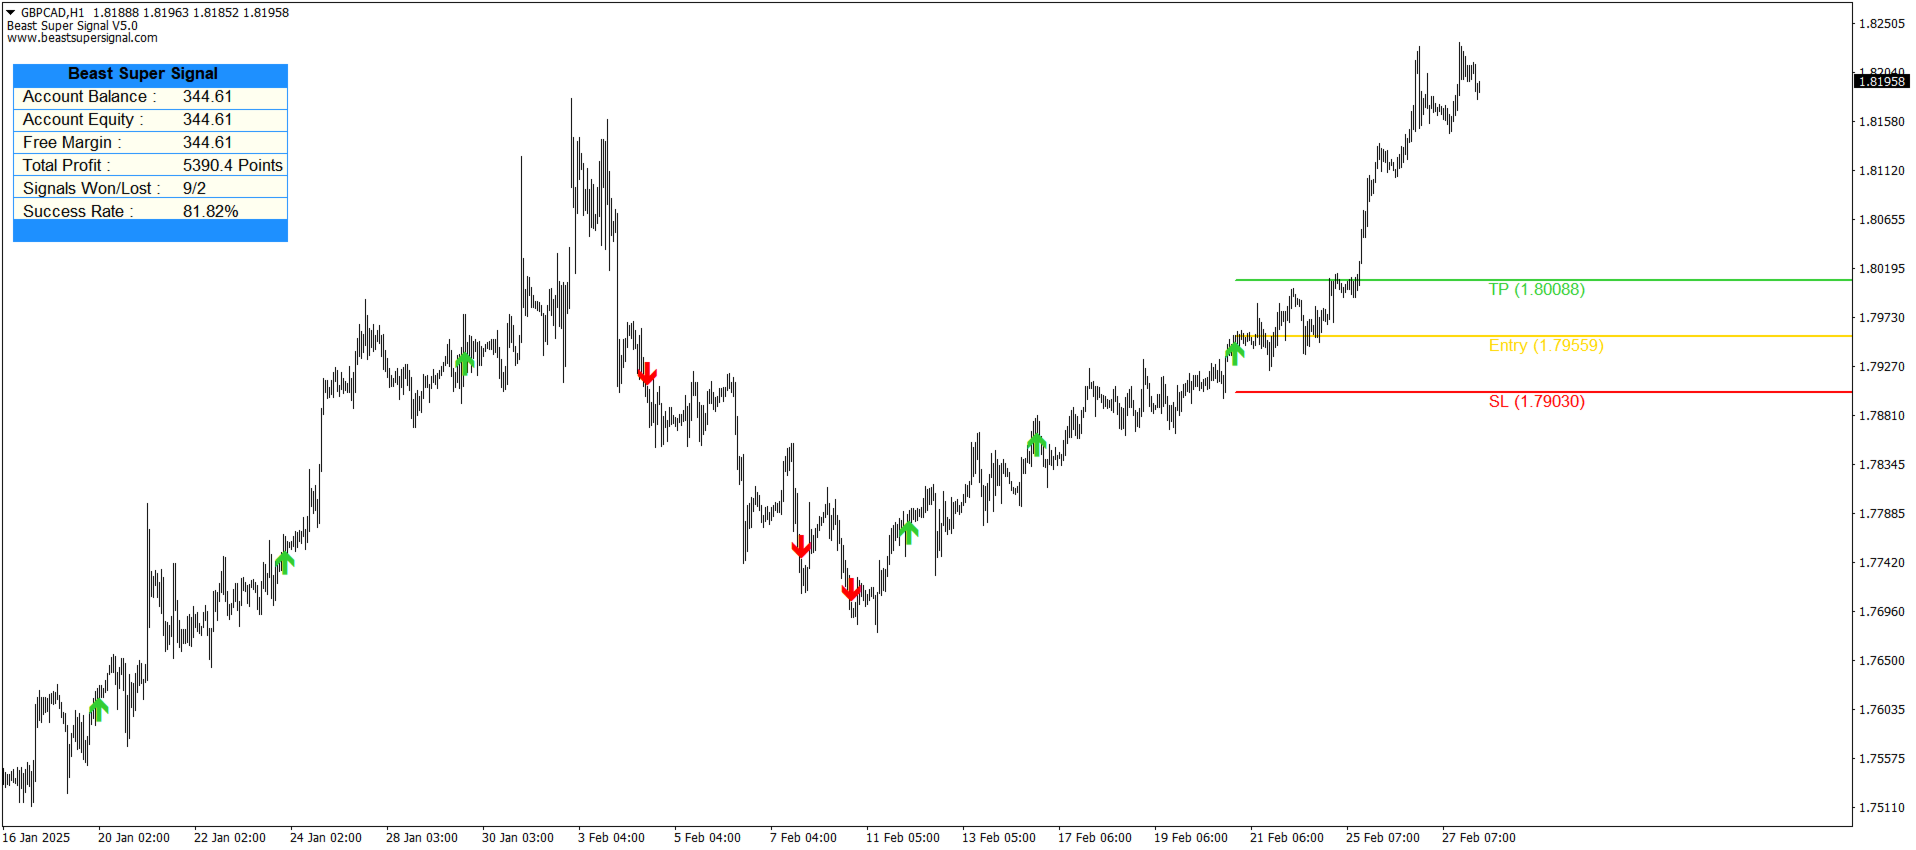
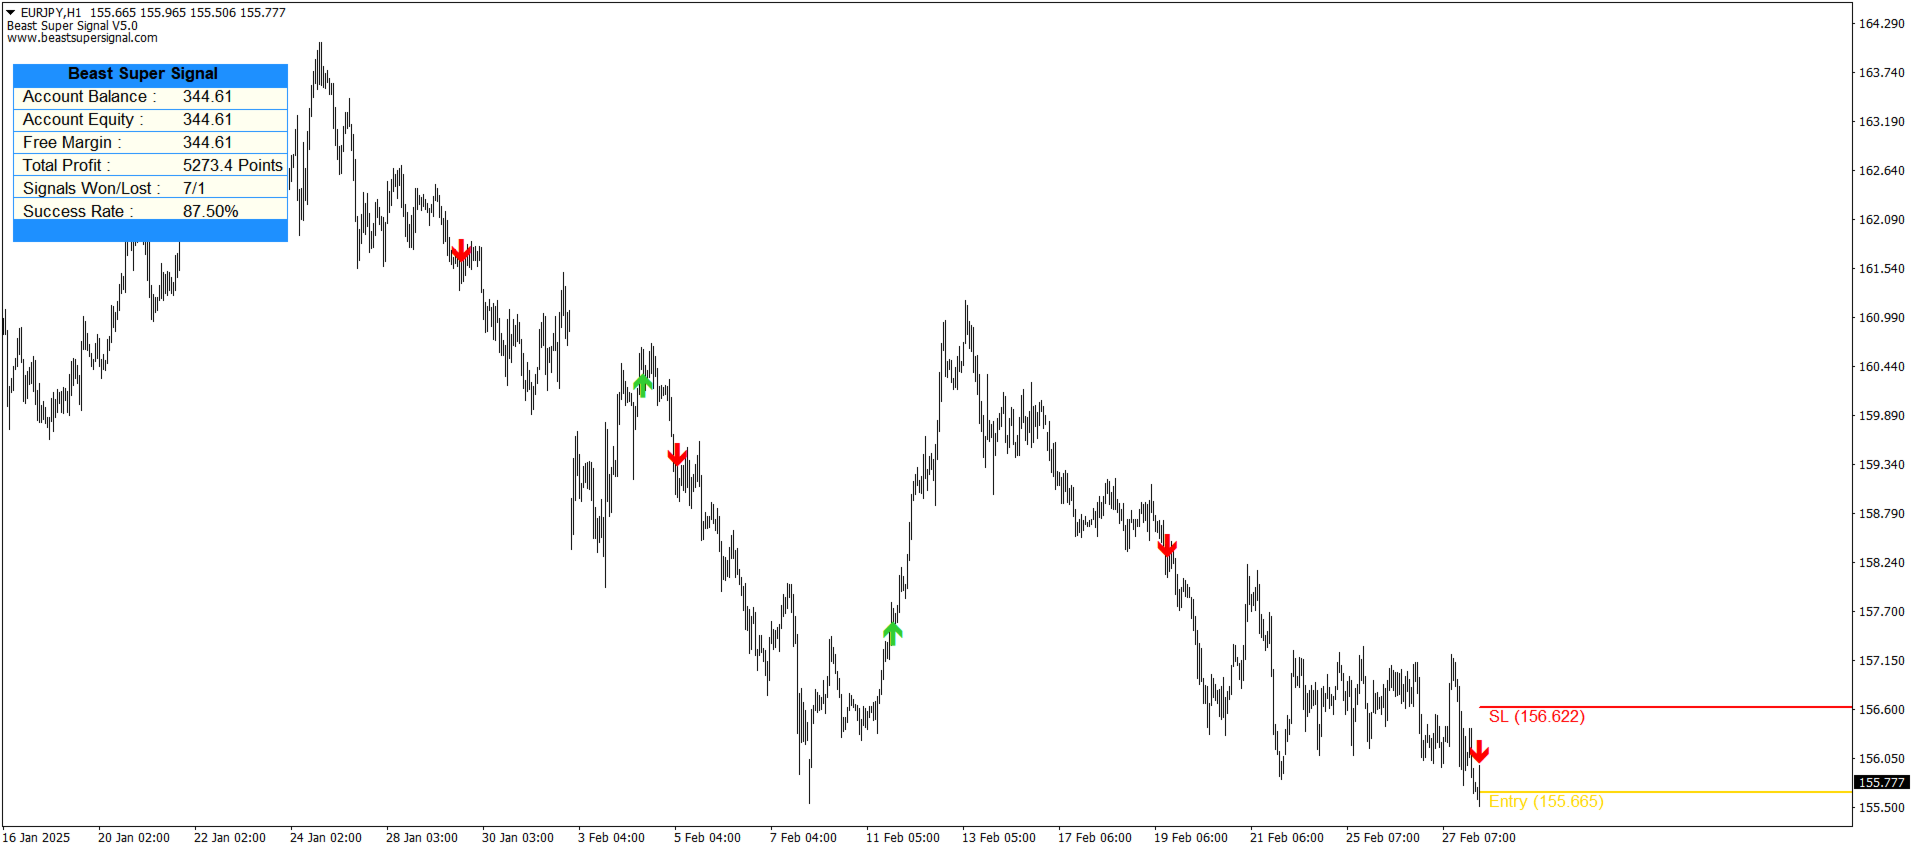
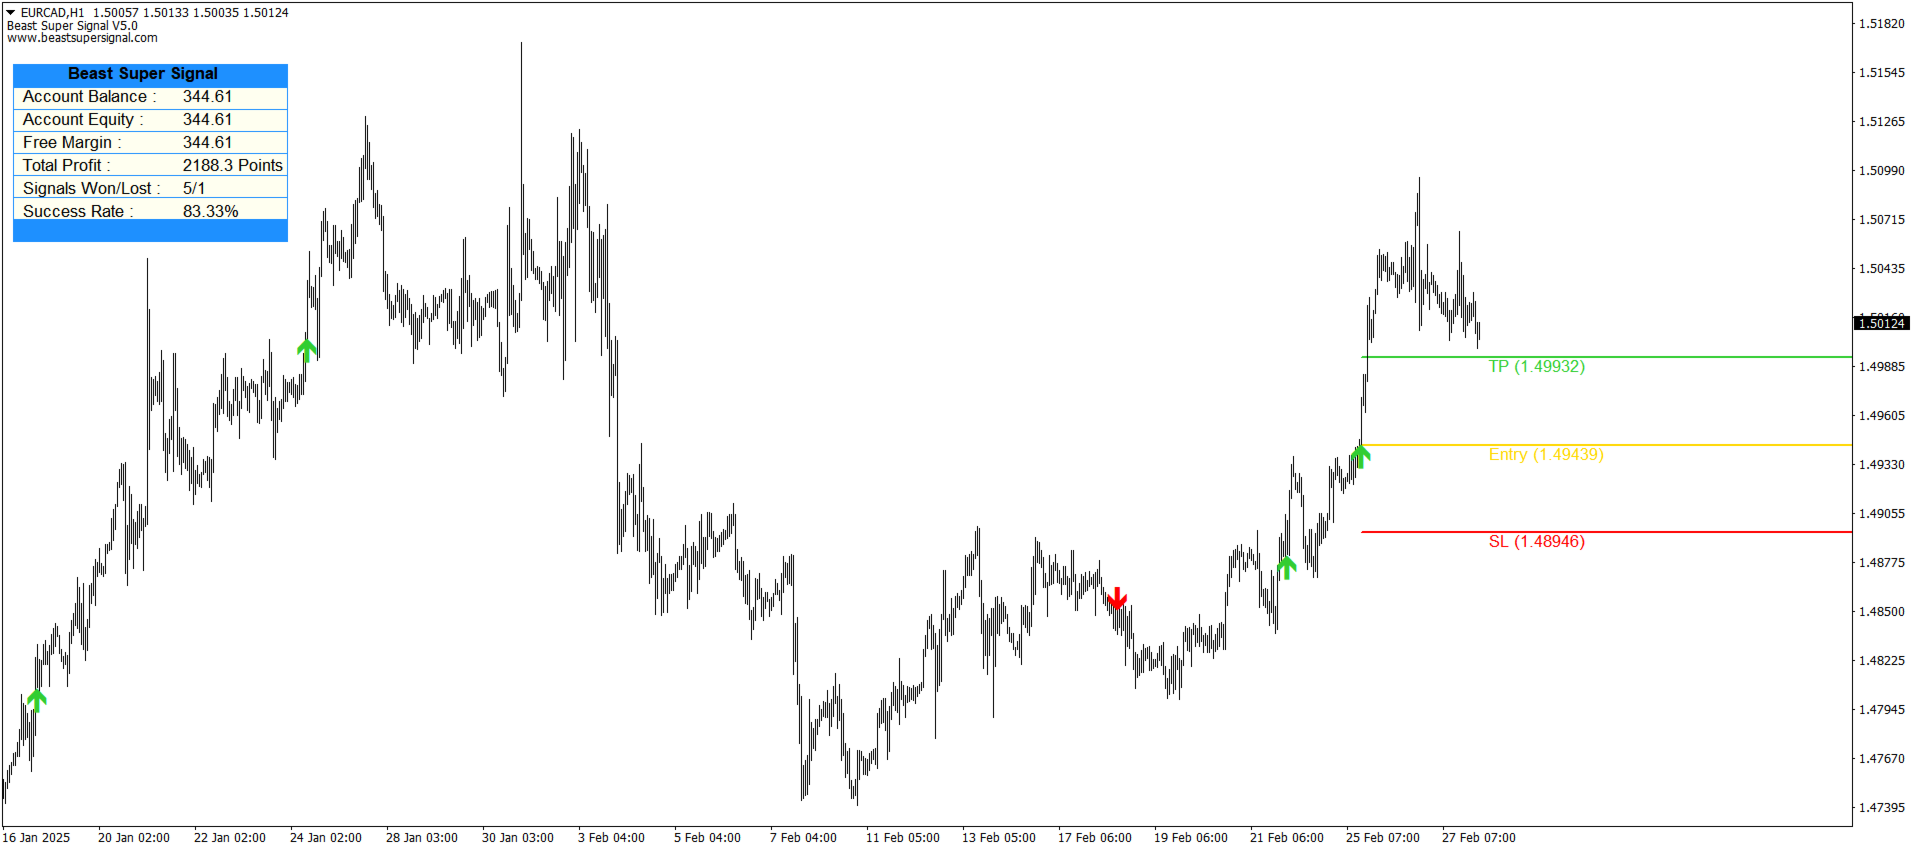
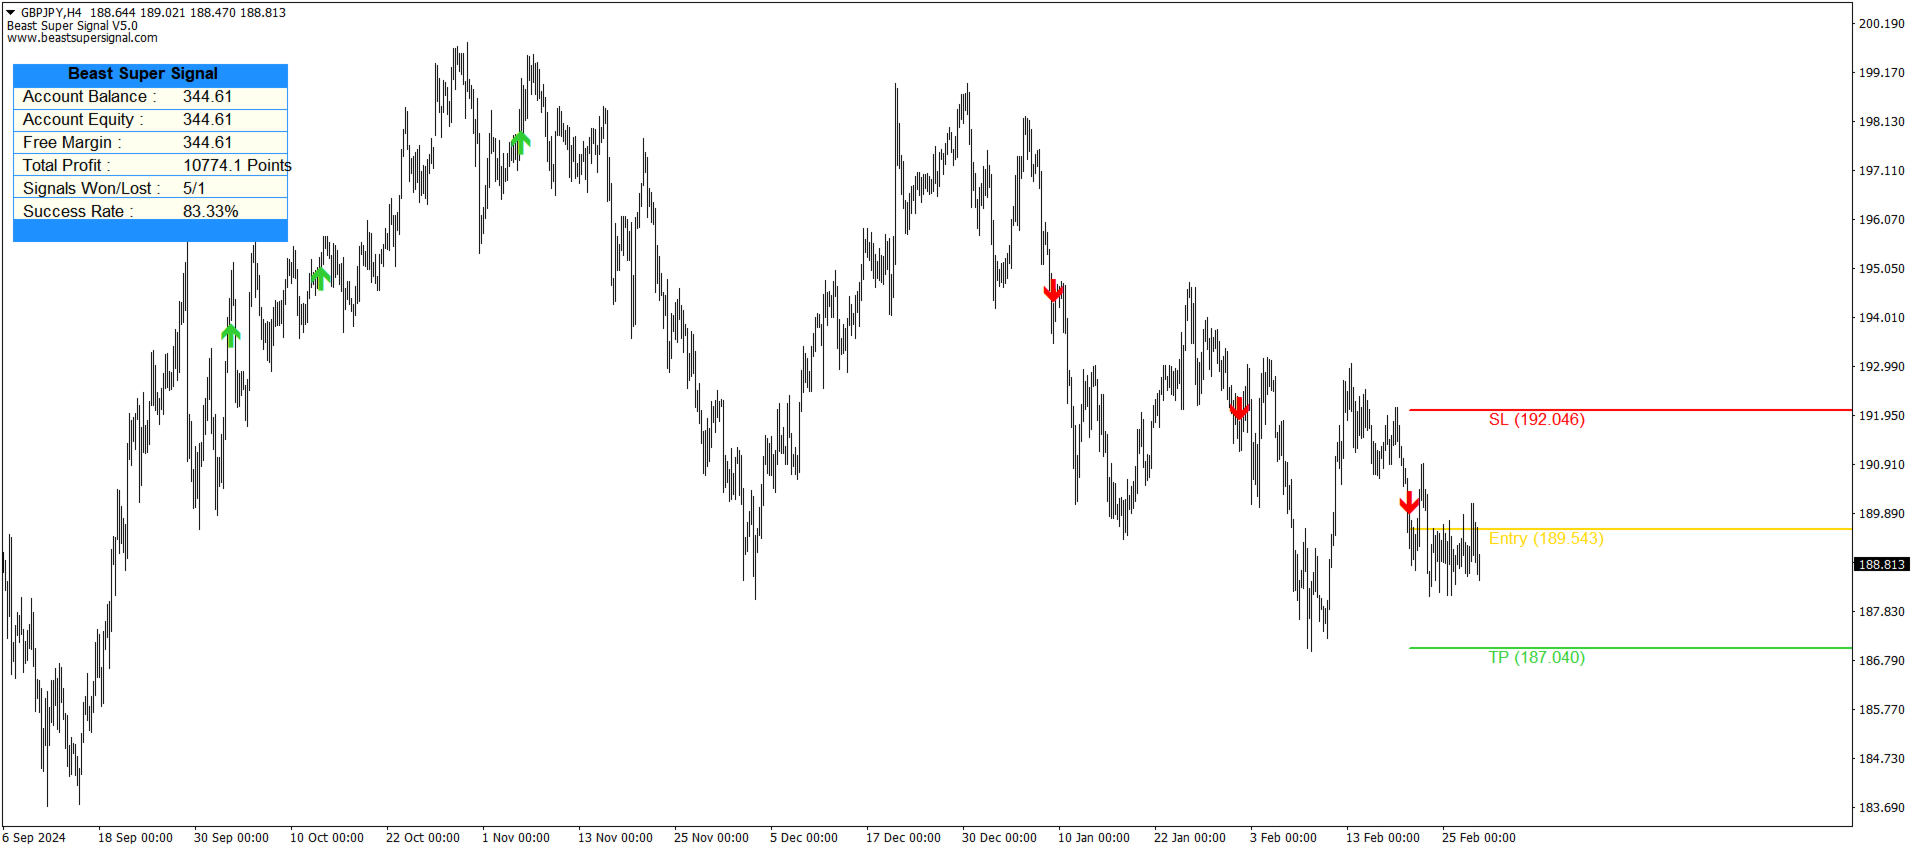
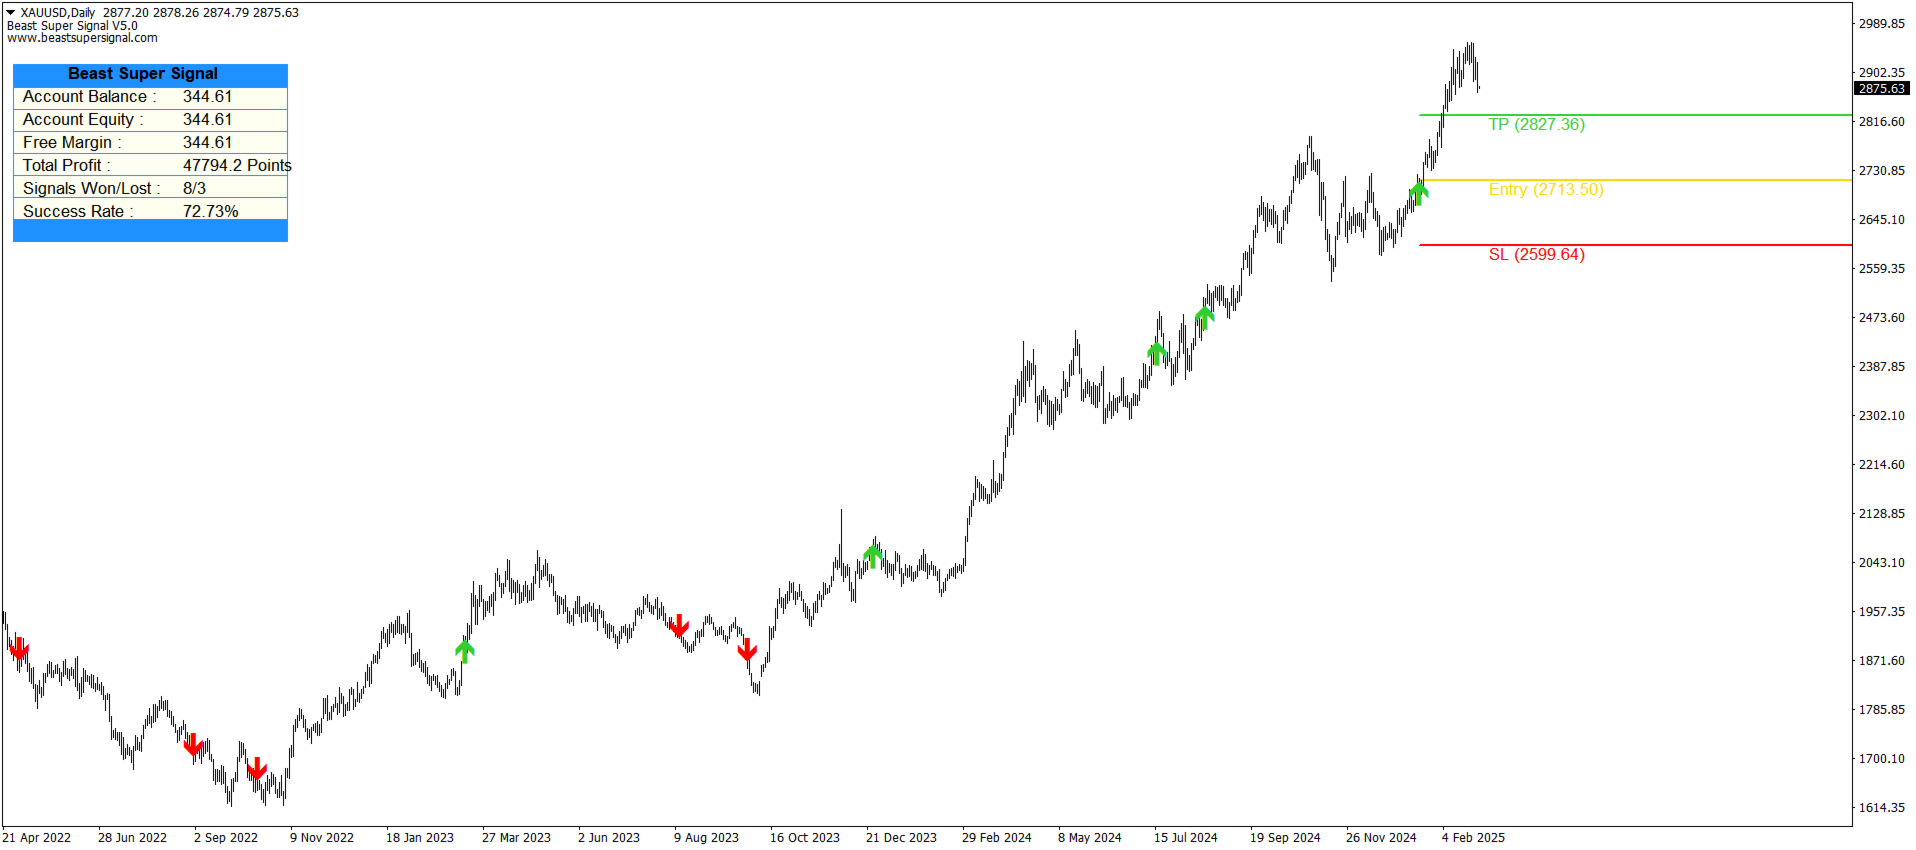
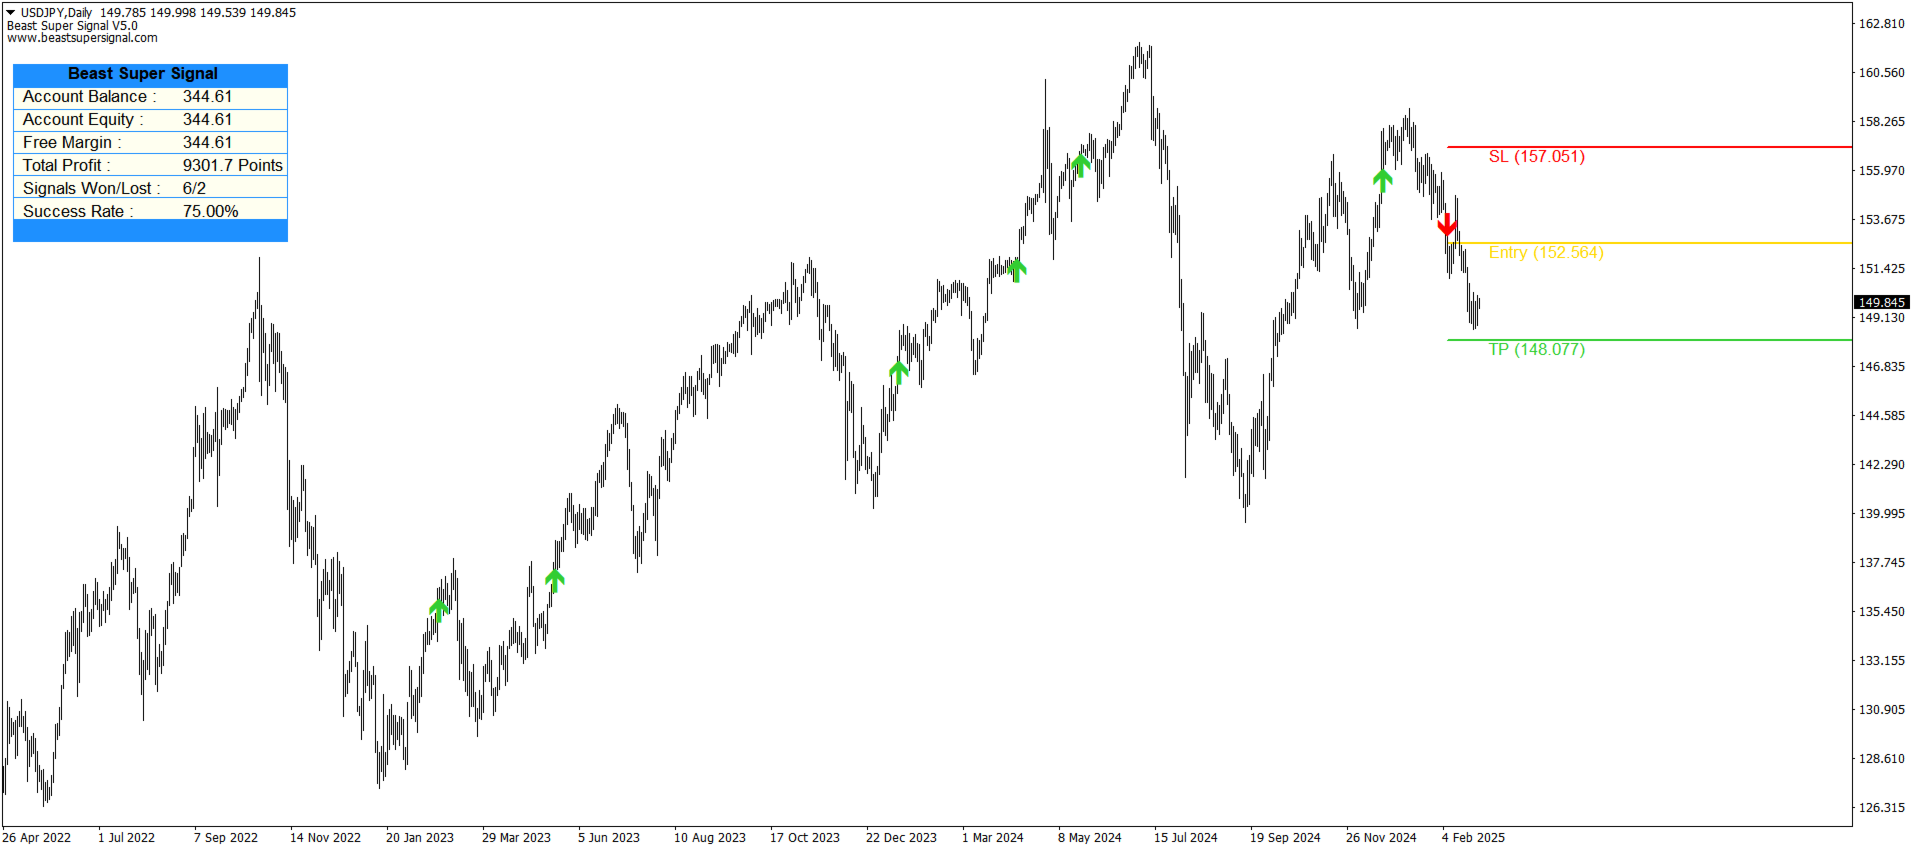
Beast Super Signal 根据您偏好的 1:1、1:2 或 1:3 风险回报率建议入场价、止损和获利水平,让您放心交易。这个 Beast Super Signal 是 100% 不可重新绘制的,这意味着它永远不会重新计算或重新绘制,每次都能为您提供可靠的信号。 Beast Super Signal 指标适用于所有时间范围,包括货币对、指数、商品和加密货币对。
Beast Super Signal 还具有 ADR 过滤器,可消除低概率信号,确保您仅交易高概率设置。此外,交易面板显示您的账户详细信息、交易信息和统计数据,使您能够轻松跟踪您的进度。该面板是完全可定制的,允许您根据自己的喜好调整颜色和大小,是手动回溯测试以找到适合您交易的最佳设置的绝佳工具。
请注意,Beast Super Signal 并未针对交易股票、二元期权、印度股票市场或 MCX Exchange 进行优化或推荐。
总体而言,Beast Super Signal 是一种准确可靠的交易指标,可简化交易流程并帮助您做出明智的交易决策。凭借其通用的用途和风险管理功能,它适合所有级别的交易者。不要错过高概率的交易机会,今天就试试 Beast Super Signal。
免责声明: 当然,重要的是要记住,过去的表现并不能保证未来的结果。这就是为什么我建议在进行实时交易之前先在模拟账户上练习以熟悉指标操作和设置,并始终使用良好的资金管理来保护您的利润。该指标并非 100% 完美,有时会有一些损失,这就是为什么必须始终使用止损来帮助减轻损失并保护您的利润。
您可以拥有的信号频率和数量将取决于许多因素,例如市场状况、市场波动、交易的时间框架和所使用的指标设置。有些日子你可能有很多信号,有些日子没有,这是完全正常的。我们注重质量而不是数量。
密切关注预定的高影响新闻事件、计划外的地缘政治新闻事件和强劲的基本面,因为这些可能导致指标在相关货币对上产生一些错误信号,即使从技术上讲信号是有效和正确的。
最后,请注意,我的产品仅在 MQL5 市场或我们的官方网站上有售。如果您看到我的产品在其他地方以更便宜的价格在网上出售,那是假货,您会被骗的。如果您从其他地方购买,您将不会得到我的任何支持。所以不要冒险 - 只从官方网站购买,不要赔钱。
请访问我的个人资料页面 这里 查看所有最新消息和更新!
如果您有任何其他问题,请随时给我发消息,我很乐意为您提供帮助。祝您使用 Beast Super Signal 指标取得最大成功!


Я долго искал индикатор который работает с криптовалютой Beast Super Signal работает на 5 с плюсом