Best Heiken Ashi for ALL
- 指标
- Manh Toan Do
- 版本: 1.50
- 更新: 30 八月 2025
### Indicator Description: Gradient Heiken Ashi with Momentum Coloring
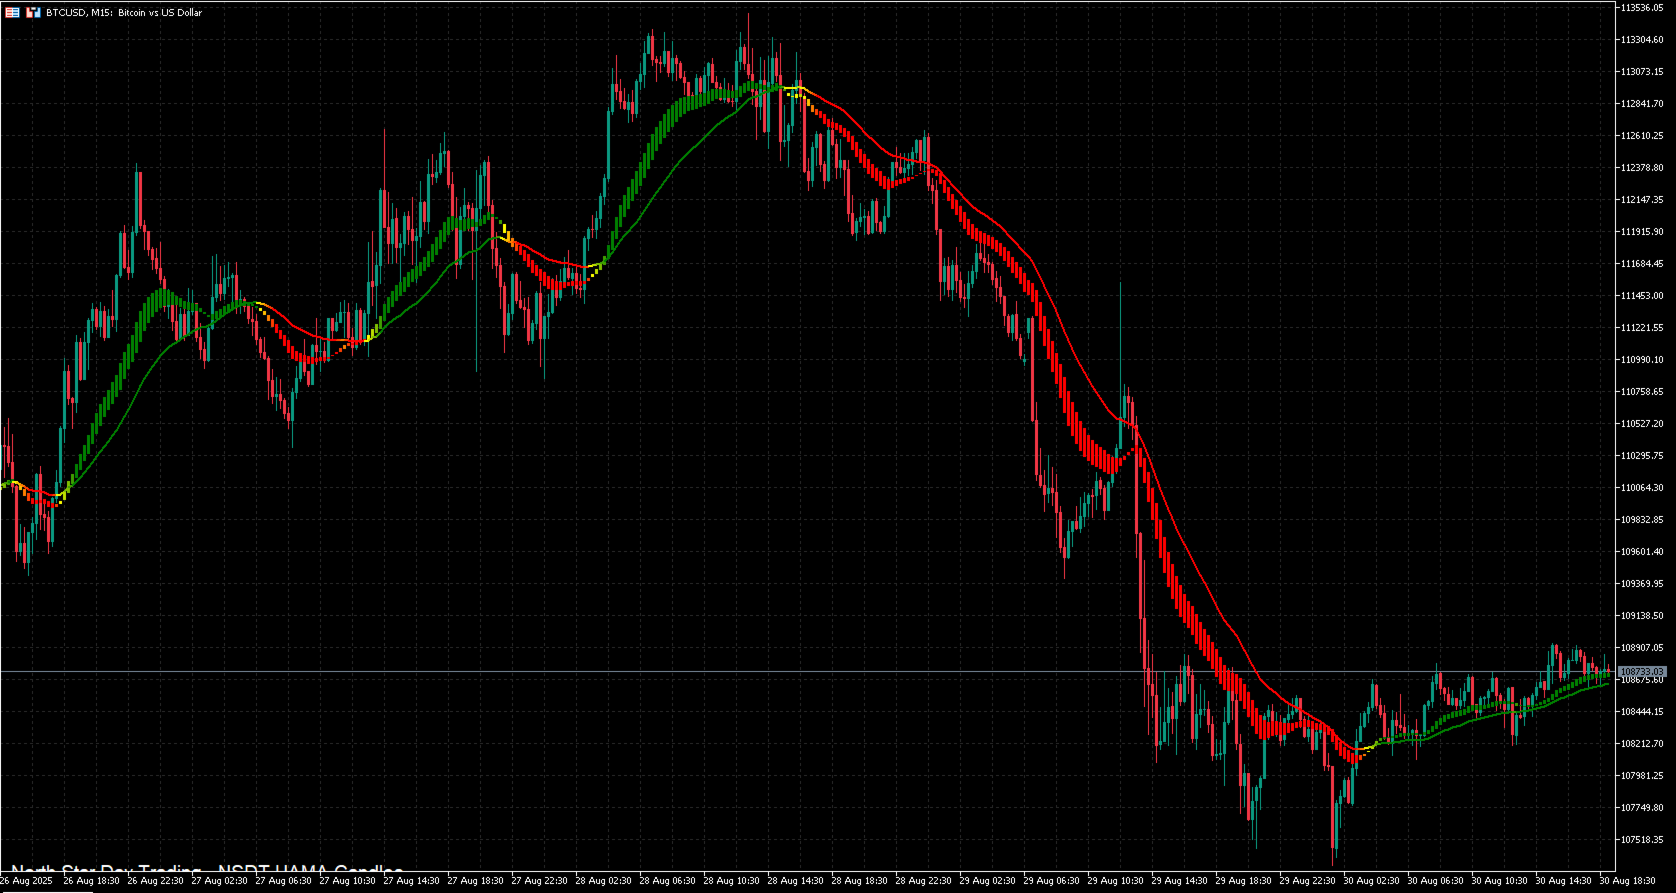
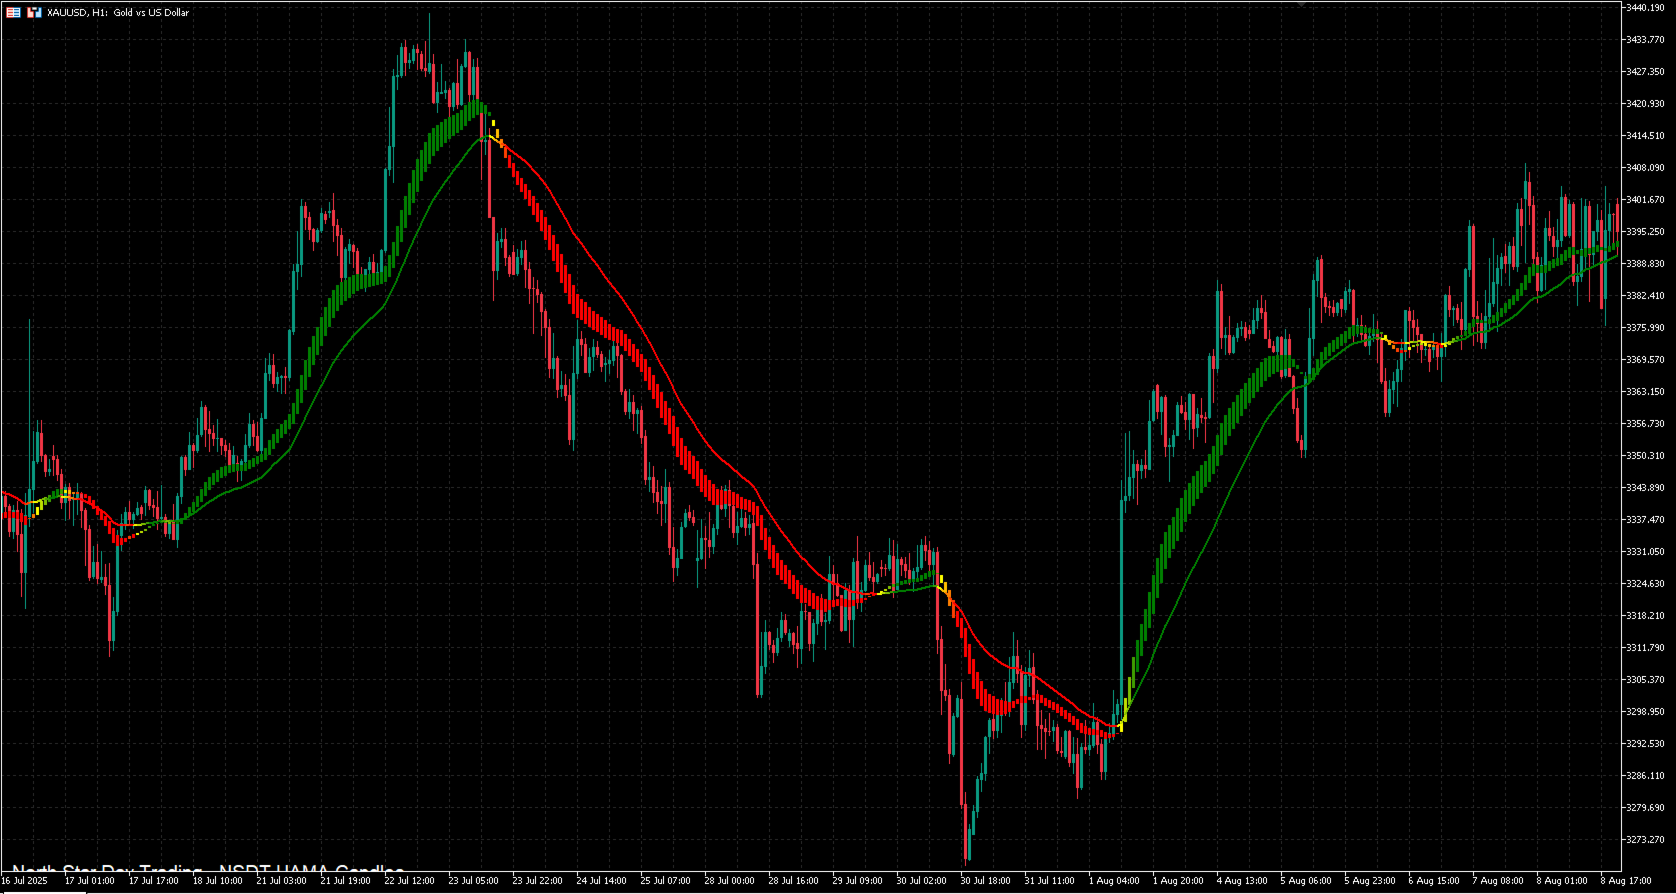
This indicator is a technical analysis tool designed to overlay on the main chart, helping traders easily identify price trends and momentum through modified Heiken Ashi candles. It combines smoothed candle value calculations based on moving averages with a gradient color system to represent the strength of bullish or bearish trends.
#### 1. Key Features
- Display of Modified Heiken Ashi Candles:
- The indicator draws optimized Heiken Ashi candles to reduce noise, making the chart clearer than standard Japanese candlesticks.
- It does not display wicks to focus on the candle body, creating a smooth curve-like trend appearance.
- Candle values are calculated as follows:
- Open: Moving average (default EMA, selectable as SMA or WMA) of the average between the previous candle's Open and Close ((open[1] + close[1])/2), with a default length of 25.
- High: EMA of the maximum between High and Close (max(high, close)), with a fixed length of 20.
- Low: EMA of the minimum between Low and Close (min(low, close)), with a fixed length of 20.
- Close: Moving average (default EMA, selectable as SMA or WMA) of the average (open + high + low + close)/4, with a default length of 20.
- The result is smoothed candles that facilitate easier identification of longer-term trends.
- Moving Average Line (MA Line):
- A primary MA line is drawn on the chart, using WMA (Weighted Moving Average) of the High-Low midpoint (hl2 = (high + low)/2), with a default length of 55.
- The MA type can be customized (EMA, SMA, or WMA) along with the data source (default hl2).
- This MA acts as a dynamic trend line, changing colors in sync with the candles to emphasize momentum.
- Gradient Color System (Momentum Coloring):
- Gradient Mode (Default Enabled): The colors of the candles and MA line gradually shift (gradient) based on the trend's momentum strength.
- Uses a custom gradient function to compute colors from neutral (Neutral Color, default yellow) to strong bullish (Bull Color, default green) or strong bearish (Bear Color, default red).
- Momentum is measured by comparing the main MA to its short-term EMA (EMA(MA, 3)).
- The number of gradient steps (Max Gradient Steps, default 5) determines the color transition level: If the MA rises continuously, colors shift from neutral to deep green; if falling, to deep red.
- Specific logic: Tracks consecutive changes (up/down) in the MA relative to the center (3-period EMA), limited to 1 to Max Steps.
- Non-Gradient Mode: Simple coloring based on comparing the current candle's Open to the previous one: Green if rising, red if falling.
- Color options (Bull, Bear, Neutral) can be edited via inputs.
- Alerts:
- Supports alerts:
- "MA Rising": When the MA rises for 2 consecutive periods.
- "MA Falling": When the MA falls for 2 consecutive periods.
- "High Crossing MA": When High crosses above the MA.
- "Low Crossing MA": When Low crosses below the MA.
#### 2. How It Works
- Calculation and Chart Drawing:
- The indicator uses buffers to store and draw the candles (DRAW_COLOR_CANDLES) and MA line (DRAW_COLOR_LINE).
- For each new bar, it computes data sources (SourceOpen, SourceHigh, SourceLow, SourceClose), then applies moving averages to generate candle values.
- The gradient is calculated based on the `f_c_gradientAdvDecPro` function, tracking MA changes to determine momentum levels (number of steps up/down).
- Colors are applied synchronously to both candles and the MA line to highlight trends.
- Customizable Inputs:
- UseGradient: Enable/disable gradient.
- MaxGradientSteps: Maximum gradient levels.
- Lengths and types of MAs for Open, Close, and MA Line.
- Colors: Bull (green), Bear (red), Neutral (yellow).
- Usage Guide on MT5:
- For clear visibility, hide the original candles by going to Chart Properties (F8) > Colors > Set "Bar Up", "Bar Down", "Bull Candle", "Bear Candle" to "None".
- The indicator is suitable for trend analysis, especially on higher timeframes, helping filter noise and confirm momentum through gradient colors.