Fibo Extrema Bands MT4

Fibo Extrema Bands is a unique indicator that visually demonstrates when the market shifts into a trend and highlights key levels acting as support or resistance. It combines easy-to-read “stepped” extrema lines with Fibonacci levels (whose values can be adjusted in the indicator’s inputs), simplifying the search for entry and exit points. Install Fibo Extrema Bands to gain a powerful tool for trend analysis and for identifying critical price levels!

This product is also available for MetaTrader 5 => https://www.mql5.com/en/market/product/131095

1. General Idea and Logic

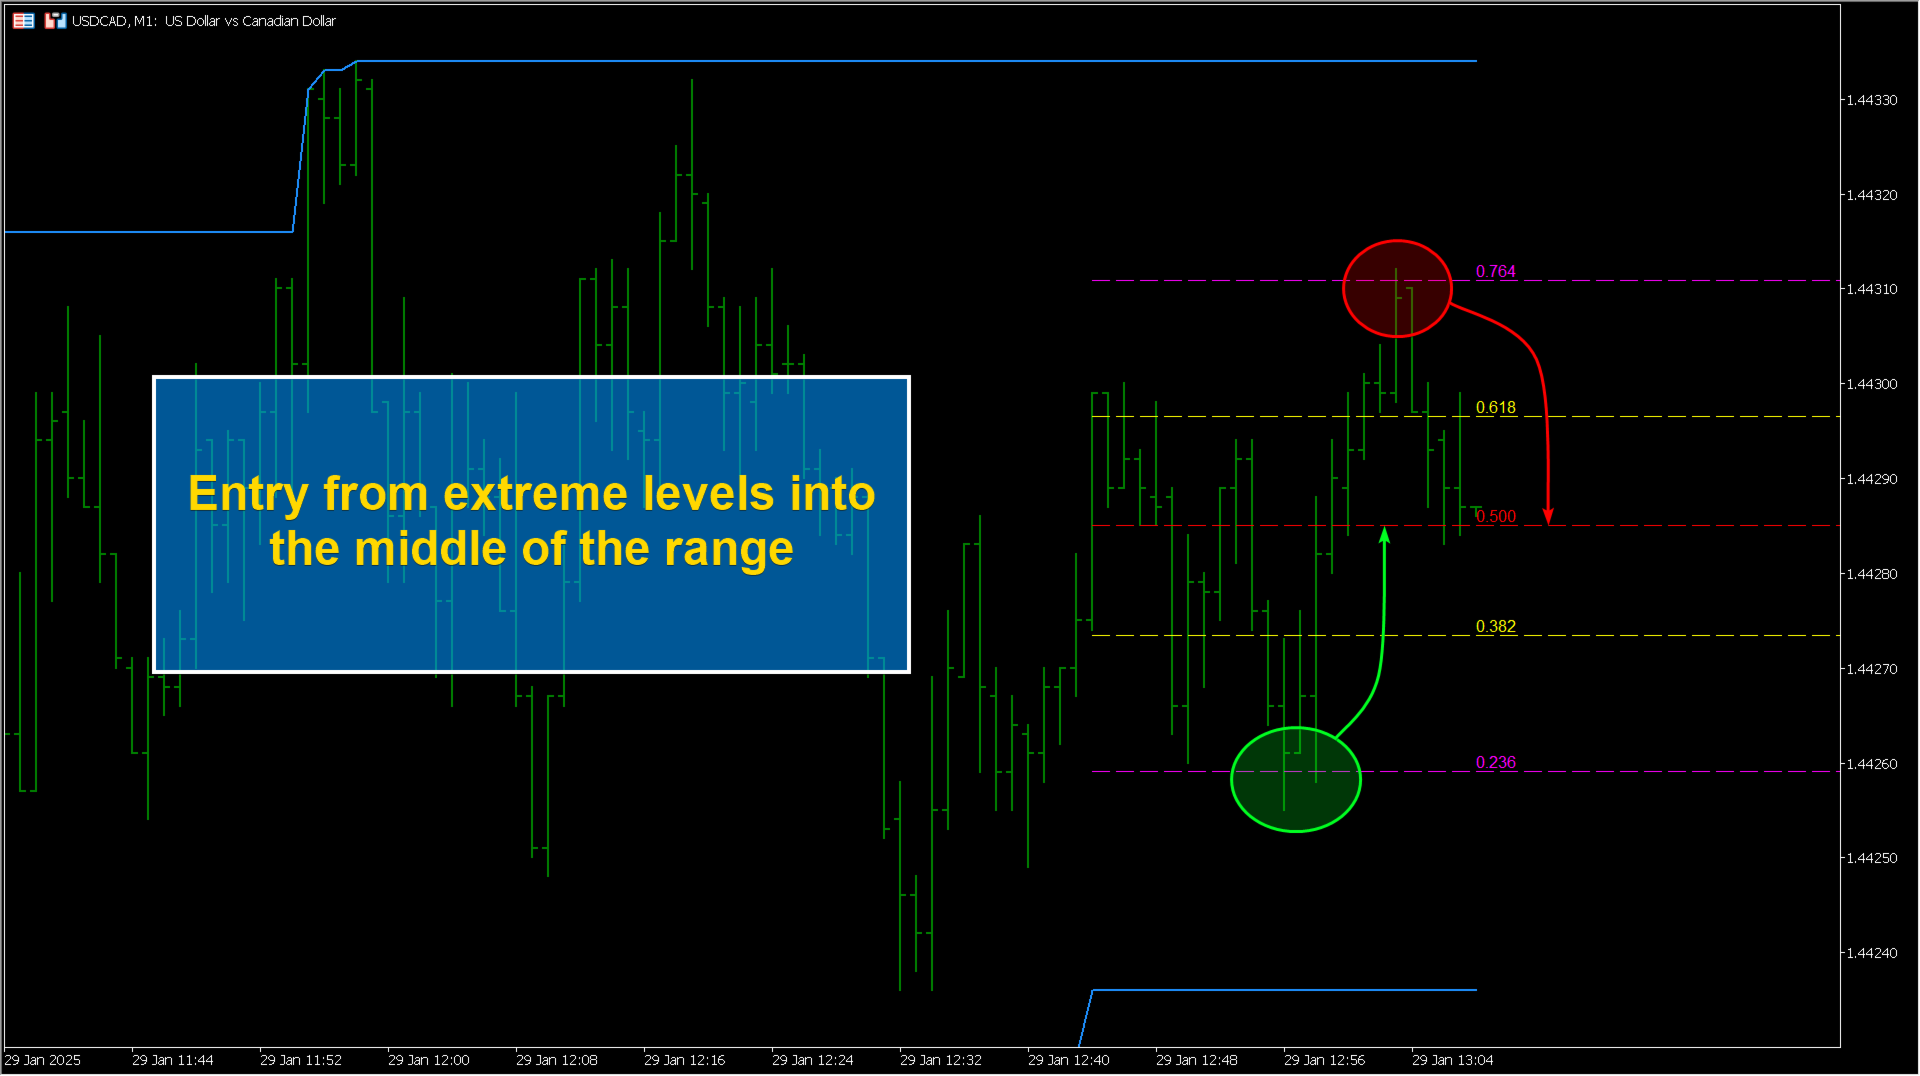
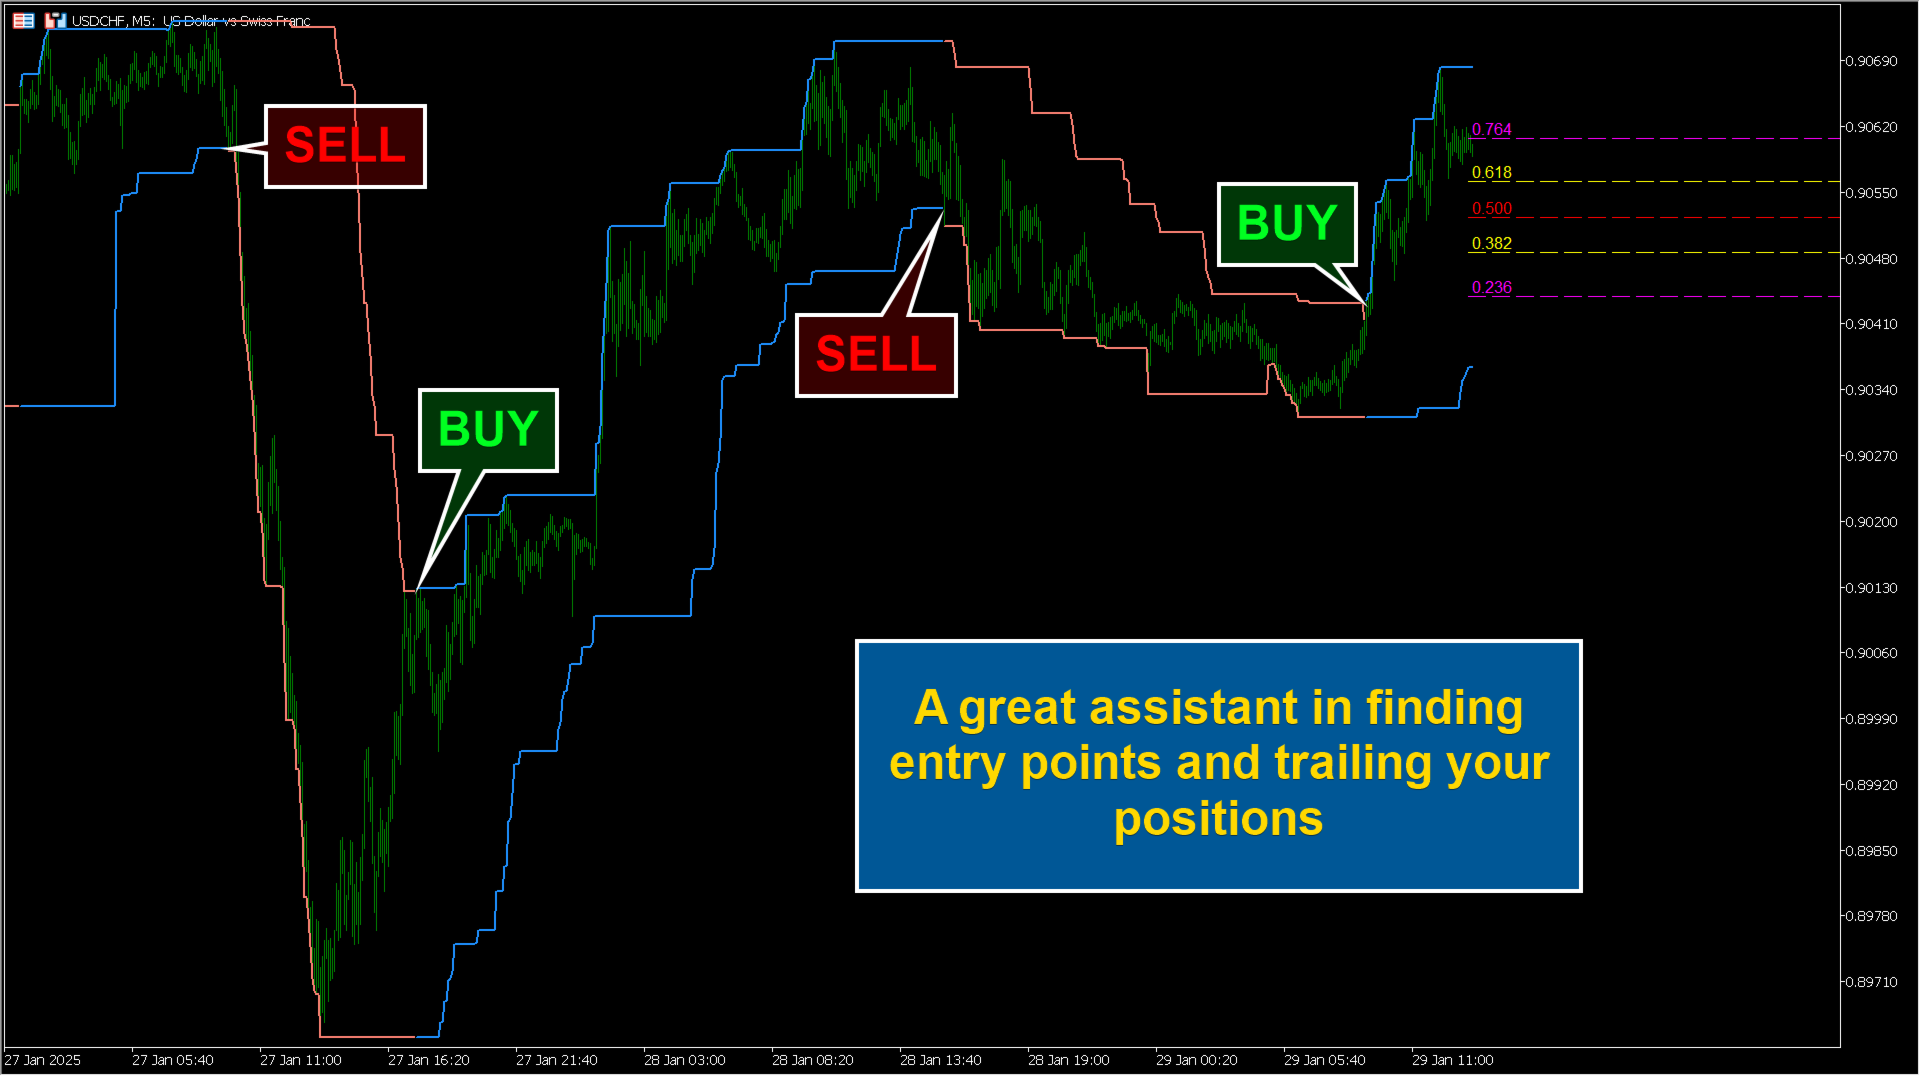
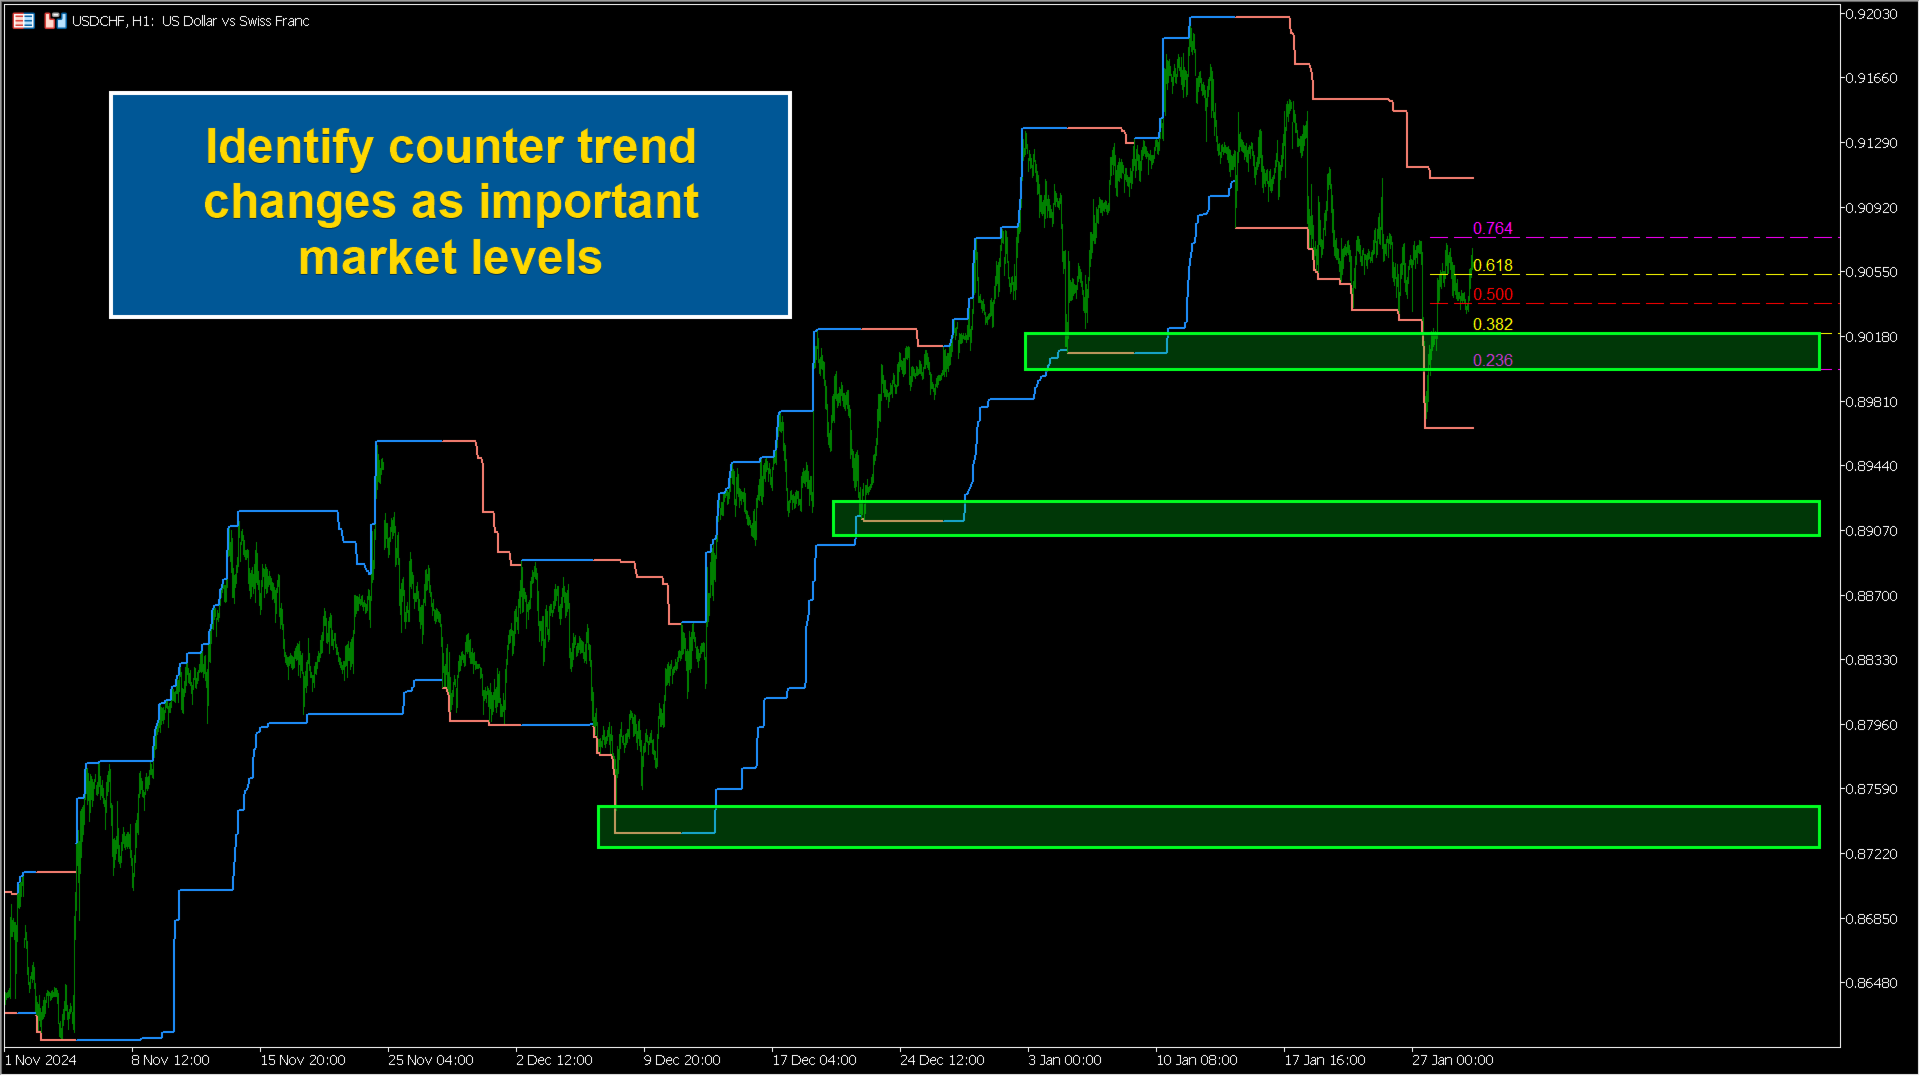
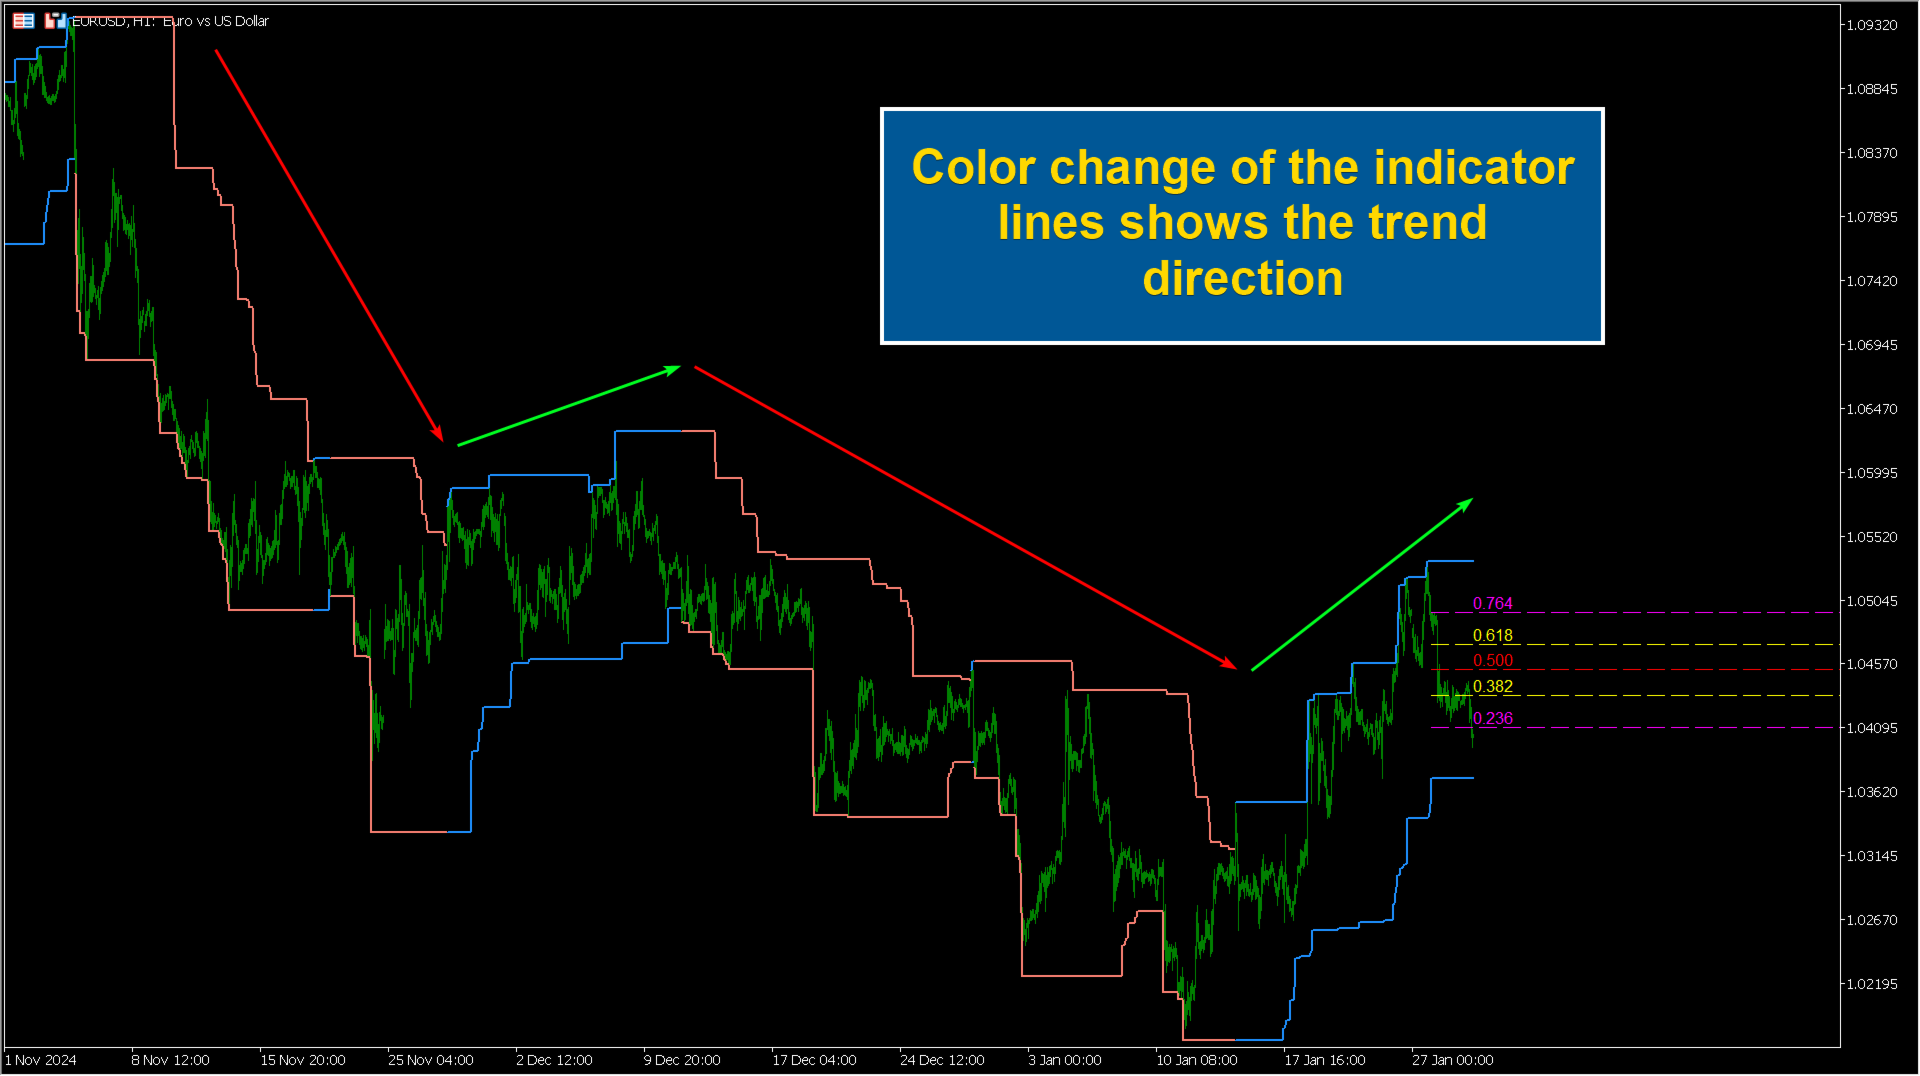
Fibo Extrema Bands identifies local highs and lows over a specified period (the “Extrema Period”) and displays them as two “stepped” lines: an upper line (the highest high) and a lower line (the lowest low). When price breaks above the upper line, a bullish trend is signaled (shown in an uptrend color). Conversely, a move below the lower line indicates a bearish trend (the lines switch to a “bearish” color). This approach instantly clarifies the market’s current directional bias. The indicator also plots five key Fibonacci levels by default (0.236, 0.382, 0.500, 0.618, 0.764), which you can freely modify in the indicator’s inputs to suit your strategy or market conditions. These levels are calculated from the difference between the current upper and lower extrema lines, making it easy to spot possible retracement or reversal points often used for placing stop-losses and take-profits.

2. Advantages of Fibo Extrema Bands

 - Clear Trend Identification: Color-coded signals highlight exactly when the market’s direction changes.

 - Flexible and Adaptive: The Extrema Period is adjustable for different volatility levels and timeframes, and the Fibonacci levels themselves can be customized.

 - Automatic Fibonacci Plotting: No need to manually draw Fib grids—the levels are added automatically.

 - Easy Visual Analysis: Distinct “stepped” lines and color changes help you quickly understand the market situation.

 - Broad Applicability: Can be used alongside various technical analysis tools and indicators.

3. Possible Uses

 - Trend Entry Points: A break above the upper band may signal a buying opportunity, while a break below the lower band may indicate a selling opportunity.

 - Confirming Other Indicators: Use Fibo Extrema Bands to validate oscillator signals (RSI, MACD, etc.).

 - Stop and Target Placement: Fibonacci levels and current extrema are excellent references for setting stop-loss and take-profit orders, with the flexibility to adjust the Fib levels as needed.

 - Identifying Sideways Markets: If price remains between the upper and lower lines without breaking them, it suggests a lack of strong trend momentum.

4. Who Will Benefit

 - Trend Traders: Easily spot when a new uptrend or downtrend starts or ends.

 - Scalpers and Day Traders: Rapid color shifts on lower timeframes help make timely decisions.

 - Swing Traders: Fibonacci levels assist in targeting corrections and planning mid- to long-term trades, with customizable levels to match market conditions.

5. Summary

Fibo Extrema Bands is a versatile indicator offering clear visual cues for trend direction and automatic (yet customizable) Fibonacci retracement levels. With an adjustable Extrema Period and the ability to modify the default Fibonacci values, it fits seamlessly into any trading system and helps you navigate market movements with greater confidence.

Input parameters:

=== INDICATOR === Indicator settings.
Extrema Period The number of bars used to determine the highest and lowest points (extrema) for plotting the “stepped” upper and lower lines.
=== GRAPHICS === Graphics settings.
--- BANDS --- Bands settings.
Up Trend Color The color of the lines in an uptrend.
Down Trend Color The color of the lines in a downtrend.
Style The style of the lines (solid, dashed, dotted, etc.).
Width The thickness of the lines.
--- LEVELS --- Levels settings.
Level #1 Value The value of Fibonacci level #1.
Level #1 Color The color of the Fibonacci level #1 line.
Level #1 Style The style of the Fibonacci level #1 line (solid, dashed, etc.).
Level #1 Width The thickness of the Fibonacci level #1 line.
Level #2 Value The value of Fibonacci level #2.
Level #2 Color The color of the Fibonacci level #2 line.
Level #2 Style The style of the Fibonacci level #2 line.
Level #2 Width The thickness of the Fibonacci level #2 line.
Level #3 Value The value of Fibonacci level #3.
Level #3 Color The color of the Fibonacci level #3 line.
Level #3 Style The style of the Fibonacci level #3 line.
Level #3 Width The thickness of the Fibonacci level #3 line.
Level #4 Value The value of Fibonacci level #4.
Level #4 Color The color of the Fibonacci level #4 line.
Level #4 Style The style of the Fibonacci level #4 line.
Level #4 Width The thickness of the Fibonacci level #4 line.
Level #5 Value The value of Fibonacci level #5.
Level #5 Color The color of the Fibonacci level #5 line.
Level #5 Style The style of the Fibonacci level #5 line.
Level #5 Width The thickness of the Fibonacci level #5 line.
Önerilen ürünler
RFI levels PRO
Roman Podpora
5 (1)
Bu gösterge, fiyat dönüş noktalarını ve fiyat geri dönüş bölgelerini doğru bir şekilde gösterir.       Başlıca oyuncular   . Yeni trendlerin nerede oluştuğunu görüyorsunuz ve her işlem üzerinde kontrolü elinizde tutarak, azami hassasiyetle kararlar alıyorsunuz. TREND LINES PRO   göstergesiyle birlikte kullanıldığında maksimum potansiyelini ortaya koyar.  VERSION MT5 Göstergenin gösterdiği şey: Yeni bir trendin başlangıcında aktivasyonla birlikte tersine dönüş yapıları ve tersine dönüş seviyeler
This indicator filters the Zigzag indicator to calculate the main support and resistance levels. Variables minimum gap between peaks : is the distance (GAP) between the peaks of the Zigzag peaks sensitivity : Minimum number of nearby peaks look back: it means that it has to test the last 50 peaks in the Zigzag object name perfix: a prefix for level’s line name on chart
FREE
Tract
Andriy Sydoruk
Tract - Channel indicator, by which you can place orders like a classic channel indicator. Trading can be carried out inside the channel when the price reaches its borders and turns in the opposite direction from them. In such cases, reversal strategies are used. The channel indicator is designed to work with support and resistance levels and help traders find opportunities to enter the market. Another way to trade a breakout - assumes a situation when the price, upon reaching one or another cha
The Visual Volatility Clustering indicator clusters the market based on volatility. The indicator does not redraw and gives accurate data, does not use closing prices. Uses the opening prices or the highs or lows of the previous completed bar. Therefore, all information will be clear and unambiguous. The essence of the indicator is to divide the price market into certain areas according to a similar type of volatility. This can be done in any way. In this example, the indicator is configured fo
EARLY REMINDER: The Starting price is 65 price will rise soon up to 365$ and then 750$ after first 10 copies of sales. Grab this offer now! Introduction Hello, traders! Welcome to the demonstration of the Forex Beast Indicator , a comprehensive tool designed to assist aspiring traders in navigating the complexities of the forex market. This indicator incorporates seven essential components to provide a well-rounded trading experience: Moving Averages Colored Zones Support and Resistance Levels
Fibonacci Trend Marker —  mevcut mumun önceki mumların Yüksek-Düşük (High-Low, HL) aralığına göre davranışını Fibonacci geri çekilme seviyelerini kullanarak analiz eden bir trend göstergesidir. Trendin gücünü görsel olarak takip eder ve mum renginin değişimiyle olası zayıflama veya tersine dönüş sinyalleri verir. Özellikler: Trend odaklı traderlar için tasarlanmıştır ve Fibonacci seviyelerine dayanarak trend değişikliklerini hızlıca tespit etmeye yardımcı olur. Piyasada yeterli volatilite olduğ
Pivot Points MT4
KEENBASE SOFTWARE SOLUTIONS
KT Pivot Points, en son verilere dayanarak günlük, haftalık ve aylık pivot seviyelerini otomatik olarak grafiğe çizer. Pivot noktaları, özellikle Forex piyasasında teknik analizde yaygın olarak kullanılan bir göstergedir. Özellikler Fiyat bir pivot seviyesine ulaştığında uyarı gönderir.  Her pivot seviyesi türü için tam özelleştirme sunar.   Günlük, haftalık ve aylık pivot seviyelerini net bir şekilde gösterir. Daha hızlı hesaplama için minimum CPU kaynağı kullanır. Grafikteki diğer göstergele
Expert. Automatic and manual trading. Ready-made trading system based on Elliott waves and Fibonacci retracement levels . It is simple and affordable. Display of the marking of Elliott waves (main or alternative option) on the chart Construction of horizontal levels, support and resistance lines, a channel Superposition of Fibonacci levels on waves 1, 3, 5, A Alert system (on-screen, E-Mail, Push notifications) visual panel for opening orders in manual trading visual panel for setting up automat
Quantum Balance
Adolfina Denysenko
Quantum Balance is a modern arrow indicator that identifies key price reversal points in the market with high accuracy. It is based on a combination of WPR (Williams %R) and RSI (Relative Strength Index), which allows you to identify overbought/oversold moments and enter trades at points of maximum potential. The indicator analyzes price dynamics and market conditions, generating signals only when several confirming factors coincide. This reduces the number of false signals and increases tradin
Fibonacci calculator is used with Elliot Waves, it can generate remarkable results. A trader could use these levels or ratios to find high probability trades with very small stop loss. You may also use these ratios to find Elliott Waves extensions and to book profit near those levels. For Elliot Wave experts, Fibonacci calculator is a highly useful tool that can assist them in calculating Fibonacci extension and retracement levels for the market price. The indicator proves itself as a useful one
The Arrow Scalper
Fawwaz Abdulmantaser Salim Albaker
1 (2)
Dear Friend..  I share with you this simple Expert Adviser .. it is full automatic  this Expert Adviser following the trend of the pair you install on or any stocks or indices , it is works like that: - when the trend on H4 chart show a start of up trend the expert will wait till the 15M & 1H charts show an up trend the EA will open a buy order directly , and do the same for down trend and open a sell order the buy or sell  order lot size and take profit and stop loss will measured manually  by
FREE
The new update makes this indicator a complete tool for studying, analyzing and operating probabilistic patterns. It includes: On-chart Multi-asset percentage monitor. Configurable martingales. Twenty-one pre-configured patterns , including Mhi patterns and C3. An advanced pattern editor to store up to 5 custom patterns. Backtest mode to test results with loss reports. Trend filter. Hit operational filter. Martingale Cycles option. Various types of strategies and alerts. Confluence between patte
Rainbow MT4 is a technical indicator based on Moving average with period 34 and very easy to use. When price crosses above MA and MA changes color to green, it’s a signal to buy. When price crosses below MA and MA changes color to red, it’s a signal to sell. The Expert advisor ( Rainbow EA MT4) based on Rainbow MT4 indicator, as you can see in the short video below is now available here .
FREE
Free automatic Fibonacci is an indicator that automatically plots a Fibonacci retracement based on the number of bars you select on the BarsToScan setting in the indicator. The Fibonacci is automatically updated in real time as new highest and lowest values appears amongst the selected bars. You can select which level values to be displayed in the indicator settings. You can also select the color of the levels thus enabling the trader to be able to attach the indicator several times with differe
FREE
This indicators automatically draws the Support and resistances levels for you once you've dropped it on a chart.  It reduces the hustle of drawing and redrawing these levels every time you analysis prices on a chart. With it, all you have to do is dropped it on a chart, adjust the settings to your liking and let the indicator do the rest.  But wait, it gets better; the indicator is absolutely free!  Get the new and improved version here:  https://youtu.be/rTxbPOBu3nY Parameters Time-frame  -> T
FREE
SMC Venom Model BPR göstergesi, Akıllı Para (SMC) konseptinde çalışan yatırımcılar için profesyonel bir araçtır. Fiyat grafiğinde iki temel modeli otomatik olarak belirler: FVG   (Adil Değer Açığı), ilk ve üçüncü mum arasında boşluk bulunan üç mumun birleşimidir. Hacim desteğinin olmadığı seviyeler arasında bir bölge oluşturur ve bu da sıklıkla fiyat düzeltmesine yol açar. BPR   (Dengeli Fiyat Aralığı), bir "köprü" oluşturan iki FVG modelinin birleşimidir - bir kırılma bölgesi ve fiyatın düşük
"Dinamik Scalping Osilatörü" - gelişmiş, özel bir Kripto-Forex göstergesi - MT4 için verimli bir işlem aracı! - Yeni nesil Osilatörler - nasıl kullanılacağını görmek için resimlere bakın. - Dinamik Scalping Osilatörü, uyarlanabilir Aşırı Satış/Aşırı Alım bölgelerine sahiptir. - Osilatör, dinamik Aşırı Satış/Aşırı Alım bölgelerinden kesin giriş noktalarını bulmak için yardımcı bir araçtır. - Aşırı Satış değerleri: Yeşil çizginin altında, Aşırı Alım değerleri: Turuncu çizginin üzerinde. - Bu gös
Mahdad Candle Timer MT4 — Real‑Time Candle Countdown Mahdad Candle Timer is a lightweight and precise MetaTrader 4 indicator that displays the remaining time until the current candle closes, shown directly beside the latest bar. It is designed for traders who rely on accurate timing — whether scalping, day trading, or waiting for candle confirmation in swing setups. Key Features Accurate Countdown – Remaining time in HH:MM:SS (optional milliseconds) Dynamic Placement – Always aligned with th
FREE
SX Supply Demand Zones accurately identifies and draws high-probability Supply and Demand zones using a sophisticated algorithm. Unlike traditional indicators that clutter your chart, this indicator is designed with a focus on performance and a clean user experience. New Unique Feature: Interactive Legend System What truly sets this indicator apart from everything else is the Interactive Control Legend. You have a professional dashboard directly on your chart that allows you to: Show/Hide: Ins
FREE
The correlation coefficient reflects the relationship between two values. It shows the dependence of changes in one value on changes in another. For example, from changes in the price of EURUSD and EURNZD. The correlation coefficient in trade, currency relations is constantly changing. Special indicators of correlation help to define it, trace changes, draw correct conclusions. One of them is the Hubbles Correlator indicator. The indicator allows you to simultaneously display several other char
Double HMA lines MTF
Pavel Zamoshnikov
5 (1)
This is a multi-timeframe version of the popular Hull Moving Average (HMA). The Double HMA MTF Light indicator combines two timeframes on a single chart. The HMA of the higher timeframe defines the trend, and the HMA of the current timeframe defines short-term price movements. The indicator is freely distributed and hasn't audio signals or messages. Its main function is the visualization of price movements. If you need advanced functionality of the HMA multi-timeframe indicator (information ab
FREE
NO REPAINT ADVANCED CHART PATTERN INDICATOR By definition, a price ( chart)  pattern is a recognizable configuration of price movement that is identified using a series of  trendlines  and/or curves. When a price pattern signals a change in trend direction, it is known as a reversal pattern; a continuation pattern occurs when the trend continues in its existing direction following a brief pause. Advanced Chart Pattern Tracker is designed to find the MOST ACCURATE patterns. A special script is a
"Auto FIBO Pro" Crypto_Forex göstergesi - ticarette harika bir yardımcı araçtır! - Gösterge, Fibo seviyelerini ve yerel trend çizgilerini (kırmızı renk) otomatik olarak hesaplar ve grafikte yerleştirir. - Fibonacci seviyeleri, fiyatın tersine dönebileceği önemli alanları gösterir. - En önemli seviyeler %23,6, %38,2, %50 ve %61,8'dir. - Ters scalping veya bölge ızgara ticareti için kullanabilirsiniz. - Auto FIBO Pro göstergesini kullanarak mevcut sisteminizi geliştirmek için birçok fırsat vardı
Like Support and Resistance levels, Round Numbers refer to price levels ending in one or more zeros, such as 125.00, 1.0350, 0.8750, 74.50, etc. These are psychological levels where financial institutions and traders expect price to either stall, retrace or breakthrough. On a price chart these figures are generally considered to rule off levels at the 50 and 100 mark. 5TT Round Numbers Indicator makes it absolutely easy for the trader to identify these levels on the chart without the laborious a
Price Magnet — Price Density and Attraction Levels Indicator Price Magnet is a professional analytical tool designed to identify key support and resistance levels based on statistical Price Density. The indicator analyzes a specified historical period and detects price levels where the market spent the most time. These zones act as “magnets,” attracting price action or forming a structural base for potential reversals. Unlike traditional Volume Profile tools, Price Magnet focuses on price-time d
Smart FVG Indicator MT4 – MetaTrader 4 için Gelişmiş Fair Value Gap Tespiti Smart FVG Indicator MT4, MetaTrader 4 grafikleri üzerinde Fair Value Gap (FVG) alanlarını profesyonel düzeyde tespit eder, izler ve uyarılar üretir. ATR tabanlı filtreleme ile piyasa yapısını dikkate alan akıllı bir algoritmayı birleştirerek gürültüyü azaltır, likiditeye uyum sağlar ve sadece en önemli dengesizlikleri bırakarak daha net işlem kararları almanıza yardımcı olur. Başlıca avantajlar Doğru FVG tespiti: Sadec
FREE
FiboZag
Andriy Sydoruk
Indicator FiboZag - transfer the indicator to the chart and the Fibonacci levels will be built automatically on the last ZigZag turn. The main advantage lies in the correct construction of Fibonacci levels and markup of price levels. Simple, visual and effective use. The indicator is not redrawn and does not lag. Works on all currency pairs and on all timeframes.
XFibo Auto Fibonacci
Welinton Dos Reis Goncalves
5 (1)
Use with disciplined risk management. Fibonacci entry system based on the golden zone 38.2 - 61.8 where the entry is confirmed at 23.6 with indications of Take Profit 3:1. Automatically plotted Fibonacci contains retracement and expansion Fibonacci in a single indicator. Up to 77% win rate with this system. FTMO challenge pass with 0.50% risk and 1.50% R:R.
The Market Structures Pro indicator finds and displays 5 (five) patterns of the Smart Money Concepts (SMC) system on the chart, namely: Break Of Structures (BoS)       Change of character (CHoCH) Equal Highs & Lows Premium, Equilibrium and Discount zones with Fibo grid High-high, Low-low, High-low and Low-high extremes Patterns are displayed for two modes - Swing and Internal and are easily distinguished by color on the chart. Internal mode features higher contrast colors, finer lines, and smal
The   Pivot Point indicator   automatically calculates and displays the pivot point line and support and resistance levels. Pivot can be calculated according to the Classic, Floor, Fibonacci, Woodie, Camarilla or DeMark formula. It is also possible to select the period for calculating the indicator. A trader can choose from daily, weekly, monthly, or user-defined periods. Types of pivots Classic Floor Fibonacci Woodie Camarilla DeMark Main features The indicator shows the current and historic
FREE
Bu ürünün alıcıları ayrıca şunları da satın alıyor
Gann Made Easy
Oleg Rodin
4.83 (155)
Gann Made Easy , bay teorisini kullanarak ticaretin en iyi ilkelerine dayanan, profesyonel ve kullanımı kolay bir Forex ticaret sistemidir. WD Gann. Gösterge, Zararı Durdur ve Kâr Al Seviyeleri dahil olmak üzere doğru SATIN AL ve SAT sinyalleri sağlar. PUSH bildirimlerini kullanarak hareket halindeyken bile işlem yapabilirsiniz. LÜTFEN ÜCRETSİZ OLARAK TİCARET İPUÇLARI, BONUSLAR VE GANN MADE EA ASİSTANI ALMAK İÇİN SATIN ALIMDAN SONRA BENİMLE İLETİŞİME GEÇİN! Muhtemelen Gann ticaret yöntemlerini b
El indicador "MR BEAST ALERTAS DE LIQUIDEZ" es una herramienta avanzada diseñada para proporcionar señales y alertas sobre la liquidez del mercado basándose en una serie de indicadores técnicos y análisis de tendencias. Ideal para traders que buscan oportunidades de trading en función de la dinámica de precios y los niveles de volatilidad, este indicador ofrece una visualización clara y detallada en la ventana del gráfico de MetaTrader. Características Principales: Canal ATR Adaptativo: Calcula
Are you looking for a simple and reliable indicator that can help you spot market swing points easily? Do you want clear buy and sell signals that work on any timeframe and any trading instrument? Buy Sell Signal Pro is designed to do exactly that. It helps traders identify important market turning points and understand the current market structure in a clear and easy way. This indicator detects Higher Highs (HH), Higher Lows (HL), Lower Highs (LH), and Lower Lows (LL) so you can quickly see wh
M1 Sniper
Oleg Rodin
5 (19)
M1 SNIPER kullanımı kolay bir işlem göstergesi sistemidir. M1 zaman dilimi için tasarlanmış bir ok göstergesidir. Gösterge, M1 zaman diliminde scalping için bağımsız bir sistem olarak kullanılabilir ve mevcut işlem sisteminizin bir parçası olarak kullanılabilir. Bu işlem sistemi özellikle M1'de işlem yapmak için tasarlanmış olsa da, diğer zaman dilimleriyle de kullanılabilir. Başlangıçta bu yöntemi XAUUSD ve BTCUSD ticareti için tasarladım. Ancak bu yöntemi diğer piyasalarda işlem yaparken de ya
Miraculous Göstergesi – Gann Dokuz Kareye Dayalı %100 Tekrarlamayan Forex ve İkili Araç Bu video, Forex ve İkili Opsiyon traderları için özel olarak geliştirilmiş son derece doğru ve güçlü bir ticaret aracı olan Miraculous Göstergesi 'ni tanıtıyor. Bu göstergeyi benzersiz kılan, efsanevi Gann Dokuz Karesi ve Gann Titreşim Yasası 'na dayanmasıdır; bu da onu modern ticarette mevcut en hassas tahmin araçlarından biri yapmaktadır. Miraculous Göstergesi tamamen tekrarlamaz ; yani mum kapandıktan son
PRO Renko Sistemi, RENKO grafikleri ticareti için özel olarak tasarlanmış son derece hassas bir ticaret sistemidir. Bu, çeşitli ticaret araçlarına uygulanabilen evrensel bir sistemdir. Sistemi etkin piyasa sana doğru ters sinyallerine erişim hakkı denilen ses nötralize eder. Göstergenin kullanımı çok kolaydır ve sinyal üretiminden sorumlu tek bir parametreye sahiptir. Aracı, seçtiğiniz herhangi bir ticaret aracına ve renko çubuğunun boyutuna kolayca uyarlayabilirsiniz. Yazılımımla karlı bir
Scalper Inside PRO
Alexey Minkov
4.74 (69)
An exclusive indicator that utilizes an innovative algorithm to swiftly and accurately determine the market trend. The indicator automatically calculates opening, closing, and profit levels, providing detailed trading statistics. With these features, you can choose the most appropriate trading instrument for the current market conditions. Additionally, you can easily integrate your own arrow indicators into Scalper Inside Pro to quickly evaluate their statistics and profitability. Scalper Inside
Trend Lines PRO
Roman Podpora
5 (1)
TREND ÇİZGİLERİ PRO     Piyasanın gerçek yön değişimini anlamaya yardımcı olur. Gösterge, gerçek trend dönüşlerini ve büyük oyuncuların piyasaya yeniden girdiği noktaları gösterir. Anlıyorsun     BOS hatları  Daha yüksek zaman dilimlerindeki trend değişiklikleri ve önemli seviyeler, karmaşık ayarlar veya gereksiz gürültü olmadan gösterilir. Sinyaller yeniden çizilmez ve çubuk kapandıktan sonra grafikte kalır. VERSION MT 5     -    RFI LEVELS PRO  göstergesiyle birlikte kullanıldığında maksimum p
Precautions for subscribing to indicator This indicator only supports the computer version of MT4 Does not support MT5, mobile phones, tablets The indicator only shows the day's entry arrow The previous history arrow will not be displayed (Live broadcast is for demonstration) The indicator is a trading aid Is not a EA automatic trading No copy trading function The indicator only indicates the entry position No exit (target profit)  The entry stop loss point is set at 30-50 PIPS Or the front hi
PairMaster Buy Sell Arrow Indicator for MT4 Trade Reversals Like a Pro — Catch Every Swing Point with Precision The PairMaster Buy Sell Arrow Indicator is a powerful MetaTrader 4 tool built to identify high-probability swing trading opportunities . Designed for traders who value accuracy, clarity, and simplicity, PairMaster detects key market turning points and plots intuitive buy and sell arrows directly on your chart. Key Features Accurate Swing Point Detection – Automatically identifies ma
ŞU ANDA %40INDIRIMLI Yeni Başlayanlar veya Uzman Tüccarlar için En İyi Çözüm! Bu Gösterge benzersiz, yüksek kaliteli ve uygun fiyatlı bir ticaret aracıdır çünkü bir dizi tescilli özellik ve yeni bir formül ekledik. Sadece BİR grafik ile 28 Forex çifti için Döviz Gücünü okuyabilirsiniz! Yeni bir trendin veya scalping fırsatının tam tetik noktasını belirleyebildiğiniz için ticaretinizin nasıl gelişeceğini hayal edin? Kullanım kılavuzu: buraya tıklayın Bu ilk olan, orijinal! Değersiz bir özent
Volatility Trend System - girişler için sinyaller veren bir ticaret sistemi. Oynaklık sistemi, trend yönünde doğrusal ve noktasal sinyaller ve ayrıca yeniden çizme ve gecikme olmaksızın trendden çıkmak için sinyaller verir. Trend göstergesi, orta vadeli trendin yönünü izler, yönünü ve değişimini gösterir. Sinyal göstergesi volatilitedeki değişikliklere dayalıdır ve piyasa girişlerini gösterir. Gösterge, çeşitli uyarı türleri ile donatılmıştır. Çeşitli alım satım araçlarına ve zaman dilimlerine
Currency Strength Wizard , başarılı ticaret için size hepsi bir arada çözüm sağlayan çok güçlü bir göstergedir. Gösterge, birden çok zaman dilimindeki tüm para birimlerinin verilerini kullanarak şu veya bu forex çiftinin gücünü hesaplar. Bu veriler, şu veya bu para biriminin gücünü görmek için kullanabileceğiniz, kullanımı kolay para birimi endeksi ve para birimi güç hatları biçiminde temsil edilir. İhtiyacınız olan tek şey, işlem yapmak istediğiniz tabloya göstergeyi eklemektir ve gösterge size
Dynamic Forex28 Navigator
Bernhard Schweigert
4.43 (7)
Dynamic Forex28 Navigator - Yeni Nesil Forex Ticaret Aracı. ŞU ANDA %49 İNDİRİM. Dynamic Forex28 Navigator, uzun zamandır popüler olan göstergelerimizin evrimidir ve üçünün gücünü tek bir göstergede birleştirir: Gelişmiş Döviz Gücü28 Göstergesi (695 inceleme) + Gelişmiş Döviz İMPULS ve UYARI (520 inceleme) + CS28 Kombo Sinyalleri (Bonus). Gösterge hakkında ayrıntılar https://www.mql5.com/en/blogs/post/758844 Yeni Nesil Güç Göstergesi Ne Sunuyor?  Orijinallerde sevdiğiniz her şey, şimdi yeni
ŞU ANDA %40 INDIRIMLI !!! Yeni Başlayanlar veya Uzman Tüccarlar için En İyi Çözüm! Bu gösterge benzersiz, yüksek kaliteli ve uygun fiyatlı bir ticaret aracıdır çünkü bir dizi tescilli özellik ve gizli bir formül ekledik. Yalnızca BİR grafikle 28 döviz çiftinin tümü için Uyarılar verir. Yeni bir trendin veya scalping fırsatının tam tetik noktasını belirleyebildiğiniz için ticaretinizin nasıl gelişeceğini hayal edin! Yeni temel algoritmalar üzerine inşa edilen bu sistem, potansiyel işlemlerin
Trend indicator AI
Ramil Minniakhmetov
4.57 (82)
Trend Ai göstergesi, trend tanımlamasını işlem yapılabilir giriş noktaları ve geri dönüş uyarılarıyla birleştirerek bir yatırımcının piyasa analizini geliştirecek harika bir araçtır. Bu gösterge, kullanıcıların forex piyasasının karmaşıklıklarında güvenle ve hassasiyetle yol almalarını sağlar. Birincil sinyallerin ötesinde, Trend Ai göstergesi geri çekilmeler veya düzeltmeler sırasında ortaya çıkan ikincil giriş noktalarını belirleyerek, yatırımcıların belirlenen trend içindeki fiyat düzeltmele
Meravith
Ivan Stefanov
5 (3)
Market maker aracı. Meravith şunları yapar: Tüm zaman dilimlerini analiz eder ve geçerli trendi gösterir. Alış ve satış hacimlerinin eşit olduğu likidite bölgelerini (hacim dengesi) vurgular. Farklı zaman dilimlerinden tüm likidite seviyelerini doğrudan grafiğinizde gösterir. Referansınız için metin tabanlı piyasa analizi üretir ve sunar. Mevcut trende göre hedefler, destek seviyeleri ve stop-loss noktalarını hesaplar. İşlemleriniz için risk/ödül oranını hesaplar. Hesap bakiyenize göre pozisyon
GOLD Impulse with Alert
Bernhard Schweigert
4.64 (11)
Bu gösterge, 2 ürünümüz Advanced Currency IMPULSE with ALERT  +   Currency Strength Exotics  'in süper bir kombinasyonudur. Tüm zaman dilimleri için çalışır ve 8 ana para birimi artı bir Sembol için grafiksel olarak güç veya zayıflık dürtüsünü gösterir! Bu Gösterge, Altın, Egzotik Çiftler, Emtialar, Endeksler veya Vadeli İşlemler gibi herhangi bir sembol için para birimi gücü ivmesini göstermek için uzmanlaşmıştır. Türünün ilk örneğidir, Altın, Gümüş, Petrol, DAX, US30, MXN, TRY, CNH vb. içi
Advanced Supply Demand
Bernhard Schweigert
4.91 (298)
Özel Ticaret –%40 İndirim Yeni Başlayanlar veya Uzman Yatırımcılar İçin En İyi Çözüm! Bu gösterge, bir dizi özel özellik ve yeni bir formül içerdiği için benzersiz, yüksek kaliteli ve uygun fiyatlı bir işlem aracıdır. Bu güncelleme ile çift zaman dilimi bölgeleri gösterebileceksiniz. Sadece daha yüksek bir zaman dilimini değil, hem grafik zaman dilimini hem de daha yüksek zaman dilimini gösterebileceksiniz: İÇ İÇE GEÇMİŞ BÖLGELER GÖSTERİYOR. Tüm Arz Talep yatırımcıları buna bayılacak. :) Önem
FX Power MT4 NG
Daniel Stein
4.95 (21)
FX Power: Daha Akıllı Ticaret Kararları için Para Birimlerinin Gücünü Analiz Edin Genel Bakış FX Power , her piyasa koşulunda başlıca para birimlerinin ve altının gerçek gücünü anlamak için vazgeçilmez bir araçtır. Güçlü para birimlerini alıp zayıf olanları satarak, FX Power ticaret kararlarınızı basitleştirir ve yüksek olasılıklı fırsatları ortaya çıkarır. İster trendlere sadık kalın ister Delta'nın aşırı değerlerini kullanarak tersine dönüşleri öngörün, bu araç ticaret tarzınıza mükemmel bir
Gold Scalper Super
Aleksandr Makarov
5 (2)
Gold Scalper Super is an easy-to-use trading system. The indicator can be used as a standalone scalping system on the M1 time frame, as well as part of your existing trading system. Bonus: when purchasing an indicator, Trend Arrow Super is provided free of charge, write to us after purchase. The indicator 100% does not repaint!!! If a signal appears, it does not disappear! Unlike indicators with redrawing, which lead to the loss of a deposit, because they can show a signal and then remove it.
KT Trend Trading Suite MT4
KEENBASE SOFTWARE SOLUTIONS
KT Trend Trading Suite, trend takibi stratejisini birden fazla kırılma noktasıyla birleştiren çok özellikli bir göstergedir. Bu kırılma noktaları giriş sinyali olarak kullanılır. Yeni bir trend oluştuğunda, bu gösterge o trendi yakalayabilmek için birçok giriş fırsatı sunar. Daha az önemli giriş noktalarını filtrelemek için bir geri çekilme eşiği kullanılır. MT5 sürümüne buradan ulaşabilirsiniz  https://www.mql5.com/en/market/product/46270 Özellikler Piyasa dinamiklerini tek bir denklem içi
Şu anda %40 İNDİRİMLİ! Herhangi bir Acemi veya Uzman Tüccar için En İyi Çözüm! Bu gösterge paneli yazılımı 28 döviz çifti üzerinde çalışıyor. Ana göstergelerimizden 2'sine (Gelişmiş Para Birimi Gücü 28 ve Gelişmiş Para Birimi Dürtüsü) dayanmaktadır. Tüm Forex piyasasına harika bir genel bakış sağlar. Gelişmiş Para Birimi Gücü değerlerini, para birimi hareket hızını ve tüm (9) zaman dilimlerinde 28 Forex çifti için sinyalleri gösterir. Trendleri ve / veya scalping fırsatlarını belirlemek için
Top Bottom Tracker , piyasa trendini analiz eden ve trendin en yüksek ve en düşük seviyelerini tespit edebilen sofistike algoritmalara dayanan bir göstergedir / MT5 sürümü . Fiyat 500$'a ulaşana kadar kademeli olarak artacaktır. Sonraki fiyat --> $99 Özellikler Yeniden boyama yok Bu gösterge, yeni veriler geldiğinde değerlerini değiştirmez İşlem çiftleri Tüm forex çiftleri Zaman Dilimi Tüm zaman dilimleri Parametreler ==== Gösterge yapılandırması ==== Konfigürasyon parametresi // 40
Currency Strength Exotics
Bernhard Schweigert
4.88 (33)
ŞU ANDA %20 INDIRIMLI! Herhangi bir Acemi veya Uzman Tüccar için En İyi Çözüm! Bu Gösterge, Egzotik Çiftler Emtialar, Endeksler veya Vadeli İşlemler gibi herhangi bir sembol için para birimi gücünü göstermek için uzmanlaşmıştır. Türünün ilk örneğidir, Altın, Gümüş, Petrol, DAX, US30, MXN, TRY, CNH vb. gerçek para birimi gücünü göstermek için 9. satıra herhangi bir sembol eklenebilir. Bu benzersiz, yüksek kaliteli ve uygun fiyatlı bir ticaret aracıdır çünkü bir dizi tescilli özelliği ve yeni b
GM Arrows Pro
Guillaume Pierre Philippe Mesplont
Product Name: GM Arrows Pro – Signals & Alerts Short Description: GM Arrows Pro is a clean, reliable MT4 indicator showing BUY/SELL arrows on the chart with unique alerts at the moment the signal appears. Full Description: GM Arrows Pro is a professional MT4 indicator designed for traders who want clear, actionable signals: BUY and SELL arrows visible on the entire chart history Unique alerts when a new signal appears (no repeated alerts) Option to disable repetitive signals ( disable_repeatin
System Trend Pro
Aleksandr Makarov
5 (2)
System Trend Pro - This is the best trend trading indicator!!! The indicator no repaint!!!  The indicator has   MTF   mode, which adds confidence to trading on the trend (   no repaint   ). How to trade? Everything is very simple, we wait for the first signal (big arrow), then wait for the second signal (small arrow) and enter the market in the direction of the arrow. (See screens 1 and 2.) Exit on the opposite signal or take 20-30 pips, close half of it, and keep the rest until the opposite
Candle Power Pro
Thushara Dissanayake
4.5 (8)
The       Mum Gücü Pro       çözmek için tasarlanmış sofistike bir ticaret aracıdır       gerçek hacim baskısı, kene verisi dengesizlikleri ve kurumsal sipariş akışı dinamikleri       ölçerek       Boğa keneleri ile ayı keneleri arasındaki savaş       gerçek zamanlı olarak. Bu gösterge ham verileri dönüştürür       hacim verilerini eyleme dönüştürülebilir içgörülere dönüştürerek   , yatırımcıların       Akıllı Para hareketleri, likidite avları ve gizli piyasa psikolojisi       her fiyat mumunun
Grafikleri yapılandıran ve döngüsel fiyat hareketlerini belirleyen teknik bir gösterge. Herhangi bir grafik üzerinde çalışabilirim. Birkaç çeşit bildirim var. Grafiğin kendisinde ek oklar var. Tarihe yeniden bakmadan, mumun kapanışına dair çalışmalar. M5 ve üzeri TF önerilir. Kullanımı ve yapılandırması kolay parametreler. Farklı parametrelere sahip 2 indikatörü kullanırken, bunları diğer indikatörler olmadan da kullanabilirsiniz. 2 giriş parametresi vardır Döngüsellik ve Sinyal Süresi Bu 2 pa
Unlock hidden profits: accurate divergence trading for all markets Tricky to find and scarce in frequency, divergences are one of the most reliable trading scenarios. This indicator finds and scans for regular and hidden divergences automatically using your favourite oscillator. [ Installation Guide | Update Guide | Troubleshooting | FAQ | All Products ] Easy to trade Finds regular and hidden divergences Supports many well known oscillators Implements trading signals based on breakouts Display
Yazarın diğer ürünleri
Volume Horizon is a horizontal volume indicator that allows you to observe the density of market participants' volumes across various price and time intervals. Volume histograms can be constructed based on ascending or descending market waves, as well as individual bars. This tool enables more precise determination of entry or exit points, relying on levels of maximum volumes or volume-weighted average prices (VWAP). What makes Volume Horizon unique? 1. Segmentation into ascending and descendi
Double Fractal Entry generates precise entry signals based on smart fractal breakouts or rebounds. It visualizes market structure with dynamic channels and plots clear SL/TP levels. A powerful tool for trend and reversal traders. This product is also available for MetaTrader 4 =>  https://www.mql5.com/en/market/product/143602 The indicator generates entry points based on two configurable strategies: Fractal Breakout – when price breaks the last key fractal; Fractal Rebound – when price bounces
Description SuperCCI is an indicator based on the standard CCI indicator. It identifies and displays convergences/divergences in the market and forms the corresponding entry points. Also, using the trading channel index, it determines the direction of the trend and displays the levels of support and resistance . Features Not repaint. Shows entry points. Shows the direction of the current trend and support/resistance levels. Has notifications. Recommendations Use convergence/divergence to ide
Description Range Detector   is an indicator that identifies ranges in the market and displays their presence on the price chart. Recommendations You can use this indicator to determine the flet and, accordingly, to determine the direction of opening a position or closing an opposite position. Parameters Maximum History Bars   - maximum number of history bars for calculating the indicator. Average True Range Period   - ATR indicator period (used to calculate the difference between moving a
Impulse Angle
Denys Babiak
4 (3)
Description Range Detector   is an indicator that identifies impulses in the market and displays their slope angles on the chart. Recommendations You can use this indicator to determine a trend and, accordingly, to determine the direction of opening a position or closing an opposite position. Parameters ===== _INDICATOR_SETTINGS_ =====   - indicator settings Maximum History Bars   - maximum number of history bars for calculating the indicator. Average True Range Period   - ATR indicator p
Volume Magic
Denys Babiak
3.67 (3)
Description Volume Magic is an indicator that shows the value of the relative volume in conjunction with the direction of the current trend. The ratio of the current volume relative to the average volume for a certain period is displayed in the lower window as an oscillator. The direction of the current trend is displayed as two-color trend lines. How to use? First, use two-color trend lines to determine the direction of the current trend. Then look for areas of low volume and open positions
Description Money Zones is an indicator that determines accumulation/distribution zones in the market. Green zones make it possible to look for buy entry points or sell exit points. Red zones, on the contrary, define the opportunity for selling or closing buys. The indicator has the ability to define money zones for two timeframes simultaneously on the same chart. How to use? Use this indicator to identify market zones as support/resistance zones to determine the best conditions for market e
Description Bitcoin Manager is the best indicator for trading Bitcoin cryptocurrency. It is calculated based on the price deviation from the moving average line channel. Ascending and descending arrows indicate potential points and levels for opening buy and sell positions. How to use? We strongly recommend using this indicator on the H1 timeframe. An up arrow indicates a buy level. Down Arrow - Sell Level. Parameters Maximum History Bars - maximum count of history bars to calculate. _GRAP
Description The Quantum Awesome Oscillator indicator is based on the standard Bill Williams Awesome Oscillator (AO) indicator. It has two parts. The lower part is a colored histogram of the oscillator (divided into two sides - above zero and below zero and, accordingly, colored in two colors - blue for buying and red for selling) and a trend curve line (shows the direction of the global trend). The upper part - arrows showing market entry points, as well as dashed lines showing Stop-Loss and Ta
Description The Quantum Awesome Oscillator Pro indicator is based on the standard Bill Williams Awesome Oscillator (AO) indicator. It has two parts. The lower part is a colored histogram of the oscillator (divided into two sides - above zero and below zero and, accordingly, colored in two colors - blue for buying and red for selling) and a trend curve line (shows the direction of the global trend). The upper part - arrows showing market entry points, as well as dashed lines showing Stop-Loss an
Description Trend Influencer is an indicator that determines the potential dynamics of the influence of trend wave movements on the market. The indicator is based on the value of moving averages corrected by the standard deviation. The indicator is displayed as a main dash-dotted moving average and a signal solid moving average. The signal moving average is colored blue or red depending on what type of trend is currently observed in the market. The indicator also draws inhibition levels - blue a
Let us introduce you to a new era of neural indicators for financial markets! Intelligent Moving is a unique indicator that trains its neural network in real time! You no longer need to look for the optimal indicator parameters for each specific situation. No more late signals. The artificial intelligence is able to adapt itself and predict any market movements. Visually, the indicator is drawn as a main solid moving average line, two dotted lines of standard deviations and signal arrows. For
Fractal Bot Gold is a trading bot that utilizes breakout and rebound strategies from fractal levels to determine effective entry points for positions, as well as to set safe stop-losses and take-profits. Combined with the Average True Range (ATR) indicator and precise adaptation to market conditions, it minimizes the impact of market noise and volatility, providing reliable risk management and optimizing profits. The bot’s parameters are carefully optimized and adapted for trading the Gold (XAU
One Good Trade is a simple and effective Forex trading bot that implements the "time determines price" strategy. Its main feature is just one trade per day, executed at the optimal time and in the direction of the current trend. This straightforward approach allows you to take full advantage of favorable market conditions while minimizing risks. Additionally, the bot adjusts to market volatility, ensuring that stop-loss and take-profit levels are set appropriately for current market conditions.
Real Spread Monitor is a powerful indicator that is designed to accurately measure and analyze real spreads, giving traders the ability to compare trading conditions of different brokers. This product is also available for MetaTrader 5 =>  https://www.mql5.com/en/market/product/125768 Key Features of Real Spread Monitor: 1. Two modes of operation: Write mode : In this mode the indicator collects data on real spreads of the selected trading instrument and records them in a file. The spread is r
Position Accelerator is an innovative solution for traders that helps maximize profits by capitalizing on trending market movements. The utility automatically increases the size of your trading positions once they reach a predefined profit level, significantly enhancing your profitability. This product is also available for MetaTrader 5 =>  https://www.mql5.com/en/market/product/126702 How does Position Accelerator work? 1. Acceleration through additional positions: When your open position reac
The ABC Indicator analyzes the market through waves, impulses, and trends, helping identify key reversal and trend-change points. It automatically detects waves A, B, and C, along with stop-loss and take-profit levels. A reliable tool to enhance the accuracy and efficiency of your trading. This product is also available for MetaTrader 5 =>  https://www.mql5.com/en/market/product/128178 Key Features of the Indicator: 1. Wave and Trend Identification:    - Automatic detection of waves based on mov
ZLMA Trend Candles indicator uses an enhanced Zero-Lag Moving Average to highlight key trend shifts, repainting candles in real time. It reacts faster than traditional moving averages, helping you spot potential market turns earlier. Gain clear entry and exit signals and filter out market noise with ease! This product is also available for MetaTrader 5 =>  https://www.mql5.com/en/market/product/129278 1. What Is ZLMA Trend Candles? ZLMA Trend Candles is a MetaTrader 4/5 indicator based on the Z
Trend Risk Analyzer intelligently identifies trends, impulses, and corrections, calculating optimal trade volumes and safe levels for stop-loss and take-profit. Increase your accuracy, reduce risks, and boost your trading profits! This product is also available for MetaTrader 5 =>  https://www.mql5.com/en/market/product/134799 The key feature of Trend Risk Analyzer is its capability to calculate the average range of each market element, enabling traders to set justified stop-loss and take-profi
Double Fractal Entry generates precise entry signals based on smart fractal breakouts or rebounds. It visualizes market structure with dynamic channels and plots clear SL/TP levels. A powerful tool for trend and reversal traders. This product is also available for MetaTrader 5 =>  https://www.mql5.com/en/market/product/143601 The indicator generates entry points based on two configurable strategies: Fractal Breakout – when price breaks the last key fractal; Fractal Rebound – when price bounces
Double Fractal Entry Bot trades automatically using fractal breakouts or rebounds. It detects precise entry points, places SL and TP based on market structure, and includes logic to manage risk and avoid false signals. Simple, smart, and powerful. This product is also available for MetaTrader 5 =>  https://www.mql5.com/en/market/product/143608 Double Fractal Entry Bot is an intelligent trading robot based on the proven logic of the Double Fractal Entry indicator. It analyzes price using upper a
Intelligent Moving Bot — Adaptive EA with Neural Optimization Intelligent Moving Bot is a fully autonomous EA built on the Intelligent Moving indicator. It uses a dynamic MA, ATR-based deviation bands, and virtual trades with a perceptron to optimize parameters on the fly — with no repainting and no manual curve-fitting. This product is also available for MetaTrader 5 =>  https://www.mql5.com/en/market/product/148151 Intelligent Moving indicator is available here =>  https://www.mql5.com/en/
Imbalance Volume Trend is a professional indicator for MetaTrader that combines Fair Value Gap (FVG) / Imbalance zones with volume imbalance analysis and a trend engine based on imbalances . The indicator automatically finds bullish and bearish Fair Value Gaps, paints them on the chart as colored rectangles and calculates the percentage of volume domination of buyers over sellers (or vice versa) inside the breakout candle that created the imbalance. On top of that, it builds a trend of imbalance
Description Range Detector   is an indicator that identifies ranges in the market and displays their presence on the price chart. Recommendations You can use this indicator to determine the flet and, accordingly, to determine the direction of opening a position or closing an opposite position. Parameters Maximum History Bars   - maximum number of history bars for calculating the indicator. Average True Range Period   - ATR indicator period (used to calculate the difference between moving a
Description Range Detector is an indicator that identifies impulses in the market and displays their slope angles on the chart. Recommendations You can use this indicator to determine a trend and, accordingly, to determine the direction of opening a position or closing an opposite position. Parameters ===== _INDICATOR_SETTINGS_ ===== - indicator settings Maximum History Bars - maximum number of history bars for calculating the indicator. Average True Range Period - ATR indicator period (us
Description SuperCCI is an indicator based on the standard CCI indicator. It identifies and displays convergences/divergences in the market and forms the corresponding entry points. Also, using the trading channel index, it determines the direction of the trend and displays the levels of support and resistance . Features Not repaint. Shows entry points. Shows the direction of the current trend and support/resistance levels. Has notifications. Recommendations Use convergence/divergence to ide
Description Volume Magic is an indicator that shows the value of the relative volume in conjunction with the direction of the current trend. The ratio of the current volume relative to the average volume for a certain period is displayed in the lower window as an oscillator. The direction of the current trend is displayed as two-color trend lines. How to use? First, use two-color trend lines to determine the direction of the current trend. Then look for areas of low volume and open positions
Description Money Zones is an indicator that determines accumulation/distribution zones in the market. Green zones make it possible to look for buy entry points or sell exit points. Red zones, on the contrary, define the opportunity for selling or closing buys. The indicator has the ability to define money zones for two timeframes simultaneously on the same chart. How to use? Use this indicator to identify market zones as support/resistance zones to determine the best conditions for market e
Description Bitcoin Manager is the best indicator for trading Bitcoin cryptocurrency. It is calculated based on the price deviation from the moving average line channel. Ascending and descending arrows indicate potential points and levels for opening buy and sell positions. How to use? We strongly recommend using this indicator on the H1 timeframe. An up arrow indicates a buy level. Down Arrow - Sell Level. Parameters Maximum History Bars - maximum count of history bars to calculate. _GRAP
Description Trend Influencer is an indicator that determines the potential dynamics of the influence of trend wave movements on the market. The indicator is based on the value of moving averages corrected by the standard deviation. The indicator is displayed as a main dash-dotted moving average and a signal solid moving average. The signal moving average is colored blue or red depending on what type of trend is currently observed in the market. The indicator also draws inhibition levels - blue a
Filtrele:
İnceleme yok
İncelemeye yanıt