Fibonacci Calculator

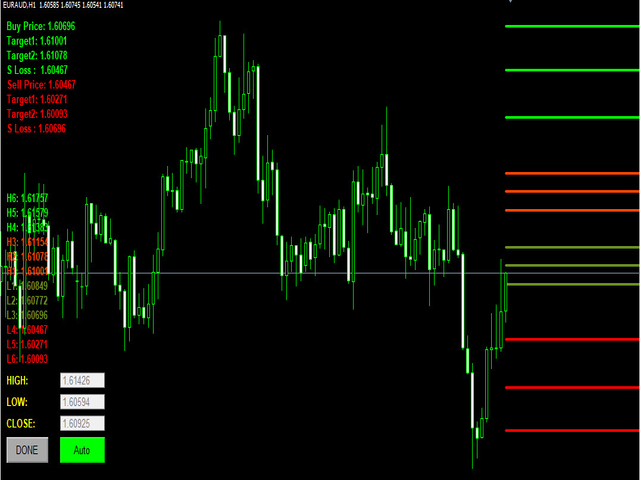
Fibonacci calculator is used with Elliot Waves, it can generate remarkable results. A trader could use these levels or ratios to find high probability trades with very small stop loss. You may also use these ratios to find Elliott Waves extensions and to book profit near those levels. For Elliot Wave experts, Fibonacci calculator is a highly useful tool that can assist them in calculating Fibonacci extension and retracement levels for the market price.

The indicator proves itself as a useful one, as it can be drawn between any two significant price points, such as a high and a low, and then the indicator is going to create the levels between those two points.

Indicator Work with automatic High, Low and Close , we can also provide custom input High, low and Close

Önerilen ürünler
Overview Harmonic Patterns MT4 is a technical analysis indicator designed for the MetaTrader 5 platform. It identifies and displays harmonic price patterns, such as Butterfly, Cypher, Crab, Bat, Shark, and Gartley, in both bullish and bearish directions. The indicator calculates key price levels, including entry, stop loss, and three take-profit levels, to assist traders in analyzing market movements. Visual elements and customizable alerts enhance usability on the chart. Features Detects six ha
The indicator is designed for determining Fibonacci levels. Does not repaint/redraw The blue level shows the zero Fibonacci value (it is also the Pivot level) Red levels show calculated Fibonacci levels (used as a rollback or reversal point) Automatic period detection (periods can be entered manually) Adjustable display calculation method. Settings BarsHistory - the number of bars to be used to display the indicator. Method - method of calculation. AutoPeriod - automated period calculation (true
Fibonacci Retracements Pro
Savia Forex Software Solutions
Fibonacci Retracements Pro The Fibonacci Retracements Pro is a powerful yet easy to use indicator. It automatically plots all the important Fibonacci retracement and extension levels for you. FRP is dynamic powerful and seamlessly adjusts to whatever timeframe you are analyzing. Fibonacci Retracement Pro is optimized for ALL timeframes and ALL Currency pairs, Indices, Commodities, and Cryptocurrency pairs. Trade with improved confidence and maximize your success rate. Benefits Dynamic and Power
Bu gösterge, manuel ve otomatik yöntemlerle çizilen harmonik desenleri tespit edecektir. Lütfen görüşlerinizi ekleyin. Notlar: Bu gösterge bir kontrol paneline sahiptir ve her (grafik ve zaman dilimi) ayarını kaydedecektir. Daha fazla grafik alanı için onu küçültebilir ve diğer analiz araçlarıyla çalışmayı tercih ederseniz tüm gösterge verilerini gizlemek için kapatma düğmesini kullanabilirsiniz. Bu göstergenin ayarlarını değiştirirken Hareketli Ortalama veya Bollinger Bantları gibi göstergeler
NO REPAINT ADVANCED CHART PATTERN INDICATOR By definition, a price ( chart)  pattern is a recognizable configuration of price movement that is identified using a series of  trendlines  and/or curves. When a price pattern signals a change in trend direction, it is known as a reversal pattern; a continuation pattern occurs when the trend continues in its existing direction following a brief pause. Advanced Chart Pattern Tracker is designed to find the MOST ACCURATE patterns. A special script is a
Fibonacci Wave Bands Indicator The Fibonacci Wave Bands indicator utilizes Fibonacci ratios to create dynamic bands around a central moving average. These bands are derived from key Fibonacci ratios (typically 38.2%, 50%, 61.8%) and adapt to market volatility, offering insights into potential support and resistance zones. Key Features: Fibonacci Levels: The indicator plots multiple bands above and below a central moving average based on Fibonacci ratios. Dynamic Support and Resistance: Bands ser
Auto AndrewFork
Noor Ghani Rahman
1 (1)
Auto Pitchfork Indicator The indicator calculate the Pitch fork for the previous Day (Selectable) with multiple Support and Resistance lines from the Median price which acts as Magnet for the Price that if price touch the above warning (1) or below warning (1) lines and not cross up or down then there is maximum possibilities that it will return to the Median Line, and thus maintain the Price Action in Cyclic Pattern to the Market Move. You are able to select how many warning lines you want to k
Market Structure ICT İndikatörü 1. Otomatik Piyasa Yapısı (Market Structure) En büyük avantajı, öznel yorumlamadan kaynaklanan hataları azaltmasıdır. Hassas Trend Tespiti: Trend devamı için BOS (Yapı Kırılımı) ve trend dönüşü için CHoCH (Karakter Değişimi) noktalarını otomatik olarak belirler. Swing Sınıflandırması: Kullanıcı, piyasa yapısı türünü (Kısa, Orta veya Uzun vadeli) seçebilir, bu da hem Scalperlar hem de Swing Traderlar için uygundur. 2. Profesyonel Gösterge Paneli (Dashboard) Diğer z
ForexAurum Fibonacci indicator is a useful tool for traders who are using Fibonacci combined with the ZigZag indicators. It uses the real-time calculation of the levels for all the timeframes and displays the results for you. In addition, you can setup RSI, ADX and Stochastic indicators to confirm entries. How to use it Just drag and drop the indicator on an 1 minute chart of any symbol. Then you can switch to a higher timeframe at anytime after the initialization. Recommendation Always drag a
EchoIndicatorMT4
Phongkrit Phattanawijak
ECHO INDICATOR V2.2 Update A top-quality indicator works with trend and pattern.  The tool is a good assistant for the traders use various levels in trading. When price approaches a level, the indicator produces a sound alert and (or) notifies in a pop-up message, or via push notifications. A great decision making tool for opening orders. Can be used any timeframe and can be customized Easy to trade It implements alerts of all kinds It implements a multi-timeframe   Trade with Trend  + signa
Basic tool Showing annual candle, range for Day, range for Week, range for Month, range for Year. Showing fibonacci for Day fibonacci for Week, fibonacci for Month, fibonacci for Year. Showing percent change for Day, percent change for Week, percent change for Month, percent change for Year. Showing distance of the current value the previous close for Day, Week, Month, Year.
PZ 123 Pattern
PZ TRADING SLU
1 (1)
Unlock powerful breakout opportunities The 123 Pattern is one of the most popular, powerful and flexible chart patterns. The pattern is made up of three price points: a bottom, a peak or valley, and a Fibonacci retracement between 38.2% and 71.8%. A pattern is considered valid when the price breaks beyond the last peak or valley, moment at which the indicator plots an arrow, rises an alert, and the trade can be placed. [ Installation Guide | Update Guide | Troubleshooting | FAQ | All Products ]
Harmonic Pattern Dashboard
Mihails Babuskins
4.2 (5)
harmonic patterns   Harmonic patterns can be used to spot new trading opportunities and pricing trends – but only if you know exactly what you are looking for. Harmonic patterns are formed by combining geometric shapes and Fibonacci levels. As a result, Fibonacci levels are the key concept of these patterns. Identifying harmonic patterns requires more practice than other market classical patterns. But by learning these patterns, you can recognize the future trend of the price chart. These patter
Voenix
Lorentzos Roussos
4.58 (12)
Harmonik desen tarayıcı ve tüccar. Bazı Grafik desenleri de Dahil edilen desenler: ABCD deseni Gartley deseni yarasa deseni şifre deseni 3Sürücü deseni Siyah Kuğu deseni Beyaz Kuğu deseni Quasimodo deseni veya Üzeri Alt deseni Alternatif Yarasa deseni kelebek deseni Derin Yengeç deseni Yengeç deseni Köpekbalığı deseni FiveO deseni baş ve omuzlar desen Artan Üçgen deseni bir iki üç desen Ve 8 özel desen Voenix, 25 çizelge ve fibonacci modelini destekleyen çok zaman dilimli ve çok çiftli bir harm
OB Scanner
Suriya Thammalungka
OB Scanner Indicator — Overview OB Scanner is an enhanced Support & Resistance + Supply & Demand indicator designed to help traders identify where institutions and smart money are placing orders. It scans the chart for: 1. Order Blocks (Improved Demand & Supply Zones) Automatically detects Bullish Order Blocks (Demand) Automatically detects Bearish Order Blocks (Supply) Marks high-probability reversal zones Filters out weak OBs with volume and break-of-structure (BOS) confirmation 2. Buyer
Retracement Hunter This Indicator based on powerfull daily  levels . support and resistance, Buy / Sell entries which is more based on low risk  and high reward and winning ratio, Enter trade  when you get popup alert , book profit on target1, target 2, target3 levels, most of the trending days it will hit target3, but its always safe  to book partial at target1 or target2 Buy best entry when rule 1) look for Buy 2) Emas aligned less than 0.25 3) Main Ema aligned Buy , it will alert when all th
Birden Fazla Sembol ve Zaman Diliminde Efsanevi Gartley Formasyonunu Otomatik Olarak Tespit Edin Gartley formasyonu — 1935'te H.M. Gartley tarafından keşfedilen ve Scott Carney tarafından belirli Fibonacci oranlarıyla geliştirilen — tüm harmonik formasyonların "dedesi" olarak kabul edilmektedir. Hassas B noktası %61,8 geri çekilmesi ve D noktası %78,6 tamamlanması, teknik analizde en güvenilir potansiyel dönüş bölgelerinden birini oluşturur. Doğru biçimde oluşmuş Gartley formasyonlarını manuel o
Fibonacci SR Indicator This indicator creates support and resistance lines. This indicator is based on Fibonacci Retracement and Extension levels. It will consider many combinations of the Fibonacci levels and draw support/resistance lines based on these. This indicator uses tops and bottoms drawn by the ZigZag indicator in its calculations. The ZigZag can also be drawn on the chart, if necessary. The indicator considers many combinations of past reversal points and Fibonacci ratio levels, and w
FREE
This indicator Super Channel Pro indicator.Indicator displays trend movement. Indicator calculates automatically line. Features FiltPer - displays indicator channel period. deviation - displays indicator channel deviation. deviation2 - displays indicator channel deviation. How to understand the status: If the arrow is green, trend is up. If the arrow is red, trend is down. ///////////////////////////////////////////////////////////////////////////////////////////////////////////////////////////
MultiFiboDynamicMT4 is a powerful, professional indicator for estimating the most important support and resistance levels. The main advantage is that it plots the Fibonacci levels at all timeframes simultaneously, which allows the trader to see the full picture of the possible price movement of the trading instrument! Advantages of the indicator The indicator is perfect for scalping and trading binary options. Suitable for beginners and experienced traders. Works on all timeframes. Works on any
FREE
Fibonacci retracements can be used to draw support lines, identify resistance levels, place stop-loss orders and set target prices. The Advanced Automatic Fibonacci retracements draws automatically all the levels. You have a lot of options to choose. For exemple you can use the tracements of another time frame (MTF) in the current chart, you can also choose between the closest level or less close to draw the retracements. You can also add 2 levels of your choice. You can add levels extensions o
SMC Venom Model BPR göstergesi, Akıllı Para (SMC) konseptinde çalışan yatırımcılar için profesyonel bir araçtır. Fiyat grafiğinde iki temel modeli otomatik olarak belirler: FVG   (Adil Değer Açığı), ilk ve üçüncü mum arasında boşluk bulunan üç mumun birleşimidir. Hacim desteğinin olmadığı seviyeler arasında bir bölge oluşturur ve bu da sıklıkla fiyat düzeltmesine yol açar. BPR   (Dengeli Fiyat Aralığı), bir "köprü" oluşturan iki FVG modelinin birleşimidir - bir kırılma bölgesi ve fiyatın düşük
Özel Fırsat : ALL TOOLS , her biri sadece $35 ! New tools   will be   $30   for the   first week   or the   first 3 purchases !  Trading Tools Channel on MQL5 : Join my MQL5 channel to update the latest news from me Volatil bir işlem ortamında, güçlü ve sezgisel bir analiz aracı fırsatları hızla yakalamanıza yardımcı olabilir. Fibonacci Trend Scanner, sadece geleneksel Fibonacci indikatörü ve SuperTrend işlevlerini bir araya getirmekle kalmaz, aynı zamanda para birimi taraması, çoklu zaman dili
This indicator filters the Zigzag indicator to calculate the main support and resistance levels. Variables minimum gap between peaks : is the distance (GAP) between the peaks of the Zigzag peaks sensitivity : Minimum number of nearby peaks look back: it means that it has to test the last 50 peaks in the Zigzag object name perfix: a prefix for level’s line name on chart
FREE
Koala Supply Demand
Ashkan Hazegh Nikrou
5 (3)
MetaTrader 4 için Koala Arz Talep Göstergesi'ni tanıtıyoruz (İster olumlu ister olumsuz olsun, yorumlarınızı veya geri bildirimlerinizi paylaşmanızı öneririz, böylece diğer yatırımcılar da deneyimlerinizden faydalanabilir.) : Koala Supply Demand Göstergesi'ne hoş geldiniz. Bu göstergeler, kesintisiz arz ve talep bölgelerini tanımlamak için tasarlanmıştır. Bu gösterge, tüccarın piyasayı bölge alanları olarak görmesine yardımcı olabilir; fiyatın bazı güçlü bölgelere nasıl saygı gösterdiğini göreb
FREE
DMS Fibo
Diogo Mitsunaga Dos Santos
Fibonacci retracements are trend lines drawn between two significant points, usually between absolute lows and absolute highs, plotted on a chart. Intersecting horizontal lines are placed at the Fibonacci levels. Fibonacci retracements are useful tools that help traders identify support and resistance levels. With the information gathered, they can place orders, identify stop-loss levels, and set price targets. Although useful, traders often use other indicators to make more accurate assessments
Pivot Flow Pro - Trend-structure market direction using pivot highs and lows to form a dynamic bull/bear band. Non-repainting trend-structure indicator that identifies market direction using averaged pivot highs and lows to form a dynamic bull/bear band, with signals confirmed strictly on closed candles. When price closes above or below the adaptive pivot levels, the indicator shifts trend and prints a flip arrow, while continuation dots highlight valid breakout points in the direction of the c
Auto Fibo mw
DMITRII GRIDASOV
"Otomatik FIBO" Kripto-Forex göstergesi, alım satımda harika bir yardımcı araçtır! - Gösterge, Fibo seviyelerini ve yerel trend çizgilerini (kırmızı renk) otomatik olarak hesaplar ve grafik üzerine yerleştirir. - Fibonacci seviyeleri, fiyatın tersine dönebileceği önemli alanları gösterir. - En önemli seviyeler %23,6, %38,2, %50 ve %61,8'dir. - Ters scalping veya bölgesel grid ticareti için kullanabilirsiniz. - Otomatik FIBO göstergesini kullanarak mevcut sisteminizi geliştirmek için birçok fır
The Market Structures Pro indicator finds and displays 5 (five) patterns of the Smart Money Concepts (SMC) system on the chart, namely: Break Of Structures (BoS)       Change of character (CHoCH) Equal Highs & Lows Premium, Equilibrium and Discount zones with Fibo grid High-high, Low-low, High-low and Low-high extremes Patterns are displayed for two modes - Swing and Internal and are easily distinguished by color on the chart. Internal mode features higher contrast colors, finer lines, and smal
The indicator displays Renko bars on the chart, uses them to plot the ZigZag - trend lines connecting the local Lows and Highs of the price movement, and highlights them based on the Gartley patterns, showing the potential price reversal points. Renko - specialized display of the price action, in which the graph is displayed not every bar of the time frame, but only under the condition that the price had passed more than the specified number of points. Renko bars are not bound to a time frame, s
Bu ürünün alıcıları ayrıca şunları da satın alıyor
Gann Made Easy
Oleg Rodin
4.83 (156)
Gann Made Easy , bay teorisini kullanarak ticaretin en iyi ilkelerine dayanan, profesyonel ve kullanımı kolay bir Forex ticaret sistemidir. WD Gann. Gösterge, Zararı Durdur ve Kâr Al Seviyeleri dahil olmak üzere doğru SATIN AL ve SAT sinyalleri sağlar. PUSH bildirimlerini kullanarak hareket halindeyken bile işlem yapabilirsiniz. LÜTFEN ÜCRETSİZ OLARAK TİCARET İPUÇLARI, BONUSLAR VE GANN MADE EA ASİSTANI ALMAK İÇİN SATIN ALIMDAN SONRA BENİMLE İLETİŞİME GEÇİN! Muhtemelen Gann ticaret yöntemlerini b
Scalper Inside PRO
Alexey Minkov
4.74 (69)
An exclusive indicator that utilizes an innovative algorithm to swiftly and accurately determine the market trend. The indicator automatically calculates opening, closing, and profit levels, providing detailed trading statistics. With these features, you can choose the most appropriate trading instrument for the current market conditions. Additionally, you can easily integrate your own arrow indicators into Scalper Inside Pro to quickly evaluate their statistics and profitability. Scalper Inside
M1 Sniper
Oleg Rodin
5 (19)
M1 SNIPER kullanımı kolay bir işlem göstergesi sistemidir. M1 zaman dilimi için tasarlanmış bir ok göstergesidir. Gösterge, M1 zaman diliminde scalping için bağımsız bir sistem olarak kullanılabilir ve mevcut işlem sisteminizin bir parçası olarak kullanılabilir. Bu işlem sistemi özellikle M1'de işlem yapmak için tasarlanmış olsa da, diğer zaman dilimleriyle de kullanılabilir. Başlangıçta bu yöntemi XAUUSD ve BTCUSD ticareti için tasarladım. Ancak bu yöntemi diğer piyasalarda işlem yaparken de ya
Game Changer Indicator
Vasiliy Strukov
4.27 (22)
Game Changer è un indicatore di tendenza rivoluzionario, progettato per essere utilizzato su qualsiasi strumento finanziario, per trasformare il tuo MetaTrader in un potente analizzatore di trend. Funziona su qualsiasi intervallo temporale e aiuta a identificare i trend, segnala potenziali inversioni, funge da meccanismo di trailing stop e fornisce avvisi in tempo reale per risposte tempestive del mercato. Che tu sia un professionista esperto o un principiante in cerca di un vantaggio, questo st
Dynamic Forex28 Navigator
Bernhard Schweigert
4.43 (7)
Dynamic Forex28 Navigator - Yeni Nesil Forex Ticaret Aracı. ŞU ANDA %49 İNDİRİM. Dynamic Forex28 Navigator, uzun zamandır popüler olan göstergelerimizin evrimidir ve üçünün gücünü tek bir göstergede birleştirir: Gelişmiş Döviz Gücü28 Göstergesi (695 inceleme) + Gelişmiş Döviz İMPULS ve UYARI (520 inceleme) + CS28 Kombo Sinyalleri (Bonus). Gösterge hakkında ayrıntılar https://www.mql5.com/en/blogs/post/758844 Yeni Nesil Güç Göstergesi Ne Sunuyor?  Orijinallerde sevdiğiniz her şey, şimdi yeni
Precautions for subscribing to indicator This indicator only supports the computer version of MT4 Does not support MT5, mobile phones, tablets The indicator only shows the day's entry arrow The previous history arrow will not be displayed (Live broadcast is for demonstration) The indicator is a trading aid Is not a EA automatic trading No copy trading function The indicator only indicates the entry position No exit (target profit)  The entry stop loss point is set at 30-50 PIPS Or the front hi
GOLD Impulse with Alert
Bernhard Schweigert
4.64 (11)
Bu gösterge, 2 ürünümüz Advanced Currency IMPULSE with ALERT  +   Currency Strength Exotics  'in süper bir kombinasyonudur. Tüm zaman dilimleri için çalışır ve 8 ana para birimi artı bir Sembol için grafiksel olarak güç veya zayıflık dürtüsünü gösterir! Bu Gösterge, Altın, Egzotik Çiftler, Emtialar, Endeksler veya Vadeli İşlemler gibi herhangi bir sembol için para birimi gücü ivmesini göstermek için uzmanlaşmıştır. Türünün ilk örneğidir, Altın, Gümüş, Petrol, DAX, US30, MXN, TRY, CNH vb. içi
Volatility Trend System - girişler için sinyaller veren bir ticaret sistemi. Oynaklık sistemi, trend yönünde doğrusal ve noktasal sinyaller ve ayrıca yeniden çizme ve gecikme olmaksızın trendden çıkmak için sinyaller verir. Trend göstergesi, orta vadeli trendin yönünü izler, yönünü ve değişimini gösterir. Sinyal göstergesi volatilitedeki değişikliklere dayalıdır ve piyasa girişlerini gösterir. Gösterge, çeşitli uyarı türleri ile donatılmıştır. Çeşitli alım satım araçlarına ve zaman dilimlerine
Trend Screener
STE S.S.COMPANY
4.79 (95)
Trend Göstergesi, Trend Alım Satım ve Filtreleme için Çığır Açan Benzersiz Çözüm, Tüm Önemli Trend Özellikleriyle Tek Bir Araç İçinde Yerleştirildi! Forex, emtialar, kripto para birimleri, endeksler ve hisse senetleri gibi tüm sembollerde/araçlarda kullanılabilen %100 yeniden boyamayan çoklu zaman çerçevesi ve Çoklu para birimi göstergesidir. SINIRLI SÜRELİ TEKLİF: Destek ve Direnç Tarama Göstergesi sadece 50$ ve ömür boyu mevcuttur. (Orijinal fiyat 250$) (teklif uzatıldı) Trend Screener, grafik
RFI levels PRO
Roman Podpora
5 (1)
Bu gösterge, fiyat dönüş noktalarını ve fiyat geri dönüş bölgelerini doğru bir şekilde gösterir.       Başlıca oyuncular   . Yeni trendlerin nerede oluştuğunu görüyorsunuz ve her işlem üzerinde kontrolü elinizde tutarak, azami hassasiyetle kararlar alıyorsunuz. TREND LINES PRO   göstergesiyle birlikte kullanıldığında maksimum potansiyelini ortaya koyar.  VERSION MT5 Göstergenin gösterdiği şey: Yeni bir trendin başlangıcında aktivasyonla birlikte tersine dönüş yapıları ve tersine dönüş seviyeler
Bu indikatörü satın alırsanız, Profesyonel Trade Manager’ımı  + EA   ÜCRETSİZ olarak alacaksınız. Öncelikle, bu Ticaret Sistemi'nin Non-Repainting, Non-Redrawing ve Non-Lagging Göstergesi olduğunu vurgulamak önemlidir, bu da hem manuel hem de robot ticareti için ideal hale getirir. Online kurs, kılavuz ve ön ayarları indir. "Smart Trend Trading System MT5", yeni ve deneyimli tüccarlar için özelleştirilmiş kapsamlı bir ticaret çözümüdür. 10'dan fazla premium göstergeyi birleştiriyor ve 7'den faz
Currency Strength Wizard , başarılı ticaret için size hepsi bir arada çözüm sağlayan çok güçlü bir göstergedir. Gösterge, birden çok zaman dilimindeki tüm para birimlerinin verilerini kullanarak şu veya bu forex çiftinin gücünü hesaplar. Bu veriler, şu veya bu para biriminin gücünü görmek için kullanabileceğiniz, kullanımı kolay para birimi endeksi ve para birimi güç hatları biçiminde temsil edilir. İhtiyacınız olan tek şey, işlem yapmak istediğiniz tabloya göstergeyi eklemektir ve gösterge size
FX Power MT4 NG
Daniel Stein
4.95 (21)
FX Power: Daha Akıllı Ticaret Kararları için Para Birimlerinin Gücünü Analiz Edin Genel Bakış FX Power , her piyasa koşulunda başlıca para birimlerinin ve altının gerçek gücünü anlamak için vazgeçilmez bir araçtır. Güçlü para birimlerini alıp zayıf olanları satarak, FX Power ticaret kararlarınızı basitleştirir ve yüksek olasılıklı fırsatları ortaya çıkarır. İster trendlere sadık kalın ister Delta'nın aşırı değerlerini kullanarak tersine dönüşleri öngörün, bu araç ticaret tarzınıza mükemmel bir
Advanced Supply Demand
Bernhard Schweigert
4.91 (299)
Özel Ticaret –%40 İndirim Yeni Başlayanlar veya Uzman Yatırımcılar İçin En İyi Çözüm! Bu gösterge, bir dizi özel özellik ve yeni bir formül içerdiği için benzersiz, yüksek kaliteli ve uygun fiyatlı bir işlem aracıdır. Bu güncelleme ile çift zaman dilimi bölgeleri gösterebileceksiniz. Sadece daha yüksek bir zaman dilimini değil, hem grafik zaman dilimini hem de daha yüksek zaman dilimini gösterebileceksiniz: İÇ İÇE GEÇMİŞ BÖLGELER GÖSTERİYOR. Tüm Arz Talep yatırımcıları buna bayılacak. :) Önem
Looking for a powerful yet lightweight swing detector that accurately identifies market structure turning points? Want clear, reliable buy and sell signals that work across any timeframe and any instrument? Buy Sell Arrow MT Swing is built exactly for that — precision swing detection made simple and effective. This indicator identifies Higher Highs (HH) , Higher Lows (HL) , Lower Highs (LH) , and Lower Lows (LL) with remarkable clarity. It is designed to help traders easily visualize market stru
Şu anda %40 İNDİRİMLİ! Herhangi bir Acemi veya Uzman Tüccar için En İyi Çözüm! Bu gösterge paneli yazılımı 28 döviz çifti üzerinde çalışıyor. Ana göstergelerimizden 2'sine (Gelişmiş Para Birimi Gücü 28 ve Gelişmiş Para Birimi Dürtüsü) dayanmaktadır. Tüm Forex piyasasına harika bir genel bakış sağlar. Gelişmiş Para Birimi Gücü değerlerini, para birimi hareket hızını ve tüm (9) zaman dilimlerinde 28 Forex çifti için sinyalleri gösterir. Trendleri ve / veya scalping fırsatlarını belirlemek için
Atomic Analyst
Issam Kassas
5 (3)
Öncelikle belirtmek gerekir ki bu Ticaret Göstergesi Yeniden Çizim Yapmaz, Gecikmez ve Gecikme Göstermez, bu da hem manuel hem de robot ticareti için ideal hale getirir. Kullanıcı kılavuzu: ayarlar, girişler ve strateji. Atom Analisti, Piyasada Daha İyi Bir Avantaj Bulmak İçin Fiyatın Gücünü ve Momentumunu Kullanan PA Fiyat Hareketi Göstergesidir. Gürültüleri ve Yanlış Sinyalleri Kaldırmaya ve Ticaret Potansiyelini Artırmaya Yardımcı Olan Gelişmiş Filtrelerle Donatılmıştır. Birden fazla katman
El indicador "MR BEAST ALERTAS DE LIQUIDEZ" es una herramienta avanzada diseñada para proporcionar señales y alertas sobre la liquidez del mercado basándose en una serie de indicadores técnicos y análisis de tendencias. Ideal para traders que buscan oportunidades de trading en función de la dinámica de precios y los niveles de volatilidad, este indicador ofrece una visualización clara y detallada en la ventana del gráfico de MetaTrader. Características Principales: Canal ATR Adaptativo: Calcula
PZ Harmonacci Patterns
PZ TRADING SLU
3.17 (6)
Trade smarter, not harder: Empower your trading with Harmonacci Patterns This is arguably the most complete harmonic price formation auto-recognition indicator you can find for the MetaTrader Platform. It detects 19 different patterns, takes fibonacci projections as seriously as you do, displays the Potential Reversal Zone (PRZ) and finds suitable stop-loss and take-profit levels. [ Installation Guide | Update Guide | Troubleshooting | FAQ | All Products ] It detects 19 different harmonic pric
Step into the world of Forex trading with confidence, clarity, and precision using   Gold Indicator   a next-generation tool engineered to take your trading performance to the next level. Whether you’re a seasoned professional or just beginning your journey in the currency markets, Gold Indicator equips you with powerful insights and help you trade smarter, not harder. Built on the proven synergy of three advanced indicators, Gold Indicator focuses exclusively on medium and long-term trends eli
Trend Lines PRO
Roman Podpora
5 (1)
TREND ÇİZGİLERİ PRO     Piyasanın gerçek yön değişimini anlamaya yardımcı olur. Gösterge, gerçek trend dönüşlerini ve büyük oyuncuların piyasaya yeniden girdiği noktaları gösterir. Anlıyorsun     BOS hatları  Daha yüksek zaman dilimlerindeki trend değişiklikleri ve önemli seviyeler, karmaşık ayarlar veya gereksiz gürültü olmadan gösterilir. Sinyaller yeniden çizilmez ve çubuk kapandıktan sonra grafikte kalır. VERSION MT 5     -    RFI LEVELS PRO  göstergesiyle birlikte kullanıldığında maksimum p
Pips Stalker
Abdulkarim Karazon
5 (2)
Pips Stalker, uzun kısa ok tipi bir göstergedir; gösterge, tüm seviyelerden yatırımcıların piyasada daha iyi kararlar almasına yardımcı olur, gösterge asla yeniden boyanmaz ve ana sinyal mantığı olarak RSI'yı kullanır; bir ok verildikten sonra asla yeniden boyanmaz veya geri boya çizmez ve oklar gecikmez. PIPS STALKER ARROW'UN ÖZELLİKLERİ : İSTATISTIK PANELİ Genel kazanma oranı %'sini ve üst üste maksimum kazanç ve kaybedilen ticaret gibi faydalı istatistikleri ve diğer faydalı bilgileri göst
Meravith
Ivan Stefanov
5 (3)
Market maker aracı. Meravith şunları yapar: Tüm zaman dilimlerini analiz eder ve geçerli trendi gösterir. Alış ve satış hacimlerinin eşit olduğu likidite bölgelerini (hacim dengesi) vurgular. Farklı zaman dilimlerinden tüm likidite seviyelerini doğrudan grafiğinizde gösterir. Referansınız için metin tabanlı piyasa analizi üretir ve sunar. Mevcut trende göre hedefler, destek seviyeleri ve stop-loss noktalarını hesaplar. İşlemleriniz için risk/ödül oranını hesaplar. Hesap bakiyenize göre pozisyon
Owl smart levels
Sergey Ermolov
4.26 (38)
MT5 versiyonu  |  FAQ Owl Smart Levels Indicator ,   Bill Williams'ın gelişmiş fraktalları , piyasanın doğru dalga yapısını oluşturan Valable ZigZag ve kesin giriş seviyelerini gösteren   Fibonacci seviyeleri   gibi popüler piyasa analiz araçlarını içeren tek gösterge içinde eksiksiz bir ticaret sistemidir. pazara ve kar elde edilecek yerlere. Stratejinin ayrıntılı açıklaması Gösterge ile çalışma talimatı Baykuş Yardımcısı ticaretinde Danışman Yardımcısı Kullanıcıların özel sohbeti -> Satın ald
Apollo Secret Trend , herhangi bir çift ve zaman dilimindeki trendleri bulmak için kullanılabilecek profesyonel bir trend göstergesidir. Gösterge, işlem yapmayı tercih ettiğiniz çift veya zaman dilimi ne olursa olsun, piyasa trendlerini tespit etmek için kullanabileceğiniz birincil işlem göstergeniz olabilir. Göstergede özel bir parametre kullanarak sinyalleri kişisel ticaret tarzınıza uyarlayabilirsiniz. Gösterge, PUSH bildirimleri dahil her türlü uyarıyı sağlar. Göstergenin sinyalleri YENİDEN
PRO Renko Sistemi, RENKO grafikleri ticareti için özel olarak tasarlanmış son derece hassas bir ticaret sistemidir. Bu, çeşitli ticaret araçlarına uygulanabilen evrensel bir sistemdir. Sistemi etkin piyasa sana doğru ters sinyallerine erişim hakkı denilen ses nötralize eder. Göstergenin kullanımı çok kolaydır ve sinyal üretiminden sorumlu tek bir parametreye sahiptir. Aracı, seçtiğiniz herhangi bir ticaret aracına ve renko çubuğunun boyutuna kolayca uyarlayabilirsiniz. Yazılımımla karlı bir
System Trend Pro
Aleksandr Makarov
5 (2)
System Trend Pro - This is the best trend trading indicator!!! The indicator no repaint!!!  The indicator has   MTF   mode, which adds confidence to trading on the trend (   no repaint   ). How to trade? Everything is very simple, we wait for the first signal (big arrow), then wait for the second signal (small arrow) and enter the market in the direction of the arrow. (See screens 1 and 2.) Exit on the opposite signal or take 20-30 pips, close half of it, and keep the rest until the opposite
Scalper Vault
Oleg Rodin
5 (36)
Scalper Vault , başarılı bir scalping için ihtiyacınız olan her şeyi size sağlayan profesyonel bir scalping sistemidir. Bu gösterge, forex ve ikili opsiyon tüccarları tarafından kullanılabilecek eksiksiz bir ticaret sistemidir. Önerilen zaman çerçevesi M5'tir. Sistem size trend yönünde doğru ok sinyalleri sağlar. Ayrıca size üst ve alt sinyaller ve Gann piyasa seviyeleri sağlar. Göstergeler, PUSH bildirimleri dahil her türlü uyarıyı sağlar. Göstergeyi satın aldıktan sonra lütfen benimle iletişim
Gold Scalper Super
Aleksandr Makarov
5 (2)
Gold Scalper Super is an easy-to-use trading system. The indicator can be used as a standalone scalping system on the M1 time frame, as well as part of your existing trading system. Bonus: when purchasing an indicator, Trend Arrow Super is provided free of charge, write to us after purchase. The indicator 100% does not repaint!!! If a signal appears, it does not disappear! Unlike indicators with redrawing, which lead to the loss of a deposit, because they can show a signal and then remove it.
No Repaint Bext is a ready-made trading system. Shows when to open and when to close trades, as well as in which direction. Every time a green arrow appears, you need to open a buy trade. Close all buy trades when a red arrow appears. The same goes for the opposite direction, every time a red arrow appears, open sell trades and close them all when a green arrow appears. We use the M5 timeframe for trading. You can trade on any cozy pair. This indicator does not repaint and practically does not
Yazarın diğer ürünleri
The Super Trend is one of the best trend-following indicator for MT5 platforms. It's working fine for real-time trend alerts and accurate signals and it help to identify the best market entry and exit positions.  This indicator is the tool you can  refers to a trend following overlays. It contains two major parameters: the period and the multiplier. Besides, traders should consider default values that include 10 for every true range aтd 3 for the multiplier. 2 Types TP SL you set in input Point
Half Trend TPSL Buy Sell Indicator calculates the open and close of the price bars over the selected period of time and applies its own  calculation method to find an average line of the price movement.  ATR based Take Profit and Stop Loss ATR is a measure of volatility over a specified period of time. The most common length is 14, which is also a common length for oscillators, such as the relative strength index (RSI) and stochastics. A higher ATR indicates a more volatile market, while a lowe
Advanced Camarilla Calculator is one of the most commonly used trading calculators. This calculator can be used to generate levels. Scenario 1 Open price is between H3 and L3 For Long  - Wait for the price to go below L3 and then when it moves back above L3, buy. Stop loss will be when price moves below L4. Target1 - H1, Target2 - H2, Target3 - H3  For Short  -  Wait for the price to go above H3 and then when the price moves back below H3, sell. Stop loss will be when price moves above H4. Targe
Multi Trend Analyzer MT4 indicator provides signals from the following technical trading indicators: RSI, STOCH, STOCHRSI, MACD, ADX, Williams % R, ATR, Oscillator, ROC and Bull/Bear Power. It supports all time frames, from the 1 minute up to the monthly charts. You can change all indicator inputs. Indicator provide total trend summary. We can easily analysis and study market movement .
MACD MULTI TIME FRAME WITH MULTI SYMBOLS  INDICATOR  MACD MTF Indicator visualize all MT4 time frame  and trend based on  Moving Average Convergence Divergence (MACD) strategy . Indicator have settings for MACD customizing and variable "Symbols "EURUSD,USDCHG,...", which is used to define symbols. , Signals are displayed  Buy  , Strong buy  ,  Sell,  Strong Sell,   ### - No Trend Strong  Description The Moving Average Convergence/Divergence indicator is a momentum oscillator primarily used to tr
Super Trend Filter Indicator Super trend Arrow Consider as a Master Candle , If super trend in Buy signal , then signal candle calculate as master candle  and master candle close above the open candle then calculate filter Buy Arrow.  If super trend in Sell signal , then signal candle calculate master candle  and master candle close below the open candle calculate filter Sell Arrow. 3 Target with Trailing Stop Loss 
Multi Indicators Scanner Indicator Scan  ADX ,Moving Average ,ENVELOPE ,SAR , MACD ,RSI  and ATR . We can change all input parameters in chart window. scanner works Multiple Time Frame we can change Timeframe .  Symbol button based on Trend color , we can click button and open chart .  We can also save templates in input.   Default settings Time Frame   1Hour Templates Name  Default Auto Arrange Chart  true
This MACD Magic indicator coded due to inspired in a another similar indicator ,Here Macd Magic calculate Double trend confirmation. With ATR Ratio Based TP point , ATR value input are available in input settings . MACD Magic indicator provides Accurate signals on all Major currency pair and stocks. This indicator Very easy to analysis trend and set target point 
Wolfe Wave Scanner
Jalitha K Johny
4.5 (2)
Wolfe Waves scanner - It scans all the Symbols and identify the movement of price and it gives confidence in trade. It automatically plots  fifth wave breaks out of the channel. According to the theory behind the pattern, a line drawn from the point at the beginning of the first wave and passing through the beginning of the fourth wave predicts a target price for the end of the fifth wave. If a trader properly identifies a Wolfe Wave as it forms, the beginning of the fifth wave represents an op
The Average True Range (ATR) is a tool to measure volatility. ATR MTF (Multi Time Frame) indicator provides all timeframe trends helps to identify in which kind of volatility environment the market .This indicator can be used with any Trading Systems for additional confirmation of trading entries or exits. It is a very helpful tool to calculate Targets and Stops according the current market conditions.
Half Trend TPSL Buy Sell Indicator calculates the open and close of the price bars over the selected period of time and applies its own  calculation method to find an average line of the price movement.  ATR based Take Profit and Stop Loss ATR is a measure of volatility over a specified period of time. The most common length is 14, which is also a common length for oscillators, such as the relative strength index (RSI) and stochastics. A higher ATR indicates a more volatile market, while a lowe
An RSI (Relative Strength Index) MT4 (MetaTrader 4) scanner is a tool used in forex trading to identify overbought or oversold conditions across multiple currency pairs and timeframes. The RSI is a momentum oscillator that measures the speed and change of price movements, typically used to identify potential reversal points in the market. Key Features and Functions of an RSI MT4 Scanner: Multiple Timeframe Analysis : The scanner can analyze various timeframes (e.g., 1 minute, 5 minutes, 15 minut
Product Description: MT4 Trade Copier with Advanced Features MT4  Trade Copier is designed to streamline and enhance your trading experience by allowing seamless replication of trades across multiple accounts. It offers advanced features to cater to different trading needs and preferences. Features: Master/Slave Selection: Easily choose between master and slave modes to manage trades effectively. Multiplier for Slave Accounts: Set a multiplier to adjust the size of trades copied to slave a
BB Scanner MT4  is a powerful, next-generation market scanner that detects Bollinger Bands breakouts across multiple symbols and timeframes. It provides a modern, interactive dashboard that displays signals, entry price, target levels, stop loss, and real-time status — all in one place. Key Features Multi-Symbol & Multi-Timeframe Scanning (auto or custom list) Precise BB Breakout Detection (Buy/Sell with ATR-based targets) Automatic Target 1, Target 2, Stop Loss calculation ️ Modern
A HalfTrend scanner for MT5 (MetaTrader 5) is a technical analysis tool designed to help traders identify trend reversals and trade opportunities in the market. The HalfTrend indicator itself is based on price movements and a specific algorithm that identifies changes in market direction. Here’s a detailed description of an MT5 HalfTrend scanner: Overview The MT5 HalfTrend scanner is an advanced tool that scans multiple currency pairs or financial instruments for potential trend reversal signals
Super Trend Filter Indicator SuperTrend Filter V5.2 MT5 Indicator, as provided in the code, is a custom technical analysis tool designed for  MetaTrader 5 (MT5) to identify market trends, provide trading signals, and display key price levels with a visually appealing interface. Super trend Arrow Consider as a Master Candle, If super trend in Buy signal, then signal candle calculates as master candle  and master candle close above the open candle then calculate filter Buy Arrow.  If super tre
MACD Multi Time Frame Scanner MACD Scanner MT5 is a powerful and easy-to-use dashboard tool that scans the MACD indicator across multiple symbols and multiple timeframes in real-time. It gives you a complete market overview at a glance, helping you spot bullish and bearish MACD crossovers instantly — without switching between charts. 1. Multi-Symbol / Multi-Timeframe Scanning Allow user to set a watchlist (symbols to scan). Scan across multiple timeframes (M1 → MN). Show signals (Bullish / Beari
Filtrele:
Değerlendirme yok
Değerlendirmeye yanıt